The Aesthetics and Fractal Dimension of Electric Sheep pptx
Bạn đang xem bản rút gọn của tài liệu. Xem và tải ngay bản đầy đủ của tài liệu tại đây (6.77 MB, 20 trang )
The Aesthetics and Fractal Dimension
of Electric Sheep
SCOTT DRAVES
RALPH ABRAHAM*
PABLO VIOTTI**
FREDERICK DAVID ABRAHAM***
JULIAN CLINTON SPROTT****
December 24, 2006
Spotworks, 2261 Market St #158, San Francisco, CA 94114 USA
* Mathematics Dept., University of California, Santa Cruz, CA 95064 USA
** Politics Dept., University of California, Santa Cruz, CA 95064 USA
*** Blueberry Brain Institute, 1396 Gregg Hill Road, Waterbury Center,
VT 05677 USA
**** Physics Dept., University of Wisconsin, Madison, WI 53706-1390 USA
Running Head: Aesthetics and Fractal Dimension
1
Abstract
Physicist Clint Sprott demonstrated a relationship between aes-
thetic judgments of fractal images and their fractal dimensions [1993].
Scott Draves, aka Spot, a computer scientist and artist, has created
a space of images called fractal flames, based on attractors of two-
dimensional iterated function systems. A large community of users
run software that automatically downloads animated fractal flames,
known as ‘sheep’, and displays them as their screen-saver. The users
may vote electronically for the sheep they like while the screen-saver
is running. In this report we proceed from Sprott to Spot. The data
show an inverted U-shaped curve in the relationship between aesthetic
judgments of flames and their fractal dimension, confirming and clar-
ifying earlier reports.
2
1 Introduction
This is a report on a new study of aesthetic judgments made by a large
community participating over the internet in a collective art project, the
Electric Sheep, created by Scott Draves. To this system we have applied
the ideas of Clint Sprott of fractal dimension as an aesthetic measure. Our
study thus combines the Electric Sheep of Draves and the fractal aesthetics
of Sprott.
The Electric Sheep home page is available from electricsheep.org. We
begin by describing the Electric Sheep network, and then our project and
results. In short, we find the aesthetic judgments of an internet community
of about 20,000 people on a set of 6,400 fractal images confirms the earlier
findings of a unimodal distribution with a peak near dimension 1.5. We
then r eview the h istory of fractal aesthetics to put this work in context, and
conclude.
2 The Electric Sheep Network
Fractal Flames [Draves, 2004] are a generalized and refined kind of iterated
function system, some examples appear in Figs. 1 and 2. They and the
Electric Sheep network change over time as new versions are released. Here
we describe them as they were when the data for this paper were collected. At
that time in 2004, a flame consisted of two to six nonlinear mappings in two
dimensions. Each of the nonlinear mappings consists of an affine 2x3 matrix
3
composed with a dot product of a parameter vector and a collection of about
20 hand-designed nonlinear basis functions, making for a total parameter
space of about 160 floating point numbers. A point in this space is called a
genome.
Whereas traditional iterated function systems are binary images where
each pixel has either been plotted or not, fractal flames are full-color images
with brightness and color. The brightness is determined by a tone map based
on the logarithm of the density of the attractor, or number of particles, at that
pixel. The color is determined by adding a 3rd coordinate to the iteration
and looking it up in a palette.
The animation of a sheep comes from rotating the matrix parts of its
genome, hence the animation loops seamlessly. Sheep are 128 frames long,
hence lasting 4-5 seconds during playback.
The Electric Sheep [Draves, 2005] consists of the sh eep server and a large
number of clients, which are screen-savers on internet-connected computers
owned by users. When they run, the clients connect to the server to form a
distributed super-computer, which we call the render farm, an idea pioneered
by SETI@Home [Anderson, 2002].
The server keeps about 40 sheep alive, replacing old sheep with new ones
every fifteen minutes or so, as they are completed by the render farm. The
sheep are downloaded to the user’s client. The client may hold thousands of
sheep taking gigabytes of disk space, but the default is only enough space for
100 sheep. If the client’s buffer is full, its oldest and lowest rated sheep are
4
deleted to make room for the new.
Users see the sheep displayed by their screen-savers, and may vote for
or against a sheep by pressing the up and down arrow keys. The votes are
tallied by the server into a rating for each sheep.
Genomes for new sheep come from three sources: randomness, a genetic
algorithm, and user contributions:
random These genomes have most matrix coefficients filled in with random
numbers from [-1, 1], or to a simple symmetry transformation (for
example, rotation by 60 degrees). In each mapping, one nonlinear
coefficient is set to one an d the rest to zero.
evolved These were produced by a genetic algorithm with mutation and
cross-over operators. A sheep’s chance for reproduction is proportional
to its rating so the most popular sheep reproduce the most. Mutations
come from adding noise to the parameters in the genome. Cross-over
is done by combining parts of the genomes of two sheep to form the
child genome. See Draves [2005] for a detailed explanation.
designed These were contributed by users of Apophysis, a Microsoft Win-
dows GUI-application for designing fractal flames by manipulating the
parameters in the genome in real-time at draft quality. The matrices
are represented by dragable triangles, and the nonlinear coefficients
with ordinary text widgets.
5
All sheep, from server reset to reset, comprise a flock. In this project,
we have used the database of flock 165, which lived from March through
October of 2004. The server maintains records of all sheep of the flock,
along with their peak ratings, that is, the highest rating attained during the
sheep’s lifetime, hereafter simply refered to as the rating. These databases
are available for download from the sheep server.
3 The Project and Findings
In the spirit of experimental aesthetics pioneered by Clint Sprott, we expected
a correlation between the fractal dimension and the rating of the sheep. Frac-
tal flames are attractors, or fixed points, of two-dimensional functions, with
an independent third dimension displayed via a color palette, and brightness
determined by density. For simplicity we ignored the color so the dimension
computed here is a real number between zero and two.
Each frame of a sheep animation has a Fractal Dimension, FD. This is
the correlation dimension, or D2 of Grassberger and Procaccia, which we
computed by the algorithm of Sprott [1983]. This works by measuring corre-
lations between points prod uced by the iteration, rather than by analyzing
the resulting image.
The FD of a sheep varies over time, so we define the Average Fractal
Dimension or AFD of a sheep to be the average of 20 frames evenly spaced
(by rotations of 18 degrees) throughout the sheep.
6
Unfortunately it would take too long to compute the AFD of all the sheep,
so Fig. 3 uses the FD of the first frame of each sheep. Fortunately FD and
AFD differ little: Fig. 4 shows the similarity between FD and AFD. We
computed AFD for the 1109 sheep with non-zero rating. Figure 5 shows a
scatter plot of AFD vs FD, the correlation is 0.92.
The flock 165 database contained records of 6,396 sheep where we could
compute the dimension: 2,604 from the genetic algorithm, 2,598 random,
and 1,194 user-designed. We plot two frequency distributions with these four
categories: on the top in Fig. 3 is the number of sheep of that dimension
(bins are 0.05 wide), on the bottom is the sum total of ratings of sheep of
that dimension.
In short, we find that sheep of AFD between 1.5 and 1.8 were greatly
favored by users. The average FD of the designed sheep was 1.49 and the
average AFD of all the sheep weighted by rating was 1.53.
Does this distribution result from user preference and evolution, or simply
a quirk of the algorithm that produces the random genomes? Because the
distribution of purely random genomes in the top of Fig. 3 is markedly
different (with a peak at the maximum possible of 2), but the distribution
of hand-designed sheep is very similar, we determine the bias results from
human preference.
Or perhaps the distribu tion results from the distribution of the sheep,
rather than a distribution of preference. For example, if users voted for
sheep randomly, but more sheep of dimension 1.5 were produced, we would
7
also see a peak at 1.5. To account for this we computed the average rating of
sheep of each dimension (again the bins are 0.05 wide). The results appear
in Fig. 6. The peak moves from 1.5 to between 1.6 and 1.7. However there
is also a peak at 1.15. It is unknown if this is an anomaly due to the low
sample size on this en d of the graph, or if it represents a consistent aesthetic
preference.
4 Fractal Aesthetics
Experimental aesthetics has a long history. For example, Galileo’s father
performed experiments on the aesthetics of musical intervals according to dif-
ferent musical scales, or tunings, published in 1588. Gustav Fechner founded
the field in name starting with his investigation of the golden rectangle [1876].
In 1933, George David Birkhoff, one of the first American m athematicians of
note, suggested a formula for the complexity of an image, and proposed it as
an aesthetic measure. And in 1938, Rashevsky, the father of mathematical
biology, suggested a connection between aesthetics and neurophysiology (see
Berlyne [1971]). Mandelbrot’s work also brought attention to the relation-
ship of fractal mathematics and dynamical systems to the field of aesthetics
[Mandelbrot, 1983; Peitgen & Richter, 1996].
Our own basic area of fractal aesthetics began with the work of Clint
Sprott [1993a,b; 1994; 2003]. This work proposed fractal dimension as a
measure of complexity of a fractal image, and examined its relationship to
8
aesthetic perception.
The 1994 paper reports a preference p eak at dimension 1.51± 0.43 for 2D
iterated function systems by averaging the dimension of the 76 images rated
5 on a scale of 1 to 5 by Sprott himself. In our experiment, the average AFD
of the 76 highest- rated sheep (with ratings of 25 to 170) was 1.52 ± 0.23, a
remarkable agreement.
Sprott’s bo ok [1993] reports a preferred dimension of 1.30 ± 0.20 for
strange attractors. This work was extended by Aks and Sprott [1996], who
measured aesthetic judgments of 24 subjects to 324 fractal images, and by
Fred Abraham et al. [2001] and Mitina & Abraham [2003], who measured the
responses of 18 subjects to 16 images and found dimension 1.54 was preferred
over 0.59, 1.07, and 2.27.
In contrast to the Electric Sheep and t his work, Mitina and Abraham
[2003] used images created as chaotic attractors of a single iterated poly-
nomial function in three dimensions, with the third dimension shown as a
color. Their correlation dimensions were computed from three-dimensional
data, and thus vary between zer o and three.
5 Conclusions
We have confirmed the findings of Sprott, Aks and Sprott, and Fred Abraham
et al. Our group of experimental subjects, as well as the number of images
used, is much larger than the earlier studies, however Fig. 6 remains to be
9
explained. In addition, our research opportunity, the Electric Sheep project,
is ongoing, evolving in complexity, and increasing in size. We have thus the
opportunity to continue posing hypotheses and seeking new results.
10
References
[1] Abraham, F.D., Sprott, J.C., Mitina, O., Osorio, M., Dequito, E.A.,
Pineli, A.M. [2001 and In preparation] Judgments of time, aesthetics,
and complexity as a function of the fractal dimension of images formed
by chaotic attractors. Presented at the annual conference of the Society
for the Chaos Theory in Psychology and the Life Sciences.
[2] Aks, D.J., & Sprott, J.C. [1996] ”Quantifying aesthetic preference for
chaotic patterns,” Empirical Studies of the Arts, 14(1), 1-16.
[3] David Anderson et al [2002] ”SETI@home: An experiment in public-
resource computing,” Communications of the ACM 45: 56–61.
[4] Avital, T., & Cupchik, G.C. [1998] ”Perceiving hierarchical structure
in nonrepresentational paintings,” Empirical Studies of the Arts 16(1),
59-70.
[5] Berlyne, D.E. [1971] Aesthetics and Psychobiology (Appleton-Century-
Crofts, New York).
[6] Berlyne, D.E., & Olgivie, J. [1974] ”Dimensions of perception of paint-
ings.” In D.E. Berlyne (Ed.), Studies in the New Experimental Aes-
thetics: Steps toward an Objective Psychology of Aesthetic Appreciation
(Hemisphere, Washington, DC).
[7] Birkhoff, G.D. [1933] Aesthetic Measure (Harvard, Cambridge, MA).
11
[8] Davis, R.C. [1936] ”An evaluation and test of Birkhoff’s aesthetic mea-
sure and formula,” J. General Psychology, 15, 231-240.
[9] Draves, Scott [2005] ”The Electric Sheep Screen-Saver: A case study
In aesthetic evolution,” Applications of Evolutionary Computing LNCS,
3449.
[10] Draves, Scott. [2004] ”The fractal flame algorithm,” available from
http://flam3.com/flame.pdf.
[11] Fechner, G.T. [1876] Vorschule der
¨
Aesthetik (Breitkopf & H¨artel,
Leipzig).
[12] Grassberger, P., & Procaccia, I. [1983] ”Measuring the st rangeness of
strange attractors,” Physica D, 9, 189-208.
[13] Kuhl, J. [1986] ”Motivational chaos: a simple model.” In D.R. Brown &
J. Veroff (Eds.), Frontiers of Motivational Psychology (Springer-Verlag,
Berlin).
[14] Mandelbrot, B.D. [1983]. The Fractal Geometry of Nature (Freeman,
New York).
[15] Mitina, O.V., & Abraham, F.D. [2003]. ”The use of fractals for the study
of the psychology of perception: psychophysics and personality factors,
a brief report,” Int. J. Modern Physics C, 14(8), 1-14.
12
[16] Peckham, M. [1965]. Man’s Rage for Chaos: Biology, Behavior and the
Arts (Chilton, New York).
[17] Peitgen, H O., & Richter, P.H. [1996]. The Beauty of Fractals: Images
of Complex Dynamical Systems (Spr inger, Berlin).
[18] Pickover, C.A. [1990]. Computers, Pattern, Chaos, and Beauty (St. Mar-
tins, New York).
[19] Rashevsky, N. [1938]. ”Contribution to the mathematical biophysics of
visual perception with special reference to the theory of aesthetic values
of geometrical patterns,” Psychometrika, 3, 253-271.
[20] Sprott, J.C. [1993a]. ”Automatic generation of strange attractors,” Com-
puters & Graphics 17, 325-332.
[21] Sprott, J.C. [1993b]. Strange Attractors: Creating Patterns in Chaos
(M&T, New York).
[22] Sprott, J.C. [1994]. ”Automatic generation of iterated function systems,”
Computers and Graphics, 18, 417-425.
[23] Sprott, J.C. [2003]. Chaos and Time-series Analysis (Oxford: Oxford).
[24] Taylor, R.P., Micolich, A., & Jonas, D. [1999]. ”Fractal analysis of Pol-
lock’s drip paintings,” Nature, 399, 422.
[25] Taylor, R.P., Spehar, B., Wise, J.A., Clifford, C.W.G., Newell, B.R.,
& Martin, T.P. [2003] ”Perceptual and physiological responses to
13
the visual complexity of Pollock’s dripped fractal patterns,” Nonlin-
ear Dynamics, Psychology, and Life Sciences, 9(1), 89-114. Also at:
/>[26] Wundt, W.M. [1874]). Grundgz¨uge der Physiologischen Psychologie (En-
gelmann , Leipzig).
14
Figure Captions
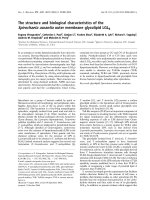
Figure 1. Two sheep (fractal flames) chosen by Draves from the screen-
saver according to his own aesthetic.
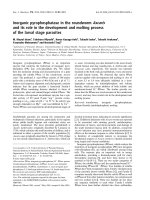
Figure 2. Twelve example sheep. The fractal dimension increases left to
right from 1.25 to 1.5 to 1.7 to 2.0, and the aesthetic rating increases top to
bottom from 5 to 10 to 20.
Figure 3. The top graph shows the frequency distributions of the number
of sheep (on the vertical axis) against their fractal dimension (on the hori-
zontal). The bottom graph shows the sum of the ratings of sheep vs. fractal
dimension (FD). The lines are for the three categories of sheep: designed by
users, random de novo, and evolved, i.e. from the genetic algorithm, plus
one line for all the sheep combined.
Figure 4. Comparison of Fractal Dimension (FD), sampled at time 0,
and Average Fractal Dimension (AFD), computed from 20 evenly sp aced
samples. These curves are for all sheep combined.
Figure 5. Scatter plot of Fractal Dimension (FD) on the horiziontal axis
vs Average Fractal Dimension (AFD) on the vertical, 1109 samples. The
correlation is 0.92.
15
Figure 6. Graph of average rating (left vertical axis) and the sample size
(right vertical axis) against fractal dimension (FD) on the horizontal axis.
The ratings line is omitted where it has less than 100 samples.
16
Figure 1:
Figure 2:
17
0
100
200
300
400
500
0 0.5 1 1.5 2
all
random
evolved
designed
0
200
400
600
800
0 0.5 1 1.5 2
all
random
evolved
designed
Figure 3:
18
0
200
400
600
800
1000
0 0.5 1 1.5 2
AFD
FD
Figure 4:
0
0.5
1
1.5
2
0 0.5 1 1.5 2
Figure 5:
19
0
0.5
1
1.5
2
0 0.5 1 1.5 2
0
200
400
600
average rating
sample size
Figure 6:
20