Event-Based Motion Control for Mobile- Sensor Networks ppt
Bạn đang xem bản rút gọn của tài liệu. Xem và tải ngay bản đầy đủ của tài liệu tại đây (500.23 KB, 9 trang )
34
PERVASIVE
computing
Published by the IEEE CS and IEEE ComSoc
■ 1536-1268/03/$17.00 © 2003 IEEE
SENSOR AND ACTUATOR NETWORKS
Event-Based Motion
Control for Mobile-
Sensor Networks
I
n many sensor networks, considerably
more units are available than necessary for
simple coverage of the space. Augmenting
sensor networks with motion can exploit
this surplus to enhance sensing while also
improving the network’s lifetime and reliability.
When a major incident such as a fire or chemical
spill occurs, several sensors can cluster around
that incident. This ensures good coverage of the
event and provides immediate redundancy in case
of failure.
Another use of mobility comes about if the spe-
cific area of interest (within a larger area) is
unknown during deployment. For example, if a
network is deployed to monitor the migration of
a herd of animals, the herd’s
exact path through an area will
be unknown beforehand. But as
the herd moves, the sensors
could converge on it to get the
maximum amount of data. In addition, the sen-
sors could move such that they also maintain
complete coverage of their environment while
reacting to the events in that environment. In this
way, at least one sensor still detects any events
that occur in isolation, while several sensors more
carefully observe dense clusters of events.
We’ve developed distributed algorithms for
mobile-sensor networks to physically react to
changes or events in their environment or in the
network itself (see the “Related Work” sidebar
for other approaches to this problem). Distribu-
tion supports scalability and robustness during
sensing and communication failures. Because of
these units’ restricted nature, we’d also like to
minimize the computation required and the
power consumption; hence, we must limit com-
munication and motion. We present two classes
of motion-control algorithms that let sensors con-
verge on arbitrary event distributions. These algo-
rithms trade off the amount of required compu-
tation and memory with the accuracy of the
sensor positions. Because of these algorithms’
simplicity, they implicitly assume that the sensors
have perfect positioning and navigation capabil-
ity. However, we show how to relax these as-
sumptions without substantially affecting system
behavior. We also present three algorithms that
let sensor networks maintain coverage of their
environment. These algorithms work alongside
either type of motion-control algorithm such that
the sensors can follow the control law unless they
must stop to ensure coverage. These three algo-
rithms also represent a trade-off between com-
munication, computation, and accuracy.
Controlling sensor location
We assume that events of interest take place at
discrete points in space and time within a given
area. If those events come from a particular dis-
tribution, which can be arbitrarily complex, the
sensors should move such that their positions will
eventually approximate that distribution. In addi-
tion, we’d like to minimize the amount of neces-
Many sensor networks have far more units than necessary for simple
coverage. Sensor mobility allows better coverage in areas where events
occur frequently. The distributed schemes presented here use minimal
communication and computation to provide this capability.
Zack Butler and Daniela Rus
Dartmouth College
sary computation, memory, and com-
munication, while still developing dis-
tributed algorithms. Each sensor, there-
fore, must approximate the event
distribution and must position itself cor-
rectly with respect to it. In particular, for
scalability, we don’t consider strategies
where each sensor maintains either the
entire event history or the locations of
all other sensors. We assume that at least
one sensor can sense each event and
broadcast the event location to the other
sensors, so that every sensor learns about
each event location. (We don’t consider
the particular mechanism of this broad-
cast in this article.) If the initial distri-
bution is uniform, either random or reg-
ular, then the sensors can move on the
basis of the events without explicitly
cooperating with their neighbors. The
two motion-control algorithms we pre-
sent here both use this observation, but
they differ in the amount of storage they
use to represent the history of sensed
events.
History–free techniques
In this class of motion-control algo-
rithms, the sensors don’t maintain any
event history. This approach resembles
the potential–field approaches in for-
mation control and coverage work,
1
which use other robots’ current positions
to determine motion. The main differ-
ence is that our approach considers
event, rather than neighbor, positions.
This technique is appealing due to its
simple nature and minimal computa-
tional requirements. Here we allow each
sensor to react to an event by moving
according to a function of the form
,
where e
k
is the position of event k, and
refers to the position of sensor i after
event k.
The form of function f in this equation
is the important component of this strat-
egy. For example, one simple candidate
function,
,
which treats positions as vector quanti-
ties, causes the sensor to walk toward
the event a short distance proportional
to how far it is from the event. Although
ce x
k
i
k+
−
()
1
x
i
k
xxfexx
i
k
i
kk
i
k
i
++
=+
()
110
,,
OCTOBER–DECEMBER 2003
PERVASIVE
computing
35
P
revious work in sensor networks has inspired this work. We’ve
built on our own work on routing in ad hoc networks
1
and reac-
tive sensor networks.
2
We’ve also built on important contributions
from other groups.
3–5
Massively distributed sensor networks are
becoming a reality, largely due to the availability of mote hardware.
6
Alberto Cerpa and Deborah Estrin propose an adaptive self-configur-
ing sensor network topology in which sensors can choose whether to
join the network on the basis of the network condition, the loss rate,
the connectivity, and so on.
7
The sensors do not move, but the net-
work’s overall structure adapts by causing the sensors to activate or
deactivate. Our work examines mobile-sensor control with the goal of
using redundancy to improve sensing rather than optimize power
consumption.
Researchers have only recently begun to study mobile-sensor
networks. Gabriel Sibley, Mohammad Rahimi, and Gaurav Suk-
hatme describe the addition of motion to Mote sensors, creating
Robomotes.
8
Algorithmic work focuses mainly on evenly dispersing
sensors from a source point and redeploying them for network
rebuilding,
9,10
rather than congregating them in areas of interest.
Related work by Jorge Cortes and his colleagues
11
uses Voronoi
methods to arrange mobile sensors in particular distributions, but
in an analytic way that requires defining the distributions before-
hand. Our work focuses on distributed reactive algorithms for con-
vergence to unknown distributions—a task that researchers have
not previously studied.
REFERENCES
1. Q. Li and D. Rus, “Sending Messages to Mobile Users in Disconnected
Ad Hoc Wireless Networks,” Proc. 6th Ann. Int’l Conf. Mobile Computing
and Networking (MOBICOM 00), ACM Press, 2000, pp. 44–55.
2. Q. Li, M. DeRosa, and D. Rus, “Distributed Algorithms for Guiding Navi-
gation across Sensor Networks,” Proc. 9th Ann. Int’l Conf. Mobile Comput-
ing and Networking (MOBICOM 03), ACM Press, 2003, pp. 313–325.
3. G.J. Pottie, “Wireless Sensor Networks,” Proc. IEEE Information Theory
Workshop, IEEE Press, 1998, pp. 139–140.
4. J. Agre and L. Clare, “An Integrated Architecture for Cooperative Sens-
ing Networks,” Computer, vol. 33, no. 5, May 2000, pp. 106–108.
5. D. Estrin et al., “Next Century Challenges: Scalable Coordination in
Sensor Networks,” Proc. 5th Ann. Int’l Conf. Mobile Computing and Net-
working (MOBICOM 00), ACM Press, 1999, pp. 263–270.
6. J. Hill et al., “System Architecture Directions for Network Sensors,” Proc.
9th Int’l Conf. Architectural Support for Programming Languages and
Operating Systems (ASPLOS 00), ACM Press, 2000, pp. 93–104.
7. A. Cerpa and D. Estrin, “Ascent: Adaptive Self-Configuring Sensor Net-
works Topologies,” Proc. 21st Ann. Joint Conf. IEEE Computer and Com-
munications Societies (INFOCOM 02), IEEE Press, 2002, pp. 1278–1287.
8. G.T. Sibley, M.H. Rahimi, and G.S. Sukhatme, “Robomote: A Tiny Mobile
Robot Platform for Large-Scale Sensor Networks,” Proc. IEEE Int’l Conf.
Robotics and Automation (ICRA 02), IEEE Press, 2002, pp. 1143–1148.
9. M.A. Batalin and G.S. Sukhatme, “Spreading Out: A Local Approach to
Multi-robot Coverage,” Proc. Int’l Conf. Distributed Autonomous Robotic
Systems 5 (DARS 02), Springer-Verlag, 2002, pp. 373–382.
10. A. Howard, M.J. Mataric, and G.S. Sukhatme, “Mobile Sensor Network
Deployment Using Potential Fields: A Distributed, Scalable Solution to
the Area Coverage Problem,” Proc. Int’l Conf. Distributed Autonomous
Robotic Systems 5, Springer-Verlag, 2002, pp. 299–308.
11. J. Cortes et al., “Coverage Control for Mobile Sensing Networks,” IEEE
Int’l Conf. Robotics and Automation (ICRA 03), IEEE Press, 2003, pp.
1327–1332.
Related Work
simple, this turns out not to be a good
choice for most event distributions,
because it causes all the sensors to cluster
around the mean of all events. In fact,
many such update functions have this
effect.
We can identify several useful prop-
erties for f. First, after an event occurs,
the sensor should never move past that
event. Second, the sensors’ motion
should tend to 0 as the event gets fur-
ther away, so that the sensors can sep-
arate themselves into multiple clusters
when the events are likewise clustered.
Finally, it’s reasonable to expect the
update to be monotonic; no sensor
should move past another along the
same vector in response to the same
event.
One way to restrict the update func-
tion is to introduce a dependency on the
distance d between the sensor and the
event, and then always move the sensor
directly toward the event. We can ensure
the desired behavior, using these three
criteria:
∀ d, 0 ≤ f(d) ≤ d
f(∞) = 0
∀ d
1
> d
2
, f(d
1
) – f(d
2
) < (d
1
– d
2
)
One simple function that fulfills these
criteria is f(d) = de
–d
(where e here
refers to the constant 2.718…, not an
event). We can also use other functions
in the family f(d) =
α
d
β
e
–
γ
d
for values
of parameters
α
,
β
, and
γ
such that
α
e
–
γ
d
(
β
d
β
–1
–
γ
d
β
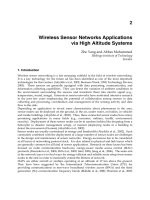
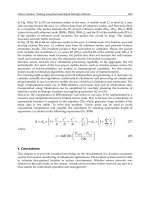
) > 1 ∀ d. We’ve imple-
mented simulations using several func-
tions in this family as update rules, and
Figure 1 shows the results of using this
technique (with
α
= 0.06,
β
= 3,
γ
= 1).
For this particular family of functions,
the parameters can change over a wide
range and still produce fairly reasonable
results, differing in their convergence
speed (primarily dependent on
α
) and in
the region of influence of a cluster of events
(dependent on
β
and
γ
).
History–based techniques
The preceding algorithm needs only
minimal information. The resulting sen-
sor placement is acceptable for many
applications, but with a small amount of
additional information, we can improve
it. Here we explore the benefits of main-
taining event history to improve the sen-
sors’ approximation of the event distrib-
ution. Sensors can use history at each
update to make more informed decisions
about where to go at each step. Letting
them build a transformation of the
underlying space into a space that
matches the event distribution makes this
possible. To limit the amount of neces-
sary memory, this algorithm doesn’t keep
the location of every event. Instead, a
coarse histogram over the space serves to
fix memory use beforehand.
A one-dimensional algorithm. The sim-
plest instantiation of this concept is in
one dimension. 1D event distributions
can enable mapping for many applica-
tions—for example, monitoring roads,
pipelines, or other infrastructure. Here,
the transformed space is simply a map-
ping using the events’ cumulative distri-
bution function.
To determine its correct position, each
sensor maintains a discrete version of the
CDF, which updates after each event. We
scale the CDF on the basis of the number
of events and length l of the particular
interval, such that CDF(l) = l. We then
associate each segment of the CDF with
a proportional number of sensors so that
the sensor density tracks the event den-
sity. Because the sensors are initially uni-
formly distributed, we can accomplish
this by mapping each CDF segment to a
proportional interval of the sensors’ ini-
tial positions. Each sensor calculates its
correct transformed position on the basis
of the inverse of the CDF, evaluated at
its initial position. In other words, a sen-
sor chooses the new position such that
the CDF at this position returns its initial
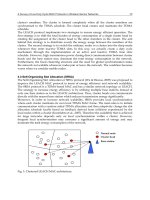
position. The algorithm in Figure 2
describes this process.
This algorithm produces an approxi-
mately correct distribution of sensors
because the number of sensors that map
their current position into the original
x–axis interval is proportional to the
36
PERVASIVE
computing
/>SENSOR AND ACTUATOR NETWORKS
(a) (b) (c)
X
position (unit intervals)
X
position (unit intervals)
X
position (unit intervals)
02468101214161820
0
2
4
6
8
10
12
14
16
18
20
02468101214161820
0
2
4
6
8
10
12
14
16
18
20
02468101214161820
0
2
4
6
8
10
12
14
16
18
20
Y
position (unit intervals)
Y
position (unit intervals)
Y
position (unit intervals)
Figure 1. The results of a mobile-sensor simulation using a history-free update rule (with
α
= 0.06,
β
= 3,
γ
= 1): (a) the initial sensor
positions, generated at random; (b) the positions of a series of 200 events; and (c) the final sensor positions.
event density in that interval. In addi-
tion, the mapping ensures that a sensor
that starts at a given fraction of the way
along the interval moves so that it keeps
the same fraction of events to its left.
Moreover, because the CDF is mono-
tonic, no sensor will pass another when
reacting to an event.
A two-dimensional algorithm. Although
the 1D algorithm has some potential
practical applications, many other mon-
itoring applications over planar domains
exist, such as monitoring forest fires.
However, we can extend the 1D algo-
rithm by building a 2D histogram of the
events and using it to transform the
space similarly. After each event, every
sensor updates the transformed space on
the basis of the event position and deter-
mines its new position by solving a set
of 1D problems using the algorithm in
Figure 2.
When an event occurs, each sensor
updates its representation of the events.
This is the same as incrementing the
appropriate bin of an events histogram,
although the sensors don’t represent the
histogram explicitly. Instead, each sensor
keeps two sets of CDFs, one set for each
axis. That is, for each row or column of
the 2D histogram, the sensor maintains a
CDF, scaled as in the 1D algorithm. We
use this representation rather than a sin-
gle 2D CDF, in which each bin would
represent the number of events below
and to the left, because this latter formu-
lation would induce unwanted depen-
dency between the axes. In a single 2D
CDF, events occurring in two clusters,
such as in Figure 1b, would induce a third
cluster of sensors in the upper right.
After the sensor has updated its data
structure, it searches for its correct next
position. To do this, it performs a series
of interpolations as in the 1D algorithm.
For each CDF aligned with the x-axis,
the sensor finds the value corresponding
to its initial x-coordinate, and likewise
for the y-axis. This creates two sets of
points, which can be viewed as two
chains of line segments: one going across
the workspace (a function of x) and one
that’s a function of y. We can also view
these chains as a constant height contour
across the surface defined by the CDFs.
To determine its next position, a sensor
looks for a place where these two seg-
ment chains intersect. However, given
the nature of these chains’ construction,
more than one such place is possible. So,
our algorithm directs the sensor to go to
the intersection closest to its current posi-
tion. This is somewhat heuristic but is
designed to limit the required amount of
motion, and in practice it appears to pro-
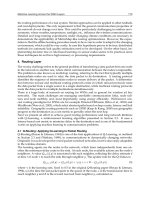
duce good results. Figure 3 shows typi-
cal results, similar to those of other event
distributions.
Because this algorithm updates only
one bin of the histogram, the computa-
tion necessary for the CDF update is
low, equivalent to two 1D calculations,
and the time for the position calcula-
tion is proportional to the histogram
width. In addition, the algorithm has
the useful property that two sensors not
initially collocated won’t try to move to
the same point. Finally, unlike the his-
OCTOBER–DECEMBER 2003
PERVASIVE
computing
37
Figure 2. A one-dimensional history–based algorithm.
(a) (b) (c)
X
position (unit intervals)
X
position (unit intervals)
X
position (unit intervals)
02468101214161820
0
2
4
6
8
10
12
14
16
18
20
02468101214161820
0
2
4
6
8
10
12
14
16
18
20
02468101214161820
0
2
4
6
8
10
12
14
16
18
20
Y
position (unit intervals)
Y
position (unit intervals)
Y
position (unit intervals)
Figure 3. Results of the history–based algorithm: (a) the initial sensor positions, generated randomly; (b) the positions of a series of
200 events; and (c) the sensors’ final positions.
1: for event at position e
k
do
2: Increment CDF bins representing positions ≥ e
k
3: Scale CDF by k/(k +1)
4: Find bins b
i
and b
i+1
with values b
i
≤ x
0
≤ b
i+1
5: Compute position x
c
by interpolation of values of b
i
and b
i+1
tory-free algorithms presented earlier,
this technique will correctly produce a
uniform distribution of sensors, given a
uniform distribution of events, because
each CDF will be linear, and the initial
position’s mapping to the current posi-
tion will be the identity.
Handling uncertainty
The preceding algorithms implicitly
assume that each sensor knows its cur-
rent position and can move precisely to
its desired position at any time. Here we
briefly describe the effects of relaxing this
assumption. Intuitively, we expect that
because these approaches rely on many
sensors in a distribution, nonsystematic
errors will tend not to bias the resulting
sensor distribution. For example, if each
sensor has a small Gaussian error in its
perceived initial position, the perceived
initial distribution will still be close to
uniformly random (in fact, it will be the
convolution of the uniform distribution
with the Gaussian). Similarly, if event
sensing is subject to error, the sensors will
converge toward a distribution that’s the
true error distribution convolved with
the sensing error’s distribution.
When the sensors move under our
algorithms’ control, the situation’s com-
plexity increases somewhat. If we envi-
sion each sensor as a Gaussian blob
around its true position, and each
motion of the sensor induces additional
uncertainty, the sensor’s true position
will be a convolution of these two dis-
tributions. Over time, we would expect
the resultant sensor distribution to be a
smoothed version of the intended distri-
bution. This applies equally to both the
history-free and the history-based algo-
rithms. Although the latter use only the
initial position to compute the intended
position, whereas the former use only
the current position, the position error
should accumulate in the same way
(assuming each position is correct). One
difference is that the history-based algo-
rithm might involve more sensor motion
and, therefore, more opportunity to
accumulate error.
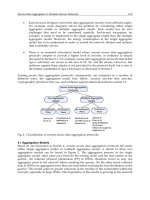
To examine this intuition empirically,
we included noise models for initial-posi-
tion and motion error in the Matlab sim-
ulations. Initial-position noise is Gauss-
ian, whereas we model motion error as
an added 2D Gaussian noise whose vari-
ance is proportional to the distance
moved. Figure 4 shows typical results,
with the same set of initial positions and
events, running with and without noise.
Maintaining coverage of the
environment
Now, we extend the event-driven con-
trol of sensor placement to include cov-
erage of the environment. Under the
algorithms thus far presented, sensor
networks can lose network connectivity
or sensor coverage of their environment.
The ability to maintain this type of cov-
erage while still reacting to events is an
important practical constraint because
it can guarantee that the network
remains connected and monitors the
entire space. This way, the network can
still detect and respond to new events
that appear in currently “quiet” areas.
We assume that each sensor has a lim-
ited communication and sensing range,
and at least one sensor should sense
every point in the environment. Every
sensor moves to maintain coverage, or, if
not required for coverage, follows the
event distribution exactly. This is simi-
lar to space-filling coverage methods,
such as those that use potential fields.
1
In these methods, each robot moves
away from its colleagues to produce a
regular pattern in the space and thereby
complete coverage. You can extend these
space-filling methods to the variable-dis-
tribution case by changing the potential
field strengths on the basis of the event
distribution. In our work, however, the
sensors follow the event distribution
exactly until required for coverage. They
can thus achieve a good distribution
approximation in high-density areas and
good coverage in low-density areas. This
switching technique also simplifies pre-
diction of other sensors’ motions.
Recall that in both the history-free and
the history-based algorithms, each sen-
sor moves according to a simple known
control function. Each sensor can there-
fore predict the motion of other sensors
and use this information to maintain
adequate coverage. Prediction of other
sensor positions requires additional com-
putation, which can be significant if the
update algorithm is complex or there are
many sensors to track. We can avoid this
computation by using communication
whereby each sensor broadcasts its posi-
tion to nearby sensors. However, more
38
PERVASIVE
computing
/>SENSOR AND ACTUATOR NETWORKS
(a) (b)
X
position (unit intervals)
X
position (unit intervals)
02468101214161820
0
2
4
6
8
10
12
14
16
18
20
02468101214161820
0
2
4
6
8
10
12
14
16
18
20
Y
position (unit intervals)
Y
position (unit intervals)
Figure 4. Results of a mobile-sensor simulation under the history-based algorithm:
(a) the final positions of the sensors without noise and (b) the final positions of the
sensors with noise of 25 percent deviation for each motion.
communication also has potential draw-
backs in terms of power use.
Here we present three different meth-
ods for maintaining coverage that use
different amounts of communication
and computation, and we compare their
performance. Each algorithm can work
with either the history-free or the his-
tory-based motion-control algorithms.
Coverage using communication
The first algorithm we describe uses
communication to ensure coverage.
Under this protocol, each sensor main-
tains a circular area of interest around
its current position, and attempts to keep
that area spanned by other sensors. This
implicitly assumes that each device’s
communication and sensing range is cir-
cular. Depending on the task, the area
size can relate to either the device’s com-
munication range or sensor range. After
each event, each sensor broadcasts its
new position to its neighbors to aid cov-
erage. Because this information is useful
only to the sensors in the broadcasting
sensor’s neighborhood, this position
message does not propagate; so, this
scheme is scalable to large networks.
To ensure that coverage is complete,
after each event, each sensor examines
the locations of the sensors in its neigh-
borhood. If any semicircle within its area
of interest is empty, no neighbor covers
a portion of that area. This indicates a
potential loss of coverage. Figure 5 gives
the algorithm for detecting empty semi-
circles, and Table 1 lists this algorithm’s
properties. Once the sensor has learned
its neighbors’ positions, it calculates the
relative angle to each neighbor. The sen-
sor then sorts these angles; any gap
between neighbors equal to π or greater
indicates an empty semicircle.
An empty semicircle within a sensor’s
area of interest indicates potential loss
of coverage. When the sensor finds such
an empty area, it must employ an appro-
priate strategy to ensure coverage. The
first option is simply to remain fixed at
its current position. The second option is
to move a small distance toward the
middle of the open semicircle. The dis-
tance should be small enough so that no
other neighbors move outside the area.
This latter option allows more even cov-
erage but makes predicting other sen-
sors’ positions far more computationally
expensive, so this option is incompati-
ble with the predictive methods de-
scribed next.
This reactive method for ensuring cov-
erage is appealing because it requires lit-
tle additional computation and is still
scalable. However, it’s limited because it
considers only those sensors that are
within its communication range, R
c
.
Predictive methods
Now we describe a way to ensure cov-
erage based on predicting other sensors’
positions. This method involves con-
structing Voronoi diagrams to determine
whether complete coverage exists. (A
Voronoi diagram divides a plane into
regions, each consisting of points closer
to a given sensor than to any other sen-
sor.) This approach reduces double cov-
erage at the expense of the additional
computation required to calculate the
Voronoi diagram. We assume each sen-
sor knows its initial position. In the algo-
rithm’s initialization phase, each sensor
broadcasts this position, letting every
other sensor track that sensor’s location.
This protocol has three versions, based
on the amount of computation that each
sensor must perform. The most compu-
tationally intensive predictive protocol
is not scalable; we present it here as a
benchmark for comparison. In the com-
plete-Voronoi protocol, each sensor cal-
culates every other sensor’s motion and
uses this to compute its Voronoi region
after each event. This ensures the best
performance because each sensor knows
exactly what area it should consider for
coverage. If any part of the sensor’s
Voronoi region is farther away than R
s
,
the sensor knows that no other sensor is
closer to this point and that it should not
move away from this point. (The sensor
needs to check only the region’s vertices,
because the region is always polygonal.)
As long as the sensor maintains its
OCTOBER–DECEMBER 2003
PERVASIVE
computing
39
Figure 5. A communication–based algorithm for ensuring coverage (where
θ
is a vector
of angles to neighbors and
Φ
is a sorted vector of angles).
1: for each neighbor position (x
j
, y
j
) do
2:
θ
j
= arctan[(y
j
– y)/(x
j
– x)]
3: Sort
θ
j
into vector Φ(Φ
0
…Φ
n
)
4: Φ
n+1
= Φ
0
+ 2π
5: ∆Φ
k
= Φ
k–1
– Φ
k
6: if max
k
(∆Φ
k
) > π then
7: Empty area exists, handle as in text
TABLE 1
Properties of the communication-based algorithm
(where s is the total number of sensors in the network, n is a sensor’s number
of neighbors, and O is the standard complexity measure).
Property Value
Communication O(s) messages per event
Computation per sensor per event O(n log n)
Maximum range of neighbor knowledge Communication radius; prone to
double coverage
Connectivity Guaranteed
Voronoi region in this way, overall cov-
erage continues.
Figure 6 shows a typical result of this
technique. The sensors’ Voronoi dia-
gram shows no region larger than R
s
= 3
units from each sensor’s center.
Performing this prediction correctly
involves a recursive problem: Once a sen-
sor has stopped, it’s no longer obeying
the predictive rule. For a sensor to accu-
rately predict the network state, it must
also know which sensors have stopped.
This can occur in two ways. If we desire
no additional communication, each sen-
sor can predict whether other sensors will
stop on the basis of the same Voronoi
region calculation. However, this is a very
large computation, and we can easily
avoid it with just a little communication.
When one sensor stops to avoid cover-
age loss, it sends a broadcast message
with the position at which it stopped.
Other sensors can then assume adherence
to the underlying motion algorithm
unless they receive such a message.
Because each sensor stops only once, only
O(s) broadcasts are required over the
task’s length, rather than s per event.
Table 2 lists the properties of the com-
plete-Voronoi algorithm without and
with communication.
Using the complete-Voronoi diagrams
requires considerable computation, both
to track all the sensors in the network
and to compute the diagram itself. A
scalable predictive protocol, the local-
Voronoi algorithm trades off a little cov-
erage accuracy for a large reduction in
computation. After the initialization in
which all sensors discover the location
of all other sensors, each sensor com-
putes its Voronoi region. As the task pro-
gresses, each sensor tracks only those
sensors that were its neighbors in the
original configuration. It then calculates
its Voronoi region after each event on
the basis of only this subset. It then
examines its Voronoi region in the same
way as in the complete-Voronoi protocol
to determine whether to stop maintain-
ing coverage. Table 3 lists this algo-
rithm’s properties.
As long as the neighbor relationships
remain fairly constant, the local-Voronoi
algorithm can produce results similar to
those of the complete-Voronoi algorithm.
In addition, the local-Voronoi algorithm
makes sensors more conservative about
coverage than the complete algorithm,
because the calculated Voronoi region is
based on a subset of the true neighbors
and so can only be larger than the true
region. When movement is small or gen-
erally in a single direction, the neighbor
relationships remain fairly constant. If
the motion is large or nearby sensors
move in different directions, the neigh-
bor relationships can change. In the lat-
ter case, we can modify the algorithm
slightly by repeating the initialization step
at regular intervals. This lets the sensors
discover their new neighborhood, im-
proving the algorithm’s accuracy while
still limiting communication.
Comparison
To compare the utility of these differ-
ent protocols, we’ve conducted empirical
40
PERVASIVE
computing
/>SENSOR AND ACTUATOR NETWORKS
(a) (b) (c)
X
position (unit intervals)
X
position (unit intervals)
X
position (unit intervals)
02468101214161820
0
2
4
6
8
10
12
14
16
18
20
02468101214161820
0
2
4
6
8
10
12
14
16
18
20
02468101214161820
0
2
4
6
8
10
12
14
16
18
20
Y
position (unit intervals)
Y
position (unit intervals)
Y
position (unit intervals)
Figure 6. Representative results of predictive coverage maintenance: (a) event positions; (b) final sensor positions; and (c) a
Voronoi diagram of sensor positions.
TABLE 2
Properties of the complete-Voronoi algorithm (where C
c
is the amount of computation that the control algorithm requires).
Property Without communication With communication
Communication None O(s
2
)
Computation O(s log s) + O(sn) [coverage] + sC
c
[prediction] O(s log s) + sC
c
Maximum range of neighbor knowledge Arbitrary Arbitrary
Connectivity Not guaranteed Not guaranteed
tests to determine the amount of com-
munication and computation each algo-
rithm requires under various circum-
stances. Because each protocol can work
with either the history-free or the history-
based update algorithms, we present the
communication and computation re-
quired for the coverage-related portion.
In the predictive algorithms, the compu-
tation amount depends on the update rule
used. Table 4 presents the actual amount
of computation used in the Matlab sim-
ulations for each algorithm.
The difference between the last two
algorithms in Table 1 (namely, the use of
occasional global-positioning updates)
is only partially reflected in the commu-
nication and computation columns.
Clearly, the periodic updates require
additional communication, but the ad-
vantage to using this algorithm is that
coverage detection is more accurate.
We can use the number of fixed sen-
sors as a metric for comparing the algo-
rithms. The rightmost columns in Table
1 list the number of sensors that the dif-
ferent algorithms require for coverage
under three different event distributions.
Because coverage was complete in all
cases, the smaller the number here (mean-
ing the fewer sensors required), the bet-
ter. This shows that continual use of orig-
inal neighbors is ineffective. Periodic
updates of the neighborhood can give
results that are almost as accurate as for
the complete algorithm while using far
less computation, and that use less com-
munication than the communication-
based algorithm.
O
ne potential application of
this work is in systems hav-
ing many immobile sensors.
Rather than all sensors being
active at all times, a sparse set of sensors
could be active and scanning for events.
When events occur, different sensors
could become active (and others inac-
tive) to mimic the motion of sensors
described in this article. This would
allow the same concentration of active
sensing resources while limiting the
overall system’s power consumption.
The trade-off between using many
immobile sensors versus fewer mobile
sensors would then depend strictly on
cost—mainly, the sensing elements’ cost.
Thus, costly sensors could be deployed
on mobile platforms, and inexpensive
sensors could be deployed on larger
immobile systems.
We hope to develop other techniques
for sensor positioning and extend our
techniques to more complex tasks, such
as constrained sensor motion and time-
varying event distributions. From an
algorithmic viewpoint, we could apply
an approach similar to Kohonen feature
maps, which use geometry to help clas-
sify underlying distributions. By defin-
ing the sensor closest to an event as the
best fit to the data, we could update the
neighboring sensors after each event.
Rather than updating a virtual network’s
OCTOBER–DECEMBER 2003
PERVASIVE
computing
41
TABLE 3
Properties of the local-Voronoi algorithm.
Property Value
Communication O(s
2
)
Computation O(n log n) + nC
c
Maximum range of neighbor knowledge Arbitrary
Connectivity Not guaranteed
TABLE 4
Comparison of different coverage protocols based on Matlab implementations for common sets of 200 events of different event
distributions in a network of 200 sensors. The rightmost columns give the number of sensors that each algorithm requires for each
of the three different event distributions.
Communication Computation No. of fixed sensors
Algorithm (total no. of messages) (flops per event) Gaussian Diagonal Two lines
Communication-based s per event 65 94 62 36
(Figure 5)
Complete Voronoi s
2
initial 40,000 + sC
c
71 54 47
without communication
Complete Voronoi s
2
initial, < s
2
additional 6,000 + sC
c
71 54 47
with communication
Local Voronoi s
2
initial, < s
2
additional 400 + nC
c
125 156 123
with no neighbor update
Local Voronoi s
2
per update 400 + nC
c
74 62 56
with updates every 20 events
weights, the algorithm would simply
change the sensor positions.
An example of a new application is
one in which the environment has a com-
plex shape or contains obstacles, or in
which the sensors have particular mo-
tion constraints. In these cases, if knowl-
edge of the constraints exists, the sensors
might be able to plan paths to achieve
their correct position, and the network
could propagate this knowledge. The
sensors could also switch roles if doing
so enables more efficient behavior.
Another important situation is one in
which the event distribution changes
over time. There are several different
ways to let the sensors relax toward their
initial distribution, and the best choice
might depend strongly on the task and
its temporal characteristics.
By developing algorithms for these situ-
ations, we hope to produce systems that
can correctly react online to a series of
events in a wide variety of circumstances.
ACKNOWLEDGMENTS
We appreciate the support provided for this work
through the Institute for Security Technology Studies;
National Science Foundation awards EIA–9901589,
IIS–9818299, IIS–9912193, EIA–0202789, and
0225446; Office of Naval Research award N00014–
01–1–0675; and D
ARPA task grant F–30602–00–2–
0585. We also thank the reviewers for their time
and many insightful comments.
REFERENCE
1. A. Howard, M.J. Mataric, and G.S.
Sukhatme, “Mobile Sensor Network
Deployment Using Potential Fields: A Dis-
tributed, Scalable Solution to the Area Cov-
erage Problem,” Proc. Int’l Conf. Distrib-
uted Autonomous Robotic Systems 5
(DARS 02), Springer-Verlag, 2002, pp.
299–308.
For more information on this or any other comput-
ing topic, please visit our Digital Library at http://
computer.org/publications/dlib.
42
PERVASIVE
computing
/>SENSOR AND ACTUATOR NETWORKS
the AUTHORS
Zack Butler
is a research fel-
low in the Institute for Secu-
rity Technology Studies at
Dartmouth College, where
he is also a member of the
Robotics Laboratory in the
Department of Computer
Science. His research inter-
ests include control algorithms for sensor net-
works and distributed robot systems, and de-
sign and control of self-reconfiguring robot
systems. He received his PhD in robotics from
Carnegie Mellon University. He’s a member of
the IEEE. Contact him at ISTS, Dartmouth Col-
lege, 45 Lyme Rd., Suite 300, Hanover, NH
03755;
Daniela Rus
is a professor in
the Department of Com-
puter Science at Dartmouth
College, where she founded
and directs the Dartmouth
Robotics Laboratory. She
also cofounded and co-
directs the Transportable
Agents Laboratory and the Dartmouth Center
for Mobile Computing. Her research interests
include distributed robotics, self-reconfiguring
robotics, mobile computing, and information
organization. She received her PhD in compu-
ter science from Cornell University. She has
received an NSF Career award, and she’s an
Alfred P. Sloan Foundation Fellow and a Mac-
Arthur Fellow. Contact her at 6211 Sudikoff
Lab, Dartmouth College, Hanover, NH 03755;
Visit our
Editorial
Calendar
online
/>