The patterns of admixture, divergence, and ancestry of african cattle populations determined from genome wide snp data
Bạn đang xem bản rút gọn của tài liệu. Xem và tải ngay bản đầy đủ của tài liệu tại đây (1.3 MB, 7 trang )
Gebrehiwot et al. BMC Genomics
(2020) 21:869
/>
RESEARCH ARTICLE
Open Access
The patterns of admixture, divergence, and
ancestry of African cattle populations
determined from genome-wide SNP data
N. Z. Gebrehiwot1*, E. M. Strucken1, H. Aliloo1, K. Marshall2 and J. P. Gibson1*
Abstract
Background: Humpless Bos taurus cattle are one of the earliest domestic cattle in Africa, followed by the arrival of
humped Bos indicus cattle. The diverse indigenous cattle breeds of Africa are derived from these migrations, with
most appearing to be hybrids between Bos taurus and Bos indicus. The present study examines the patterns of
admixture, diversity, and relationships among African cattle breeds.
Methods: Data for ~ 40 k SNPs was obtained from previous projects for 4089 animals representing 35 African
indigenous, 6 European Bos taurus, 4 Bos indicus, and 5 African crossbred cattle populations. Genetic diversity and
population structure were assessed using principal component analyses (PCA), admixture analyses, and Wright’s F
statistic. The linkage disequilibrium and effective population size (Ne) were estimated for the pure cattle
populations.
Results: The first two principal components differentiated Bos indicus from European Bos taurus, and African Bos
taurus from other breeds. PCA and admixture analyses showed that, except for recently admixed cattle, all
indigenous breeds are either pure African Bos taurus or admixtures of African Bos taurus and Bos indicus. The African
zebu breeds had highest proportions of Bos indicus ancestry ranging from 70 to 90% or 60 to 75%, depending on
the admixture model. Other indigenous breeds that were not 100% African Bos taurus, ranged from 42 to 70% or
23 to 61% Bos indicus ancestry. The African Bos taurus populations showed substantial genetic diversity, and other
indigenous breeds show evidence of having more than one African taurine ancestor. Ne estimates based on r2 and
r2adj showed a decline in Ne from a large population at 2000 generations ago, which is surprising for the
indigenous breeds given the expected increase in cattle populations over that period and the lack of structured
breeding programs.
Conclusion: African indigenous cattle breeds have a large genetic diversity and are either pure African Bos taurus
or admixtures of African Bos taurus and Bos indicus. This provides a rich resource of potentially valuable genetic
variation, particularly for adaptation traits, and to support conservation programs. It also provides challenges for the
development of genomic assays and tools for use in African populations.
Keywords: Admixture, African crossbreds, African indigenous, Bos taurus, Bos indicus, Effective population size,
Genetic differentiation, Linkage disequilibrium, SNPs
* Correspondence: ;
1
Centre for Genetic Analysis and Applications, School of Environmental and
Rural Science, University of New England, Armidale, NSW 2351, Australia
Full list of author information is available at the end of the article
© The Author(s). 2020 Open Access This article is licensed under a Creative Commons Attribution 4.0 International License,
which permits use, sharing, adaptation, distribution and reproduction in any medium or format, as long as you give
appropriate credit to the original author(s) and the source, provide a link to the Creative Commons licence, and indicate if
changes were made. The images or other third party material in this article are included in the article's Creative Commons
licence, unless indicated otherwise in a credit line to the material. If material is not included in the article's Creative Commons
licence and your intended use is not permitted by statutory regulation or exceeds the permitted use, you will need to obtain
permission directly from the copyright holder. To view a copy of this licence, visit />The Creative Commons Public Domain Dedication waiver ( applies to the
data made available in this article, unless otherwise stated in a credit line to the data.
Gebrehiwot et al. BMC Genomics
(2020) 21:869
Background
Based on skeletal evidence, Sahara rock art, and Egyptian
dynastic representations, the humpless taurine cattle
(Bos taurus) are thought to be the earliest domestic cattle in Africa [1]. Archaeological evidence suggested that
African cattle were domesticated in the eastern Sahara
10,000 to 8000 years before present (BP) by huntergatherers [2]. But genetic evidence suggests a single domestication event in the Near East and subsequent
crossing with wild aurochs in the southern Fertile Crescent and/or North Africa [3]. Using genome-wide SNP
data of 67 ancient Near Eastern Bos taurus and modern
populations, Verdugo et al. [4] suggested that the ancient Levantine genome affinity with Moroccan aurochs
implies that the distinct phenotypes and genotypes in
African Bos taurus cattle may stem from roots in the
southern Fertile Crescent. In their review of the evidence, Stock and Gifford-Gonzalez [5] concluded that
Bos taurus cattle likely spread across the Sinai and into
the Nile Delta 7000 to 8000 BP, then across North Africa, and subsequently into the Nile and the then-grassy
Sahara, possibly with additional inputs through the Horn
of Africa. Humpless, presumably Bos taurus cattle first
appear to be present south of the Sahara about 4500 to
4000 BP [6, 7]. A few depictions of Egyptian cattle show
humped animals, which are claimed as evidence for the
presence of Bos indicus cattle in Egypt from 3500 BP [8].
The earliest evidence for Bos indicus cattle in subSaharan Africa is in East Africa, where all samples, that
could be analyzed from two sites dated around 2000 to
2500 BP, were of Bos indicus or Sanga (a hybrid of Bos
indicus and Bos taurus) type [9]. This suggests that Bos
indicus genes were already predominant in the pastoral
systems in this region. Payne and Hodges [6] concluded
that Bos taurus cattle, however, remained predominant
in Ethiopia and East Africa until recently despite many
waves of Bos indicus introductions to the region from
about 2500 BP onwards.
Currently, Africa is home to more than 180 cattle
breeds or distinct cattle populations [10], and several authors have made classifications of present-day African
indigenous breeds of cattle. Rege and Tawah [11] suggested four categories of indigenous breeds: Bos taurus,
Bos indicus (zebu), Sanga (Bos taurus × Bos indicus hybrid), and Zenga (Sanga×zebu hybrid). According to
Lenstra and Bradley [12], African Bos taurus breeds are
those that have short ears and no hump, while zebu
breeds are those that have long floppy ears and a prominent hump. Subsequent results based on molecular
marker data [13] and results presented here show that
the genetic diversity of African cattle is more complex
than this, most particularly, no African indigenous
breeds have been shown to be pure Bos indicus. Thus,
the term “zebu”, as applied to African cattle breeds,
Page 2 of 16
means that the breed has a hump, but it does not imply
that the breed is pure Bos indicus, despite much of the
literature using zebu and Bos indicus as synonymous
when applied to African cattle.
Studies of mitochondrial DNA (mtDNA) variation indicated that the two major groups of cattle, Bos taurus
and Bos indicus, were genetically distinct before domestication [14–16]. A PCA result by Verdugo et al. [4]
using genome sequence data on ancient cattle samples
revealed that cattle origins consisted of two divergent
aurochs populations that formed the basis of the Bos
indicus and Bos taurus divide. These authors also
showed, using mtDNA sequence data, that there was
male-driven Bos indicus introgression into the Near East
Bos taurus populations. Studies of microsatellite DNA
and Y-chromosomal markers showed extensive introgression of male Bos indicus genes into existing African
cattle populations [17–19], all of which currently carry
Bos taurus mtDNA, indicating male-driven introgression
of Bos indicus genes into the previously Bos taurus African cattle populations. Based on genome-wide autosomal SNP markers, Weerasinghe et al. [13] showed that
all indigenous cattle breeds from Tanzania, Kenya,
Uganda, and Ethiopia were admixtures of Bos indicus
and African Bos taurus.
The present study provides one of the most extensive
analyses of the genetic diversity of African cattle breeds
based on genome-wide SNP data to date. We undertook
admixture and principal component analyses, Wright’s F
statistic (FST and FIS), and linkage disequilibrium (LD)
analyses to obtain a clear picture of the patterns of admixture and genetic diversity of African indigenous and
crossbred populations and to compare their diversity to
exotic breeds.
Results
Principal components and admixture analyses of
indigenous breeds
Principal component analyses were performed to explore
and visualize the genetic variation between different
breeds and to identify potential sub-structures within
the data. The first five principal components (PC) obtained from an analysis of all indigenous and crossbred
cattle populations from East and West Africa, and including African and European taurine reference breeds
as well as indicine reference breeds, explained a total of
96.1% of the variation in the genomic relationship matrix
(GRM). The first two components accounted for 88.7
and 5.7% of the total genetic variation, respectively, and
differentiated the Bos indicus, European Bos taurus, and
African Bos taurus breeds from each other as the apexes
of a triangle in the plot area (Fig. 1a). The indicine reference breeds, Nelore, Gir, Sahiwal, and Guzerat, grouped
tightly together while the African taurine populations
Gebrehiwot et al. BMC Genomics
(2020) 21:869
Page 3 of 16
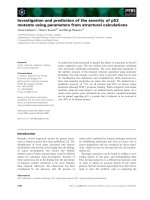
Fig. 1 PC1 vs. PC2 when using the whole dataset. a Showing all African indigenous and reference breeds. b A magnified plot of (a) showing
African samples with Gobra removed
clustered in two distinct groups (Figs. 1a, b, and S1a).
The first African taurine group comprised N’Dama
(from Guinea) and Lagunaire, and the second group included N’Dama1 (from Cote d’Ivoire), N’Dama2 (from
Southeast Burkina Faso), N’Dama3 (from Southwest
Burkina Faso), Lagune, Baoule and Somba. N’Dama2
and especially N’Dama3 appeared to include animals
that spread towards the pooled Bos indicus reference
breeds, showing that they are not pure African taurine
breeds (Fig. 1a, b), and, therefore, these breeds were excluded from the African taurine reference breeds in later
Admixture analyses.
A separate PCA was performed to evaluate in
more detail the genetic structure among the eight
African taurine reference populations (Figure S2).
The first, second, and third PCs explained 32.1, 20.5,
and 7% of the total variance among the African taurine breeds, respectively. Somba and Baoule clustered
tightly together, while all other samples formed separate single clusters, except N’Dama3, which split
into two clusters (for more detailed results, see Gebrehiwot et al. [20]).
The majority of the East African indigenous breeds
that are classified as zebu breeds (Danakil-Harar, BegaitBarka, Ethiopian Boran, Fogera, Iringa-Red, SingidaWhite, Kenyan Boran, Central Highland, and SEAZ),
clustered together on or slightly to the right and at the
indicine end of the axis between indicine and the first
African taurine group (N’Dama and Lagunaire, Fig. 1b).
Note that in Fig. 1b, the Gobra sample has been removed as it is not a pure breed sample, and it obscured
the position of other samples in the plot. The Sheko1,
Maure, Boran Ethiopia1, and Madagascar-zebu clustered
further towards the Africa taurine breeds (i.e., lower Bos
indicus admixture) and spread between the two axes that
connect the indicine to the first African taurine group
(axis 1) versus the second African taurine group (axis 2).
Most of the hybrid animals between Gobra and Maure
(Gobra x Maure) sit in this second cluster, aligning with
axis 1. The Madagascar-zebu is distinct from all the zebu
breeds being the only zebu breed that sits on axis 2.
The Ankole, Djakore, and Sheko (Sanga breeds), and
Bororo and Fulani (zebu breeds) form the third cluster
located more towards the African taurine breeds, with
Ankole and Djakore close to axis 1 and the other breeds
on or slightly to the left of axis 2 (Fig. 1b). The Bororo
(also known as Red Fulani) and Fulani clustered together. Gobra showed a large genetic diversity along axis
1 (Fig. 1a). The Borgou and Kuri lie on axis 2, and the
Ankole-Watusi and Africander lie on axis 1, all more towards African taurine than other breeds. The Tuli forms
an outlier group consistent with high African taurine ancestry but well to the right of axis 1 indicating admixture
with European taurine. Except for one outlier, the composite dual-purpose Mpwapwa breed clustered at the
indicine end but well to the right of axis 1. The
Gebrehiwot et al. BMC Genomics
(2020) 21:869
Moroccan Oulmes Zaer clustered in an intermediary
position between African and European taurine breeds.
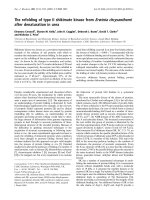
Figures 2 and 3 illustrate the estimated breed ancestries from supervised Admixture Models 1 and 2 with
K = 7 and K = 11, respectively. In Model 1, only one
African taurine breed (N’Dama) was used together with
a pooled indicine sample and five European taurine reference breeds. Model 2 included an additional four
African taurine reference breeds to differentiate the African Bos taurus background. Consistent with the PCA, all
African indigenous breeds, other than the pure African
taurine breeds, were estimated to be an admixture of
indicine and African taurine ancestries. Some breeds
also showed small admixture with European taurine. Absolute estimates of ancestral proportions differed substantially between Admixture Model 1 versus Model 2,
with Model 2 giving lower estimates of indicine ancestry.
However, the ranking of breeds for indicine ancestry
proportion was very similar between Model 1 and Model
2, and the following results summarised here are for
Model 1. Overall, the indicine proportion was lower in
West and South African breeds compared to East
African breeds. However, the West African breeds, especially from Senegal, showed a wide range of Bos indicus
ancestry. For example, the indicine component in Gobra
ranged from 48.5 to 79.8% (average 65.3%), from 64.8 to
70.3% (average 67.8%) in Maure, and from 56.0 to 77.3%
(average 66.2%) in Gobra x Maure crosses (Table 1).
In East Africa, the Ankole, Ankole-Watusi, Sheko, and
Sheko1 showed the lowest indicine proportions ranging
from 55.3 to 67.7% (Fig. 2 and Table 1). Ankole-Watusi,
Ankole, and Ethiopian Boran1 showed average exotic
breed proportions larger than 1%. Ankole-Watusi had
13% exotic taurine ancestry, which was attributed mainly
to Friesians and Ayrshires based on Model 1. The South
Page 4 of 16
African Tuli and Africander had low indicine ancestry
with high levels of exotic taurine ancestry (32 and 10%,
respectively; Fig. 1, Table 1).
The Oulmes Zaer were almost exclusively of taurine
ancestry with 38.8% African and 60% European taurine
ancestry. The synthetic Mpwapwa breed had European
taurine (12%) and indicine (87%) ancestry (Fig. 2, Table
1). The African taurine breeds N’Dama1, Lagune, Lagunaire, and Baoule showed > 99% reference N’Dama ancestry, whereas N’Dama2 and N’Dama3 (sampled from
Southeast and Southwest Burkina Faso, respectively),
and Somba showed a high indicine ancestry (8.4, 11.8
and 4.4% indicine, respectively) (Fig. 2, Table 1).
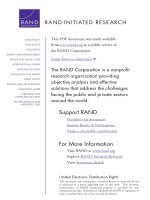
Admixture Model 2, which included five African Bos
taurus breeds as ancestral reference breeds, identified a
difference in the assigned African taurine ancestry between cattle breeds from East, South, and West Africa.
The East and South African breeds had a Somba background predominantly. Begait-Barka was the only East
African breed with more than 1% N’Dama ancestry. The
two South African breeds, Africander and Tuli, showed
6% N’Dama ancestry, while the West African indigenous
breeds had N’Dama background (Fig. 3, Table 1) predominantly. However, Bororo, Fulani, Kuri, and Borgou
also showed some Somba ancestry (7.8, 6.2, 16.7, and
9.9%, respectively), and the latter two also showed a
Lagune background of 3.5 and 6.1%, respectively (Fig. 3,
Table 1). Borgou showed an additional N’Dama1 content
of 2.4%.
Under Model 2, the African taurine proportion of
Oulmes Zaer was 45% Lagune and 2% N’Dama ancestry.
The European breed proportion of Mpwapwa remained
almost unchanged, but the indicine content was reduced,
and African taurine content of 7% N’Dama1 and 1%
Somba was detected (Fig. 3, Table 1). Of the African
Fig. 2 Breed proportion of indigenous African breeds from a supervised (K = 7) Admixture analysis. AYR = Ayrshire, FRI = Friesian, GUE = Guernsey,
HOL = Holstein, JER = Jersey, NDA = N’Dama, INDC = Indicine, SEAZ = Small East African Zebu, ZMA = Madagascar-zebu, DAN = Danakil-Harar,
BEG = Begait-Barka, BOE = Boran-Ethiopia, BOE1 = Boran-Ethiopia1, BOK = Boran-Kenya, FOG = Fogera, IRI = Iringa-Red, SIN = Singida-White, CHL =
Central Highland, MPW = Mpwapwa, ANK = Ankole, ANW = Ankole-Watusi, SHE = Sheko, SHE1 = Sheko1, DJA = Djakore, GOB = Gobra, MAU =
Maure, GOM = Gobra x Maure, BORO = Bororo, FUL = Fulani, KUR = Kuri, BORG = Borgou, OUL = Oulmes Zaer, AFR = Africander, TUL = Tuli, NDA1 =
N’Dama1, NDA2 = N’Dama2, NDA3 = N’Dama3, LAG = Lagune, LAGU = Lagunaire, BAO = Baoule, SOM = Somba
Gebrehiwot et al. BMC Genomics
(2020) 21:869
Page 5 of 16
Fig. 3 Breed proportion of indigenous African breeds from a supervised (K = 11) Admixture analysis. AYR = Ayrshire, FRI = Friesian, GUE =
Guernsey, HOL = Holstein, JER = Jersey, NDA = N’Dama, NDA1 = N’Dama1, LAG = Lagune, BAO = Baoule, SOM = Somba, INDC = Indicine, SEAZ =
Small East African Zebu, ZMA = Madagascar-zebu, DAN = Danakil-Harar, BEG = Begait-Barka, BOE = Boran Ethiopia, BOE1 = Boran Ethiopia1, BOK =
Boran Kenya, FOG = Fogera, IRI = Iringa-Red, SIN = Singida-White, CHL = Central Highland, MPW = Mpwapwaa, ANK = Ankole, ANW = AnkoleWatusi, SHE = Sheko, SHE1 = Sheko1, DJA = Djakore, GOB = Gobra, MAU = Maure, GOM = Gobra x Maure, BORO = Bororo, FUL = Fulani, KUR = Kuri,
BORG = Borgou, OUL = Oulmes Zaer, AFR = Africander, TUL = Tuli, NDA2 = N’Dama2, DNA3 = N’Dama3, LAGU = Lagunaire
taurine breeds that were not used as reference ancestral
breeds, N’Dama2 appeared to be an admixture of all reference African taurine breeds (N’Dama1 = 58.8%, Baoule =
15.7%, N’Dama = 15.3%, Somba = 2.1%, and Lagune =
4.0%) plus 4.1% Bos indicus ancestry. N’Dama3 showed
94.2% N’Dama1 plus 5.2% Bos indicus ancestry. The Lagunaire appeared as 100% Lagune (Fig. 3, Table 1).
Admixture and principal components analyses of
crossbred cattle
Principal components and Admixture analyses were
conducted, including East (Kenya, Uganda, Ethiopia,
and Tanzania) and West (Senegal) African crossbred
animals. Admixture Model 3 with K = 12 extended
Model 2 by adding Montbeliarde as a reference
breed due to its reported use in crossbreeding in
Senegal [21].
Figure 4 shows the PC plots for the same analyses
as in Fig. 1 but with crossbred animals added to the
plot. The crossbreds from Ethiopia, Kenya, and
Tanzania were distributed between the East African
zebu and European dairy breeds, while the crossbred
animals from Uganda were located between the
Ugandan Sanga breed (Ankole) and the European
dairy breeds (Fig. 4a). The Senegal crossbred animals
exhibited a much greater genetic diversity with a
much wider range of both indigenous and exotic
dairy breed ancestries compared to the East African
crossbreds (Fig. 4b).
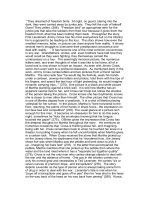
With Admixture Model 3, the crossbred animals
from Kenya showed an average exotic dairy proportion of 69%, mainly from Friesian (23%), followed by
Ayrshire (23%), and Guernsey (16%). The Ugandan
crossbreds showed an average exotic dairy proportion of 62% with the main contribution from
Friesian (38%) and Holstein (14%). The Ethiopian
and Tanzanian crossbred animals showed an average
of 72% exotic dairy proportion; Ethiopian crossbreds
had 36% Friesian and 30% Holstein, and Tanzanian
crossbreds had 31% Friesian, 19% Ayrshire, and 12%
Holstein (Fig. 5, Table 2). The Senegal crossbreds
had an average exotic dairy proportion of 50%, ranging from almost 0 to 98%, and the primary contributions coming from Montbeliarde (22%) and
Holstein (12%) (Fig. 5, Table 2).
Genetic relatedness and differentiation
Inbreeding, as represented by the FIS value, was close to
zero (between − 0.006 to 0.009) for most breeds across
all breed groups (Table S1). The highest positive FIS
value of 0.049 was observed for Somba. The strongest
negative FIS was observed for N’Dama3 (− 0.109).
Breed differentiation, as represented by FST values,
showed a strong divergence within different groups of
breeds (European Bos taurus, African Bos taurus, zebu
types, Sanga types including admixed breeds, and Bos
indicus; Fig. 6, Table S1). Ranked from lowest to highest
genetic differentiation between breeds within groups are
zebu types, Bos indicus, Sanga types, African Bos taurus,
and lastly, European Bos taurus. Some notable outliers
within the breed groups are N’Dama3, which has high
FST with all other Africa Bos taurus breeds; Madagascarzebu with high FST values with all other zebu type
breeds; the South African Africander and Tuli both have
high FST with Sanga type breeds; and Ankole-Watusi
which has a relatively high FST with other Sanga breeds.
Extent and decay of linkage disequilibrium
The decay of squared correlations (r2) and adjusted
squared correlation (r2adj) between phased alleles of
Gebrehiwot et al. BMC Genomics
(2020) 21:869
Page 6 of 16
Table 1 Admixture proportions from supervised analyses (mean ± SD) of African indigenous breeds for indicine, African taurine and
total European taurine ancestry
Breed
K=7
K = 11
Indicine
N’Dama
EUT
Indicine
Baoule
0.01 ± 0.02
0.99 ± 0.02
0
Fixed ancestral breeds
Somba
0.04 ± 0.01
0.95 ± 0.01
0
N’Dama
Somba
EUT
NDA1 + LAG+BAO
Lagune
0
0.99 ± 0.00
0
N’Dama1
0
0.99 ± 0.00
0
N’Dama2
0.08 ± 0.03
0.93 ± 0.03
0
0.04 ± 0.02
0.15 ± 0.05
0.02 ± 0.02
0
0.79 ± 0.12
N’Dama3
0.12 ± 0.04
0.88 ± 0.04
0
0.05 ± 0.04
0
0
0
0.95 ± 0.06
Lagunaire
0
0.99 ± 0.00
0
0
0
0
0
0.99 ± 0.00
Africander
0.42 ± 0.01
0.48 ± 0.02
0.10 ± 0.02
0.23 ± 0.01
0.06 ± 0.01
0.67 ± 0.02
0.04 ± 0.03
0
Tuli
0.32 ± 0.02
0.36 ± 0.02
0.32 ± 0.04
0.18 ± 0.02
0.06 ± 0.02
0.49 ± 0.01
0.26 ± 0.07
0.01 ± 0.01
Djakore
0.57 ± 0.02
0.43 ± 0.02
0
0.46 ± 0.02
0.52 ± 0.02
0.01 ± 0.01
0
0
Gobra
0.65 ± 0.06
0.35 ± 0.06
0
0.55 ± 0.06
0.45 ± 0.06
0.00 ± 0.01
0
0
Maure
0.68 ± 0.02
0.32 ± 0.02
0
0.57 ± 0.02
0.41 ± 0.02
0.02 ± 0.02
0
0
GobraxMaure
0.66 ± 0.06
0.33 ± 0.07
0.01 ± 0.01
0.56 ± 0.06
0.43 ± 0.07
0.01 ± 0.01
0.01 ± 0.01
0
Bororo
0.73 ± 0.02
0.27 ± 0.02
0
0.61 ± 0.02
0.31 ± 0.02
0.08 ± 0.02
0
0
Fulani
0.71 ± 0.03
0.29 ± 0.03
0
0.60 ± 0.03
0.34 ± 0.02
0.06 ± 0.02
0
0.01 ± 0.01
Kuri
0.50 ± 0.02
0.50 ± 0.02
0
0.38 ± 0.02
0.40 ± 0.02
0.17 ± 0.02
0
0
Borgou
0.47 ± 0.07
0.53 ± 0.07
0
0.37 ± 0.06
0.32 ± 0.03
0.10 ± 0.02
0
0.21 ± 0.01
Ankole
0.61 ± 0.02
0.36 ± 0.02
0.03 ± 0.02
0.37 ± 0.02
0
0.62 ± 0.02
0.00 ± 0.01
0
Ankole-Watusi
0.55 ± 0.02
0.32 ± 0.02
0.13 ± 0.04
0.35 ± 0.02
0
0.59 ± 0.02
0.06 ± 0.05
0
SEAZ
0.81 ± 0.02
0.18 ± 0.01
0.01 ± 0.01
0.64 ± 0.02
0
0.36 ± 0.02
0
0
Madegascar-zebu
0.85 ± 0.03
0.15 ± 0.01
0.01 ± 0.02
0.69 ± 0.03
0
0.31 ± 0.02
0.01 ± 0.02
0
Danakil-Harar
0.88 ± 0.01
0.12 ± 0.01
0
0.74 ± 0.01
0
0.26 ± 0.01
0
0
Begait-Barka
0.85 ± 0.04
0.14 ± 0.04
0.01 ± 0.04
0.72 ± 0.03
0.03 ± 0.02
0.24 ± 0.03
0.01 ± 0.01
0.00 ± 0.01
Boran Ethiopia
0.87 ± 0.01
0.13 ± 0.01
0
0.72 ± 0.01
0
0.28 ± 0.01
0
0
Boran Ethiopia1
0.83 ± 0.02
0.12 ± 0.01
0.06 ± 0.01
0.69 ± 0.01
0
0.26 ± 0.01
0.05 ± 0.01
0
Boran Kenya
0.90 ± 0.01
0.10 ± 0.01
0
0.75 ± 0.01
0
0.25 ± 0.01
0
0
Fogera
0.84 ± 0.01
0.16 ± 0.01
0
0.69 ± 0.01
0
0.30 ± 0.02
0.00 ± 0.02
0
Iringa-Red
0.85 ± 0.03
0.14 ± 0.01
0.01 ± 0.03
0.68 ± 0.02
0
0.31 ± 0.01
0.01 ± 0.02
0
Singida-White
0.87 ± 0.01
0.13 ± 0.01
0
0.71 ± 0.02
0
0.29 ± 0.01
0
0
Central Highland
0.85 ± 0.13
0.15 ± 0.01
0.00 ± 0.01
0.70 ± 0.02
0
0.30 ± 0.012
0
0
Sheko
0.67 ± 0.02
0.32 ± 0.01
0.01 ± 0.01
0.48 ± 0.02
0.00 ± 0.01
0.51 ± 0.02
0
0
Sheko1
0.67 ± 0.02
0.32 ± 0.01
0.01 ± 0.01
0.49 ± 0.02
0.01 ± 0.01
0.50 ± 0.02
0
0
Mpwapwa
0.87 ± 0.03
0.01 ± 0.02
0.12 ± 0.03
0.81 ± 0.03
0
0.01 ± 0.02
0.11 ± 0.05
0.07 ± 0.02
Oulmes Zaer
0.01 ± 0.01
0.38 ± 0.04
0.60 ± 0.04
0
0.02 ± 0.03
0
0.52 ± 0.09
0.45 ± 0.05
EUT 5 European Bos taurus breeds, NDA1 N’Dama1, LAG Lagune, BAO Baoule
pairwise SNP loci over increasing genome distances is illustrated in Fig. 7a and b, respectively, for the nine
African indigenous breeds that had more than 20 animals after removing highly related animals from the
data. Ankole had higher r2 and a lower rate of r2 decay,
and Gobra showed lower r2 and a higher rate of r2 decay
than the other populations across all distances (Fig. 7a),
which translates into the lowest and highest estimates of
Ne across all times, respectively.
Past effective population size before and after adjusting
r2 for sample size
Ne was calculated for various generations in the past
using r2 and r2adj for the nine African indigenous breeds
Gebrehiwot et al. BMC Genomics
(2020) 21:869
Page 7 of 16
Fig. 4 PC1 vs. PC2 plot for African indigenous, crossbred, and reference breeds. a East African crossbreds. b Senegal crossbreds
in the analyses. Ne estimates using r2 declined steadily
over time for all breeds (Fig. 8a). Except for Ankole,
which showed a steady decline across all periods, the Ne
estimates using r2adj declined until around 200 generations ago and then held steady or increased markedly
until 30 to 5 generations ago before declining again.
Gobra showed the highest and Ankole the lowest Ne
at all generations using r2, with 107 and 18 at 1 generation ago, and 6544 and 4633 at 2000 generations ago,
respectively. Similarly, estimates of Ne based on r2adj for
Gobra were highest at generation 1 and 2000, with 3418
and 6809, respectively, while the lowest Ne was found
for Ankole, with 272 at generation 1 and 5557 at generation 2000. Estimated Ne using r2 for Bororo, SEAZ,
Danakil-Harar, Fogera, Boran Ethiopia, and Begait-Barka
at 1 and 2000 generations ago were 19 and 4687, 19 and
4812, 20 and 5005, 24 and 5063, 25 and 5168, 25 and
5255, respectively, while estimates of Ne using r2adj were
743 and 5630, 576 and 5790, 410 and 6006, 665 and
5899, 363 and 5964, and 659 and 6109, respectively.
Thus, across the nine breeds, the finite sampling adjustment to r2 increased Ne 14.8 to 39.2 fold at generation 1
and 1 to 1.2 fold at 2000 generations ago.
Discussion
Genetic diversity and relationships
Depending on the used data and underlying assumption
about biological clocks, estimates of divergence between
Bos taurus and Bos indicus vary from approximately 200,
000 to 300,000 years BP [3, 14, 16, 22, 23], to 575,000 to
Fig. 5 Breed proportion of crossbred cattle from a supervised (K = 12) Admixture analysis