Differential expression in leaves of saccharum genotypes contrasting in biomass production provides evidence of genes involved in carbon partitioning
Bạn đang xem bản rút gọn của tài liệu. Xem và tải ngay bản đầy đủ của tài liệu tại đây (1.44 MB, 7 trang )
Correr et al. BMC Genomics
(2020) 21:673
/>
RESEARCH ARTICLE
Open Access
Differential expression in leaves of
Saccharum genotypes contrasting in
biomass production provides evidence of
genes involved in carbon partitioning
Fernando Henrique Correr1 , Guilherme Kenichi Hosaka1 , Fernanda Zatti Barreto2, Isabella Barros Valadão2,
Thiago Willian Almeida Balsalobre2 , Agnelo Furtado3 , Robert James Henry3 ,
Monalisa Sampaio Carneiro2 and Gabriel Rodrigues Alves Margarido1*
Abstract
Background: The development of biomass crops aims to meet industrial yield demands, in order to optimize
profitability and sustainability. Achieving these goals in an energy crop like sugarcane relies on breeding for sucrose
accumulation, fiber content and stalk number. To expand the understanding of the biological pathways related to
these traits, we evaluated gene expression of two groups of genotypes contrasting in biomass composition.
Results: First visible dewlap leaves were collected from 12 genotypes, six per group, to perform RNA-Seq. We
found a high number of differentially expressed genes, showing how hybridization in a complex polyploid system
caused extensive modifications in genome functioning. We found evidence that differences in transposition and
defense related genes may arise due to the complex nature of the polyploid Saccharum genomes. Genotypes
within both biomass groups showed substantial variability in genes involved in photosynthesis. However, most
genes coding for photosystem components or those coding for phosphoenolpyruvate carboxylases (PEPCs) were
upregulated in the high biomass group. Sucrose synthase (SuSy) coding genes were upregulated in the low biomass
group, showing that this enzyme class can be involved with sucrose synthesis in leaves, similarly to sucrose
phosphate synthase (SPS) and sucrose phosphate phosphatase (SPP). Genes in pathways related to biosynthesis of cell
wall components and expansins coding genes showed low average expression levels and were mostly upregulated
in the high biomass group.
Conclusions: Together, these results show differences in carbohydrate synthesis and carbon partitioning in the
source tissue of distinct phenotypic groups. Our data from sugarcane leaves revealed how hybridization in a
complex polyploid system resulted in noticeably different transcriptomic profiles between contrasting genotypes.
Keywords: Sugarcane, Gene expression, Transcriptomics, RNA-Seq, Polyploid
* Correspondence:
1
Department of Genetics, University of São Paulo, “Luiz de Queiroz” College
of Agriculture, Av Pádua Dias, 11, Piracicaba 13400-970, Brazil
Full list of author information is available at the end of the article
© The Author(s). 2020 Open Access This article is licensed under a Creative Commons Attribution 4.0 International License,
which permits use, sharing, adaptation, distribution and reproduction in any medium or format, as long as you give
appropriate credit to the original author(s) and the source, provide a link to the Creative Commons licence, and indicate if
changes were made. The images or other third party material in this article are included in the article's Creative Commons
licence, unless indicated otherwise in a credit line to the material. If material is not included in the article's Creative Commons
licence and your intended use is not permitted by statutory regulation or exceeds the permitted use, you will need to obtain
permission directly from the copyright holder. To view a copy of this licence, visit />The Creative Commons Public Domain Dedication waiver ( applies to the
data made available in this article, unless otherwise stated in a credit line to the data.
Correr et al. BMC Genomics
(2020) 21:673
Background
Bioenergy crops are cultivable species with favorable
traits as feedstocks for the production of energy [1]. One
such biofuel is ethanol, which is produced from the conversion of plant carbohydrates. The disaccharide sucrose
is easily converted into ethanol by fermentation, but
starch and lignocellulosic polymers have to be converted
into monosaccharides prior to fermentation [1, 2].
Lignocellulosic biomass must be disrupted with enzymatic or physical methods as a pretreatment to form a hydrolysable material [2]. Sugarcane culms have been used
to produce ethanol from sugar juice fermentation and
bagasse, which is also burned to generate electricity. As
a result, sugarcane leaves form part of the straw
remaining in the field after harvesting. This residual can
be used as a biomass source in mills or deposited on the
soil to form organic matter. Thus, leaves are a potential
biomass supplement to increase the energy supply [3, 4].
Sugarcane species are members of the genus Saccharum, of the Poaceae family. There are two ancestral
species, S. robustum and S. spontaneum. The former was
the ancestor of the cultivated S. officinarum and S. edule
[5, 6]. Other two cultivated species, S. barberi and S.
sinense, are derived from crosses between S. officinarum
and S. spontaneum [5, 6]. Genotypes of S. officinarum
were used for cultivation due to their high capacity to
produce and store sucrose. Sugarcane stalks are the primary source of sucrose for industrial purposes and have
historically been the main target of breeding efforts [7].
Later, crosses of S. officinarum with S. spontaneum were
proposed to avoid abiotic and biotic stresses. Recently,
breeding programs have directed efforts to obtain more
fibrous genotypes - the so-called energy canes. Because
wild genotypes show substantial variability [8, 9], they
can be used as a source to introgress traits such as fiber
content and stalk number, increasing total biomass yield
[10].
Modern sugarcane breeding can benefit from a molecular framework to unravel the underlying genetic
basis of important traits. Polyploidy is an inherent characteristic of the Saccharum genomes, with S. officinarum
presenting 80 chromosomes (2n = 8x = 80) and ancient
genotypes with a large chromosome number variation
[11]. More than 80% of the chromosomes of modern hybrids come from S. officinarum, 10–20% from S. spontaneum and the remaining are recombinants. There is also
aneuploidy in the homeologous groups [12]. The high
ploidy in cultivars results in a complex genome of 10
Gbp, that can be represented by an x = 10 monoploid
genome [6]. Despite this genomic complexity, progress
has been achieved in understanding the role of proteins
in carbon partitioning to sucrose or cell wall. Several
studies have investigated gene expression to improve understanding of changes in pathways among different
Page 2 of 16
plant parts. This has identified the expression of enzymes involved in sucrose metabolism [13, 14], like sucrose synthase, that can show organ-specific expression
patterns [15, 16]. The expression of genes coding proteins related to cellulose, hemicellulose and lignin metabolism was explored by comparing genotypes
contrasting in biomass or in cell wall-related traits [17,
18]. Genes coding for enzymes of the lignin pathway
were stimulated in a high-biomass genotype [18], and
their expression levels were higher in bottom rather than
top internodes [17]. Singh and colleagues [19] found that
high-biomass genotypes of an F2 population were more
photosynthetically active, as a result of the upregulation
of genes coding for photorespiration, Calvin cycle and
light reaction proteins.
A wide range of functional categories have been found
in studies of gene expression in sugarcane leaves including transporter activity, regulation, response to stimulus
and to stress [14, 20]. In addition to their direct use as a
biomass source, leaves are the source tissue with which
plants produce photoassimilates used to maintain leaf
activities and for cell wall synthesis or sucrose accumulation in vacuoles of the stalks and sink organs [21]. Determining the regulation of genes functionally related to
biomass-associated traits has value for potential biotechnological applications [1]. To achieve this, we must enhance our knowledge about genes involved in processes
of carbohydrate metabolism, especially those related to
production of sucrose and lignocellulosic components.
To that end, we evaluated the transcriptomes of twelve
diverse sugarcane genotypes divided into two contrasting
biomass groups. The broad diversity of these genotypes
is reflected by the presence of four S. spontaneum, a S.
robustum, two S. officinarum representatives and five hybrid cultivars. The five hybrid cultivars come from different genetic backgrounds, from breeding programs in
Argentina, Brazil and the United States. In addition to
investigating differential gene expression between the
two groups, we aimed to identify biological processes
that differed between the genotypes within each group.
Results
Data summary
Leaf samples were collected from field-grown plants
with six months of age, from twelve different genotypes
assigned to two groups contrasting in sucrose-associated
traits - soluble solids content, sucrose and purity - and
biomass-associated traits - fiber content and number of
stalks (Fig. 1 and Additional file 1 - Figure 1). These figures show a group with four S. spontaneum representatives - IN84–58, IN84–88, Krakatau and SES205A -, the
S. robustum genotype IJ76–318 and the hybrid US85–
1008. The second group was formed by genotypes that
have higher sucrose levels in culms: two S. officinarum
Correr et al. BMC Genomics
(2020) 21:673
Page 3 of 16
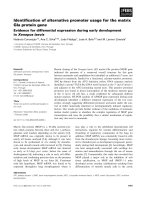
Fig. 1 Dendrogram of the twelve sugarcane genotypes based on phenotypic traits. We performed a hierarchical clustering of the genotypes
based on Euclidean distances calculated for all evaluated traits. Points at the bottom represent the gradient of the scaled phenotypic measures of
each accession, where larger green points represent higher phenotypic values. The measured phenotypic traits include: content of soluble solids
in the cane juice (°Brix); polarization or sucrose percentage in the juice (POL % Juice); percentage of sucrose in the total solids of the juice
(Purity); percentage of fiber in the bagasse (Fiber); and the number of stalks in each plot
genotypes - White Transparent and Criolla Rayada -, the
hybrid TUC71–7 and more modern hybrids - RB72454,
SP80–3280, and RB855156. For simplicity, we will refer
to the main difference between the two groups in terms
of biomass. Therefore, these genotypes were chosen to
include accessions of different Saccharum species to
form two groups contrasting in biomass content. Although cytogenetic information is limited for sugarcane
genotypes, we do expect differences in chromosome
numbers and ploidy level among them. Most hybrids,
with the exception of US85–1008, have a larger number
of S. officinarum chromosomes and a minor and variable
contribution of S. spontaneum, likely with a basic
chromosome number of x = 10 [22]. The basic chromosome number of S. officinarum is also x = 10, but different numbers have been verified in S. spontaneum [22].
Ploidy levels and interspecific hybridization have the potential to affect gene expression patterns, in addition to
mechanisms of transcriptional control and epigenetic
factors [23, 24]. Nevertheless, our study aimed to find
direct associations between transcript abundance and
phenotypic traits, without trying to identify the upstream
causes of differences in gene expression levels. Our analyses do not depend on prior knowledge about the ploidy
of each accession, but we note that variation in chromosome copy counts are possible causes for similarities or
differences between particular genotypes.
The mapping rate of sequenced libraries ranged from
80.52 to 85.37% (Table 1 in Additional file 3). To
characterize the variability in the expression profiles, we
initially assessed the distances between samples based on
gene expression levels, using the multidimensional scaling plot to identify clusters. We noted that clonal genotype replicates were close to each other, as expected
(Fig. 2). As was the case for phenotypic traits (Fig. 1 in
Additional file 1), the first dimension basically separated
the high and low biomass groups, and genotypes of the
former were farther from each other, revealing higher
gene expression variability within the high biomass
group. US85–1008 samples clustered between the two
groups, apparently reflecting the origin of this genotype
in a breeding program. Investigation of the low biomass
group (Fig. 2) showed that RB855156 was close to
TUC71–7, most likely because it was originated as a
Correr et al. BMC Genomics
(2020) 21:673
Page 4 of 16
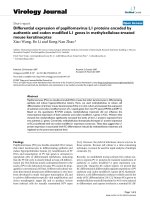
Fig. 2 Multidimensional scaling plot to assess dissimilarities between samples. Points in blue represent the high biomass genotypes, while the
ones within the low biomass group members are tagged in orange. Different shapes represent different genotypes within each group. Note that
three genotypes in each group are represented by three clonal replicates
hybrid between RB72454 and TUC71–7. In fact, the Brazilian hybrids are closely related, because RB72454 is the
offspring of CP53–76 (used as the maternal parent),
which is also the maternal grandfather of SP80–3280.
The second dimension separated the high biomass genotypes in three sets: i) SES205A at the top; ii) Krakatau,
IN84–88 and US85–1008 in the middle; and iii) IN84–
58 and IJ76–318. Curiously, in the latter group, an accession classified as S. robustum (IJ76–318) grouped
closely with a S. spontaneum genotype. Variability within
the low biomass group is clearly verified if a third dimension is added (Fig. 1 in Additional file 3), in which
the most extreme genotypes were RB72454 and SP80–
3280 - phenotypically close to each other (Figure 1 in
Additional file 1). This result indicates that distances
among the low biomass genotypes are smaller than
among the high biomass accessions.
We first tested for differences in gene expression levels
between the two biomass groups, taking the high biomass group as reference. This resulted in 10,903 downregulated and 10,171 upregulated genes in the low
biomass group. In this model, the dispersion estimate includes biological variation between all samples in both
groups. This resulted in a biological coefficient of variation (BCV) of 0.86. Although the test within the high
biomass group resulted in a BCV of 0.31, more genes
were deemed differentially expressed than comparing
the groups (Table 2 in Additional file 3). In accordance
to the similarity among genotypes, the test within the
low biomass group had a similar BCV (0.27) and the
lowest number of differentially expressed genes (DEGs)
among the three contrasts. Assessing the overlap between these lists of genes, the higher number of unique
DEGs occurred when testing for differences among the
high biomass genotypes (Figure 2 in Additional file 3),
which is consistent with the higher variability among
them.
Enrichment analysis was used to assess if functional categories are overrepresented among DEGs, giving evidence
of widespread changes in the transcriptional landscape of
biological pathways. Functional enrichment analysis with
DEGs from the comparison between biomass groups revealed changes in translation and DNA integration –
which is a parent term of transposon integration in the
Gene Ontology (GO) hierarchy (Figure 3 in Additional file
3). The tests comparing genotypes within the two groups
showed many enriched GO terms related to transposition,
defense-related and carbohydrate-related (Figs. 3 and 4).
Differential expression of transposition-associated genes
was more marked when contrasting the two biomass
groups and within the high biomass genotypes (Figure 4
in Additional file 3). Also, the high biomass genotypes
showed significant differences in the expression level of
genes related to cell division, replication and postreplication repair terms. On the other hand, in addition to
DEGs related to replication, transcription and kinases, the
Correr et al. BMC Genomics
(2020) 21:673
Page 5 of 16
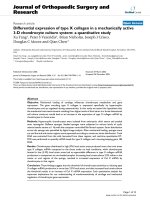
Fig. 3 Bar chart of the number of DEGs in each enriched functional class for the differences within the high biomass group. Bars show the
number of differentially expressed genes in each Gene Ontology term. Smaller p-values are shown by darker green colors. Terms were grouped
by the categories BP (Biological Process), CC (Cellular Component) and MF (Molecular Function)
Correr et al. BMC Genomics
(2020) 21:673
Page 6 of 16
Fig. 4 Bar chart of the number of DEGs in each enriched functional class for the differences within the low biomass group. Bars show the
number of differentially expressed genes in each Gene Ontology term. Smaller p-values are shown by darker green colors. Terms were grouped
by the categories BP (Biological Process), CC (Cellular Component) and MF (Molecular Function)
test within the low biomass group revealed differences in
O-methyltransferase activity (Figure 4 in Additional file 3).
The molecular function glutathione transferase activity
was enriched in both within-group contrasts (Figs. 3 and
4). We also found changes in genes coding for proteins involved in the response to salicylic acid in both tests.
A functional enrichment test performed with the common DEGs detected in the three contrasts corroborates
defense response and transposition, as well as gives
evidence of a possible genomic stress (Figure 5 in Additional file 3). Using the 7350 DEGs in the pairwise intersection of within-groups contrasts, enrichment analysis
revealed changes in the synthesis of cell wall (Figure 6 in
Additional file 3).
Co-expressed genes and metabolic pathways
We identified 16 modules with co-expressed genes, with
the number of genes in each module ranging from 514
Correr et al. BMC Genomics
(2020) 21:673
to 7814. Functional analyses among annotated coexpressed genes in each set revealed enriched GO terms
in eleven of these modules (Table 3 in Additional file 3).
We identified an overlap of translation- and
transcription-related terms predominantly in modules
one and seven, such as those involved in the assembly of
ribosomal subunits, protein processing, protein degradation and processing of RNAs (Table 3 and Figure 7 in
Additional file 3).
Cellular components of chloroplasts were found in five
modules of the network: three, seven, eight, eleven and
sixteen (Table 3 in Additional file 3). Module 16 was
mostly formed by genes related to chloroplast, photosystem and photosynthesis (Figure 7 in Additional file
3). This was the only module to show enrichment of responses to hormones (abscisic acid, cytokinin, ethylene
and gibberellin) and these DEGs were mainly repressed
in high biomass genotypes (Figure 8 in Additional file 3).
We noticed that many genes in module 16 showed high
absolute log fold change (LFC) values in all three contrasts, but to a lesser extent in the comparison between
S. officinarum and the low biomass hybrids (Figure 9 in
Additional file 3). This is explained by the expression
profile of the genes present in this module, for which
the expression level in the low biomass group was higher
and similar among the samples (Figure 10 in Additional
file 3).
The results of the comparison between the main
groups identified up and downregulated DEGs in all
metabolic processes provided by the MAPMAN4 functional BINs (Figure 11 in Additional file 3). Many genes
involved in photophosphorylation were downregulated
in the low biomass group, annotated as components of
the photosystem II (Psb) proteins, photosystem I (Psa)
and cytochrome (Pet) subunits and photosystem I assembly (YCF3 and YCF4) (Figure 12 in Additional file 3).
Other genes of the photosynthesis light reactions were
differentially expressed within the two groups, in both
cases consistently upregulated in the genotypes with the
lowest fiber content (Figure 13 and Figure 14 in Additional file 3). However, genes coding for proteins acting
on C4/CAM photosynthesis were downregulated in
White Transparent (Figure 14 in Additional file 3). This
is in accordance with our co-expression analysis, where
many photosynthesis genes with high LFC were present
in low biomass genotypes and in US85–1008, but were
non-DE when White Transparent was compared to low
biomass hybrids (Figure 9 in Additional file 3). DEGs
coding for phosphoenolpyruvate carboxylase (PEPC)
were repressed in low biomass genotypes, being
expressed at similar levels in the high biomass accessions
(Figure 15 in Additional file 3).
Compared to the high biomass group, low biomass genotypes showed lower expression of genes related to
Page 7 of 16
secondary metabolism, such as those annotated to the
monolignol synthesis (Figure 16 in Additional file 3).
However, the MAPMAN4 lignin pathway revealed upregulation of certain enzymes in the low biomass genotypes: phenylalanine ammonia lyase (PAL), caffeic acid
O-methyltransferase (COMT), 4-coumarate: CoA ligase
(4CL), cinnamyl-alcohol dehydrogenase (CAD) and a
β-glucosidase (Figure 17 in Additional file 3). US85–1008
and the wild S. spontaneum genotypes were similar in the
expression of genes coding for enzymes of the lignin
metabolism, with significant differences for five genes - a
4CL, a β-glucosidase, a Caffeoyl-CoA O-methyltransferase
and two cinnamoyl-Coa reductases (CCR) (Figure 18 in
Additional file 3).
We observed that many genes coding for enzymes acting on xylan were upregulated in high biomass genotypes, even in the within-group comparisons (Fig. 5c and
Additional file 3 - Figure 19). Regarding cell modification and degradation, a 1,6-alpha-xylosidase was highly
expressed in the low biomass group (Figure 19-B in
Additional file 3). Genes annotated with xylosyltransferase activity were co-expressed with those involved with
the Golgi apparatus, membrane components and endocytosis, being more highly expressed in high biomass genotypes (Table 3 - Module 10 and Figure 10 in
Additional file 3). This is expected given that the Golgi
apparatus synthesizes most polysaccharides of the cell
wall, where transferases catalyze the synthesis of the
xyloglucan backbone and side branches [25]. We also
found significant differences in the expression levels of
genes associated with cell wall flexibility. In particular,
DEGs coding for expansins of the β subfamily were more
highly expressed in S. spontaneum and S. robustum (Figure 20 in Additional file 3).
The biomass groups revealed different expression
levels of genes coding for enzymes of sucrose metabolism. Sucrose-phosphate synthase (SPS) and sucrose-phosphate phosphatase (SPP) genes were upregulated in low
biomass genotypes (Fig. 5a). Curiously, genes coding for
sucrose synthase (SuSy) - an enzyme family mainly involved with sucrose degradation - were upregulated in
the low biomass group and in US85–1008 (Fig. 5b and
Additional file 3 - Figure 21). The comparison between
groups also showed different expression levels of genes
coding for sucrose transport proteins SUT1 and SUT4.
Although SUT4 was strongly upregulated in the low biomass group (Figure 22 in Additional file 3), SUT1 was
highly expressed in the high biomass genotypes (Fig. 5d).
We found different expression profiles of genes coding
for sugar transporters of the same family. Genes coding
for SWEETs (Sugars will eventually be exported transporters) were downregulated in the low biomass group,
while within the groups these DEGs showed a genotypespecific expression (Figure 22-B in Additional file 3).