Báo cáo khoa học: "You Can’t Beat Frequency (Unless You Use Linguistic Knowledge) – A Qualitative Evaluation of Association Measures for Collocation and Term Extraction" pot
Bạn đang xem bản rút gọn của tài liệu. Xem và tải ngay bản đầy đủ của tài liệu tại đây (3.54 MB, 8 trang )
Proceedings of the 21st International Conference on Computational Linguistics and 44th Annual Meeting of the ACL, pages 785–792,
Sydney, July 2006.
c
2006 Association for Computational Linguistics
You Can’t Beat Frequency (Unless You Use Linguistic Knowledge) –
A Qualitative Evaluation of Association Measures for
Collocation and Term Extraction
Joachim Wermter Udo Hahn
Jena University Language & Information Engineering (JULIE) Lab
D-07743 Jena, Germany
{wermter|hahn}@coling-uni-jena.de
Abstract
In the past years, a number of lexical
association measures have been studied
to help extract new scientific terminol-
ogy or general-language collocations. The
implicit assumption of this research was
that newly designed term measures involv-
ing more sophisticated statistical criteria
would outperform simple counts of co-
occurrence frequencies. We here explic-
itly test this assumption. By way of four
qualitative criteria, we show that purely
statistics-based measures reveal virtually
no difference compared with frequency
of occurrence counts, while linguistically
more informed metrics do reveal such a
marked difference.
1 Introduction
Research on domain-specific automatic term
recognition (ATR) and on general-language collo-
cation extraction (CE) has gone mostly separate
ways in the last decade although their underlying
procedures and goals turn out to be rather simi-
lar. In both cases, linguistic filters (POS taggers,
phrase chunkers, (shallow) parsers) initially col-
lect candidates from large text corpora and then
frequency- or statistics-based evidence or associa-
tion measures yield scores indicating to what de-
gree a candidate qualifies as a term or a colloca-
tion. While term mining and collocation mining,
as a whole, involve almost the same analytical pro-
cessing steps, such as orthographic and morpho-
logical normalization, normalization of term or
collocation variation etc., it is exactly the measure
which grades termhood or collocativity of a can-
didate on which alternative approaches diverge.
Still, the output of such mining algorithms look
similar. It is typically constituted by a ranked list
on which, ideally, the true terms or collocations
are placed in the top portion of the list, while the
non-terms / non-collocations occur in its bottom
portion.
While there have been lots of approaches to
come up with a fully adequate ATR/CE metric
(cf. Section 2), we have made observations in our
experiments that seem to indicate that simplicity
rules, i.e., frequency of occurrence is the dominat-
ing factor for the ranking in the result lists even
when much smarter statistical machinery is em-
ployed. In this paper, we will discuss data which
reveals that purely statistics-based measures ex-
hibit virtually no difference compared with fre-
quency of occurrence counts, while linguistically
more informed measures do reveal such a marked
difference – for the problem of term and colloca-
tion mining at least.
2 Related Work
Although there has been a fair amount of work
employing linguistically sophisticated analysis of
candidate items (e.g., on CE by Lin (1998) and
Lin (1999) as well as on ATR by Daille (1996),
Jacquemin (1999), and Jacquemin (2001)), these
approaches are limited by the difficulty to port
grammatical specifications to other domains (in
the case of ATR) or by the error-proneness of
full general-language parsers (in the case of CE).
Therefore, most recent approaches in both areas
have backed off to more shallow linguistic filter-
ing techniques, such as POS tagging and phrase
chunking (e.g., Frantzi et al. (2000), Krenn and
Evert (2001), Nenadi´c et al. (2004), Wermter and
Hahn (2005)).
785
After linguistic filtering, various measures
are employed in the literature for grading the
termhood / collocativity of collected candidates.
Among the most widespread ones, both for ATR
and CE, are statistical and information-theoretic
measures, such as t-test, log-likelihood, entropy,
and mutual information. Their prominence is
also reflected by the fact that a whole chapter of
a widely used textbook on statistical NLP (viz.
Chapter 5 (Collocations) in Manning and Sch¨utze
(1999)) is devoted to them. In addition, the C-
value (Frantzi et al., 2000) – basically a frequency-
based approach – has been another widely used
measure for multi-word ATR. Recently, more lin-
guistically informed algorithms have been intro-
duced both for CE (Wermter and Hahn, 2004) and
for ATR (Wermter and Hahn, 2005), which have
been shown to outperform several of the statistics-
only metrics.
3 Methods and Experiments
3.1 Qualitative Criteria
Because various metrics assign a score to the can-
didates indicating as to what degree they qualify
as a collocation or term (or not), these candidates
should ideally be ranked in such a way that the
following two conditions are met:
• true collocations or terms (i.e., the true pos-
itives) are ranked in the upper portion of the
output list.
• non-collocations or non-terms (i.e., the true
negatives) are ranked in the lower part of the
output list.
1
While a trivial solution to the problem might
be to simply count the number of occurrences of
candidates in the data, employing more sophis-
ticated statistics-based / information-theoretic or
even linguistically-motivated algorithms for grad-
ing term and collocation candidates is guided by
the assumption that this additional level of sophis-
tication yields more adequate rankings relative to
these two conditions.
Several studies (e.g., Evert and Krenn (2001),
Krenn and Evert (2001), Frantzi et al. (2000),
Wermter and Hahn (2004)), however, have al-
ready observed that ranking the candidates merely
by their frequency of occurrence fares quite well
1
Obviously, this goal is similar to ranking documents ac-
cording to their relevance for information retrieval.
compared with various more sophisticated as-
sociation measures (AMs such as t-test, log-
likelihood, etc.). In particular, the precision/recall
value comparison between the various AMs ex-
hibits a rather inconclusive picture in Evert and
Krenn (2001) and Krenn and Evert (2001) as to
whether sophisticated statistical AMs are actually
more viable than frequency counting.
Commonly used statistical significance testing
(e.g., the McNemar or the Wilcoxon sign rank
tests; see (Sachs, 1984)) does not seem to provide
an appropriate evaluation ground either. Although
Evert and Krenn (2001) and Wermter and Hahn
(2004) provide significance testing of some AMs
with respect to mere frequency counting for collo-
cation extraction, they do not differentiate whether
this is due to differences in the ranking of true pos-
itives or true negatives or a combination thereof.
2
As for studies on ATR (e.g., Wermter and Hahn
(2005) or Nenadi´c et al. (2004)), no statistical test-
ing of the term extraction algorithms to mere fre-
quency counting was performed.
But after all, these kinds of commonly used sta-
tistical significance tests may not provide the right
machinery in the first place. By design, they are
rather limited (or focused) in their scope in that
they just check whether a null hypothesis can be
rejected or not. In such a sense, they do not pro-
vide a way to determine, e.g., to which degree of
magnitude some differences pertain and thus do
not offer the facilities to devise qualitative criteria
to test whether an AM is superior to co-occurrence
frequency counting.
The purpose of this study is therefore to postu-
late a set of criteria for the qualitative testing of
differences among the various CE and ATR met-
rics. We do this by taking up the two conditions
above which state that a good CE or ATR algo-
rithm would rank most of the true positives in a
candidate set in the upper portion and most of
the true negatives in the lower portion of the out-
put. Thus, compared to co-occurrence frequency
counting, a superior CE/ATR algorithm should
achieve the following four objectives:
2
In particular Evert and Krenn (2001) use the chi-square
test which assumes independent samples and is thus not re-
ally suitable for testing the significance of differences of two
or more measures which are typically run on the same set
of candidates (i.e., a dependent sample). Wermter and Hahn
(2004) use the McNemar test for dependent samples, which
only examines the differences in which two metrics do not
coincide.
786
1. keep the true positives in the upper portion
2. keep the true negatives in the lower portion
3. demote true negatives from the upper portion
4. promote true positives from the lower por-
tion.
We take these to be four qualitative criteria by
which the merit of a certain AM against mere oc-
currence frequency counting can be determined.
3.2 Data Sets
For collocation extraction (CE), we used the data
set provided by Wermter and Hahn (2004) which
consists of a 114-million-word German newspa-
per corpus. After shallow syntactic analysis, the
authors extracted Preposition-Noun-Verb (PNV)
combinations occurring at least ten times and had
them classified by human judges as to whether
they constituted a valid collocation or not, re-
sulting in 8644 PNV-combinations with 13.7%
true positives. As for domain-specific automatic
term recognition (ATR), we used a biomedical
term candidate set put forth by Wermter and Hahn
(2005), who, after shallow syntactic analysis, ex-
tracted 31,017 trigram term candidates occurring
at least eight times out of a 104-million-word
MEDLINE corpus. Checking these term candi-
dates against the 2004 edition UMLS Metathe-
saurus (UMLS, 2004)
3
resulted in 11.6% true pos-
itives. This information is summarized in Table 1.
Collocations Terms
domain newspaper biomedicine
language German English
linguistic type PP-Verb noun phrases
combinations (trigrams)
corpus size 114 million 104 million
cutoff 10 8
# candidates 8,644 31,017
# true positives 1,180 (13.7%) 3,590 (11.6%)
# true negatives 7,464 (86.3%) 27,427 (88.4%)
Table 1: Data sets for Collocation Extraction (CE) and Au-
tomatic Term Dioscovery (ATR)
3
The UMLS Metathesaurus is an extensive and carefully
curated terminological resource for the biomedical domain.
3.3 The Association Measures
We examined both standard statistics-based and
more recent linguistically rooted association mea-
sures against mere frequency of occurrence count-
ing (henceforth referred to as Frequency). As the
standard statistical AM, we selected the t-test (see
also Manning and Sch¨utze (1999) for a descrip-
tion on its use in CE and ATR) because it has
been shown to be the best-performing statistics-
only measure for CE (cf. Evert and Krenn (2001)
and Krenn and Evert (2001)) and also for ATR (see
Wermter and Hahn (2005)).
Concerning more recent linguistically grounded
AMs, we looked at limited syntagmatic modifia-
bility (LSM) for CE (Wermter and Hahn, 2004)
and limited paradigmatic modifiability (LPM) for
ATR (Wermter and Hahn, 2005). LSM exploits
the well-known linguistic property that colloca-
tions are much less modifiable with additional lex-
ical material (supplements) than non-collocations.
For each collocation candidate, LSM determines
the lexical supplement with the highest probabil-
ity, which results in a higher collocativity score for
those candidates with a particularly characteristic
lexical supplement. LPM assumes that domain-
specific terms are linguistically more fixed and
show less distributional variation than common
noun phrases. Taking n-gram term candidates, it
determines the likelihood of precluding the ap-
pearance of alternative tokens in various token slot
combinations, which results in higher scores for
more constrained candidates. All measures assign
a score to the candidates and thus produce a ranked
output list.
3.4 Experimental Setup
In order to determine any potential merit of the
above measures, we use the four criteria described
in Section 3.1 and qualitatively compare the differ-
ent rankings given to true positives and true neg-
atives by an AM and by Frequency. For this pur-
pose, we chose the middle rank as a mark to di-
vide a ranked output list into an upper portion and
a lower portion. Then we looked at the true pos-
itives (TPs) and true negatives (TNs) assigned to
these portions by Frequency and quantified, ac-
cording to the criteria postulated in Section 3.1,
to what degree the other AMs changed these rank-
ings (or not). In order to better quantify the de-
grees of movement, we partitioned both the upper
and the lower portions into three further subpor-
tions.
787
Association upper portion (ranks 1 - 4322) lower portion (ranks 4323 - 8644)
Measure 0% - 16.7% 16.7% - 33.3% 33.3% - 50% 50% - 66.7% 66.7% - 83.3% 83.3% - 100%
Criterion 1 Freq 545 (60.2%) 216 (23.9%) 144 (15.9%) 0 0 0
(905 TPs) t-test 540 (59.7%) 198 (21.9%) 115 (12.7%) 9 (1.0%) 12 (1.3%) 12 (1.3%)
LSM 606 (67.0%) 237 (26.2%) 35 (3.9%) 10 (1.1%) 12 (1.3%) 5 (0.6%)
Criterion 2 Freq 0 0 0 1361 (33.6%) 1357 (33.5%) 1329 (32.8%)
(4047 TNs) t-test 0 34 (0.8%) 613 (15.2%) 1121 (27.7%) 1100 (27.2%) 1179 (29.1%)
LSM 118 (2.9%) 506 (12.5%) 726 (17.9%) 808 (20.0%) 800 (19.8%) 1089 (26.9%)
Criterion 3 Freq 896 (26.2%) 1225 (35.9%) 1296 (37.9%) 0 0 0
(3417 TNs) t-test 901 (26.4%) 1243 (36.4%) 932 (27.3%) 95 (2.8%) 47 (1.4%) 199 (5.8%)
LSM 835 (24.4%) 1150 (33.7%) 342 (10.0%) 218 (6.4%) 378 (11.1%) 494 (14.5%)
Criterion 4 Freq 0 0 0 113 (41.1%) 85 (30.9%) 77 (28.0%)
(275 TPs) t-test 0 0 31 (11.3%) 88 (32.6%) 59 (21.5%) 95 (34.5%)
LSM 0 10 (3.6%) 144 (52.4%) 85 (30.9%) 27 (9.8%) 9 (3.3%)
Table 2: Results on the four qualitative criteria for Collocation Extraction (CE)
Association upper portion (ranks 1 - 15508) lower portion (ranks 15509 - 31017)
Measure 0% - 16.7% 16.7% - 33.3% 33.3% - 50% 50% - 66.7% 66.7% - 83.3% 83.3% - 100%
Criterion 1 Freq 1252 (50.7%) 702 (28.4%) 515 (20.9%) 0 0 0
(2469 TPs) t-test 1283 (52.0%) 709 (28.7%) 446 (18.1%) 13 (0.5%) 2 (0.1%) 16 (0.6%)
LPM 1346 (54.5%) 513 (20.8%) 301 (12.2%) 163 (6.6%) 95 (3.8%) 51 (2.1%)
Criterion 2 Freq 0 0 0 4732 (32.9%) 4822 (33.5%) 4833 (33.6%))
(14387 TNs) t-test 0 0 580 (4.0%) 4407 (30.6%) 4743 (33.0%) 4657 (32.4%)
LPM 1009 (7.0%) 1698 (11.8%) 2190 (15.2%) 2628 (18.3%) 3029 (21.1%) 3834 (26.6%)
Criterion 3 Freq 3917 (30.0%) 4467 (34.3%) 4656 (35.7%) 0 0 0
(13040 TNs) t-test 3885 (29.8%) 4460 (34.2%) 4048 (31.0%) 315 (2.4%) 76 (0.6%) 256 (2.0%)
LPM 2545 (19.5%) 2712 (20.8%) 2492 (19.1%) 2200 (16.9%) 1908 (14.6%) 1182 (9.1%)
Criterion 4 Freq 0 0 0 438 (39.1%) 347 (31.0%) 336 (30.0%)
(1121 TPs) t-test 0 0 97 (8.7%) 436 (38.9%) 348 (31.0%) 240 (21.4%)
LPM 268 (23.9%) 246 (21.9%) 188 (16.8%) 180 (16.1%) 137 (12.2%) 102 (9.1%)
Table 3: Results on the four qualitative criteria for Automatic Term Discovery (ATR)
4 Results and Discussion
The first two criteria examine how conservative an
association measure is with respect to Frequency,
i.e., a superior AM at least should keep the status-
quo (or even improve it) by keeping the true pos-
itives in the upper portion and the true negatives
in the lower one. In meeting criteria 1 for CE,
Table 2 shows that t-test behaves very similar to
Frequency in keeping roughly the same amount of
TPs in each of the upper three subportions. LSM
even promotes its TPs from the third into the first
two upper subportion (i.e., by a 7- and 2-point in-
crease in the first and in the second subportion as
well as a 12-point decrease in the third subportion,
compared to Frequency).
With respect to the same criterion for ATR (see
Table 3), Frequency and t-test again show quite
similar distributions of TPs in the top three sub-
portions. LPM, on the other hand, demonstrates a
modest increase (by 4 points) in the top upper sub-
portion, but decreases in the second and third one
so that a small fraction of TPs gets demoted to the
lower three subportions (6.6%, 3.8% and 2.1%).
Regarding criterion 2 for CE (see Table 2), t-
test’s share of TNs in the lower three subportions
is slightly less than that of Frequency, leading
to a 15-point increase in the adjacent third up-
per subportion. This local ”spilling over” to the
upper portion is comparatively small considering
the change that occurs with respect to LSM. Here,
TNs appear in the second (12.5%) and the third
(17.9%) upper subportions. For ATR, t-test once
more shows a very similar distribution compared
to Frequency, whereas LPM again promotes some
of its lower TNs into the upper subportions (7%,
11.8% and 15.2%).
Criteria 3 and 4 examine the kinds of re-
rankings (i.e., demoting upper portion TNs and
promoting lower portion TPs) which an AM needs
to perform in order to qualify as being superior to
Frequency. These criteria look at how well an AM
is able to undo the unfavorable ranking of TPs and
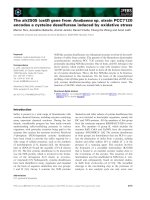
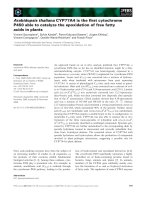
TNs by Frequency. As for criterion 3 (the demo-
tion of TNs from the upper portion) in CE, Table 2
shows that t-test is only marginally able to undo
the unfavorable rankings in its third upper sub-
portion (11 percentage points less of TNs). This
causes a small fraction of TNs getting demoted to
788
Rank in Frequency
Rank in LSM
100% 83.3% 66.7% 50% 33.3% 16.7 0%
0% 16.7% 33.3% 50%
Figure 1: Collocations: True negatives moved from upper
to lower portion (LSM rank compared to Frequency rank)
Rank in Frequency
Rank in t−test
100% 83.3% 66.7% 50% 33.3% 16.7 0%
0% 16.7% 33.3% 50%
Figure 2: Collocations: True negatives moved from upper
to lower portion (t-test rank compared to Frequency rank)
the lower three subportions (viz. 2.8%, 1.4%, and
5.8%).
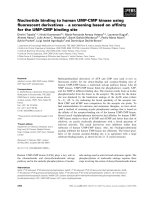
A view from another angle on this rather slight
re-ranking is offered by the scatterplot in Figure
2, in which the rankings of the upper portion TNs
Rank in Frequency
Rank in LPM
0% 16.7% 33.3% 50%
100% 83.3% 66.7% 50% 33.3% 16.7 0%
Figure 3: Terms: True negatives moved from upper to
lower portion (LPM rank compared to Frequency rank)
Rank in Frequency
Rank in t−test
100% 83.3% 66.7% 50% 33.3% 16.7 0%
0% 16.7% 33.3% 50%
Figure 4: Terms: True negatives moved from upper to
lower portion (t-test rank compared to Frequency rank)
of Frequency are plotted against their ranking in
t-test. Here it can be seen that, in terms of the rank
subportions considered, the t-test TNs are concen-
trated along the same line as the Frequency TNs,
with only a few being able to break this line and
789
Rank in Frequency
Rank in LSM
100% 83.3% 66.7% 50% 33.3% 16.7 0%
50% 66.7% 83.3% 100%
Figure 5: Collocations: True positives moved from lower
to upper portion (LSM rank compared to Frequency rank)
Rank in Frequency
Rank in t−test
100% 83.3% 66.7% 50% 33.3% 16.7 0%
50% 66.7% 83.3% 100%
Figure 6: Collocations: True positives moved from lower
to upper portion (t-test rank compared to Frequency rank)
get demoted to a lower subportion.
A strikingly similar picture holds for this cri-
terion in ATR: as can be witnessed from Figure
4, the vast majority of upper portion t-test TNs is
stuck on the same line as in Frequency. The sim-
Rank in Frequency
Rank in LPM
50% 66.7% 83.3% 100%
100% 83.3% 66.7% 50% 33.3% 16.7 0%
Figure 7: Terms: True positives moved from lower to upper
portion (LPM rank compared to Frequency rank)
Rank in Frequency
Rank in t−test
100% 83.3% 66.7% 50% 33.3% 16.7 0%
50% 66.7% 83.3% 100%
Figure 8: Terms: True positives moved from lower to upper
portion (t-test rank compared to Frequency rank)
ilarity of t-test in both CE and ATR is even more
remarkable given the fact in the actual number of
upper portion TNs is more than four times higher
in ATR (13040) than in CE (3076). A look at the
actual figures in Table 3 indicates that t-test is even
790
less able to deviate from Frequency’s TN distribu-
tion (i.e., the third upper subportion is only occu-
pied by 4.7 points less TNs, with the other two
subportions essentially remaining the same as in
Frequency).
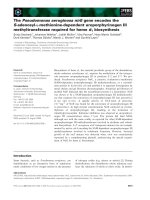
The two linguistically rooted measures, LSM
for CE and LPM for ATR, offer quite a different
picture regarding this criterion. With LSM, almost
one third (32%) of the upper portion TNs get de-
moted to the three lower portions (see Table 2);
with LPM, this proportion even amounts to 40.6%
(see Table 3). The scatterplots in Figure 1 and
Figure 3 visualize this from another perspective:
in particular, LPM completely breaks the original
Frequency ranking pattern and scatters the upper
portion TNs in almost all possible directions, with
the vast majority of them thus getting demoted to
a lower rank than in Frequency. Although LSM
stays more in line, still substantially more upper
portion TNs get demoted than with t-test.
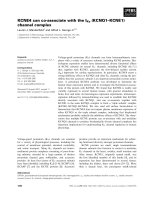
With regard to Criterion 4 (the promotion of
TPs from the lower portion) in CE, t-test manages
to promote 11.3% of its lower portion TPs to the
adjacent third upper subportion, but at the same
time demotes more TPs to the third lower subpor-
tion (34.5% compared to 28% in Frequency; see
Table 2). Figure 6 thus shows the t-test TPs to
be a bit more dispersed in the lower portion. For
ATR, the t-test distribution of TPs differs even less
from Frequency. Table 3 reveals that only 8.7% of
the lower portion TPs get promoted to the adjacent
third upper portion. The staggered groupinlpr g of
lower portion t-test TPs (visualized in the respec-
tive scatterplot in Figure 8) actually indicates that
there are certain plateaus beyond which the TPs
cannot get promoted.
The two non-standard measures, LSM and
LPM, once more present a very different picture.
Regarding LSM, 56% of all lower portion TPs get
promoted to the upper three subportions. The ma-
jority of these (52.4%) gets placed the third upper
subportion. This can also be seen in the respective
scatterplot in Figure 5 which shows a marked con-
centration of lower portion TPs in the third upper
subportion. With respect to LPM, even 62.6% of
all lower portion TPs make it to the upper portions
– with the majority (23.9%) even getting promoted
to the first upper subportion. The respective scat-
terplot in Figure 7 additionally shows that this up-
ward movement of TPs, like the downward move-
ment of TNs in Figure 3, is quite dispersed.
5 Conclusions
For lexical processing, the automatic identifica-
tion of terms and collocations constitutes a re-
search theme that has been dealt with by employ-
ing increasingly complex probabilistic criteria (t-
test, mutual information, log-likelihood etc.). This
trend is also reflected by their prominent status in
standard textbooks on statistical NLP. The implicit
justification in using these statistics-only metrics
was that they would markedly outperform fre-
quency of co-occurrence counting. We devised
four qualitative criteria for explicitly testing this
assumption. Using the best performing standard
association measure (t-test) as a pars pro toto, our
study indicates that the statistical sophistication
does not pay off when compared with simple fre-
quency of co-occurrence counting.
This pattern changes, however, when proba-
bilistic measures incorporate additional linguistic
knowledge about the distributional properties of
terms and the modifiability properties of colloca-
tions. Our results show that these augmented met-
rics reveal a marked difference compared to fre-
quency of occurrence counts – to a larger degree
with respect to automatic term recognition, to a
slightly lesser degree for collocation extraction.
References
B´eatrice Daille. 1996. Study and implementation of
combined techniques for automatic extraction of ter-
minology. In Judith L. Klavans and Philip Resnik,
editors, The Balancing Act: Combining Statistical
and Symbolic Approaches to Language, pages 49–
66. Cambridge, MA: MIT Press.
Stefan Evert and Brigitte Krenn. 2001. Methods for
the qualitative evaluation of lexical association mea-
sures. In ACL’01/EACL’01 – Proceedings of the
39th Annual Meeting of the Association for Com-
putational Linguistics and the 10th Conference of
the European Chapter of the Association for Com-
putational Linguistics, pages 188–195. Toulouse,
France, July 9-11, 2001. San Francisco, CA: Mor-
gan Kaufmann.
Katerina T. Frantzi, Sophia Ananiadou, and Hideki
Mima. 2000. Automatic recognition of multi-word
terms: The C-value/NC-value method. Interna-
tional Journal on Digital Libraries, 3(2):115–130.
Christian Jacquemin. 1999. Syntagmatic and paradig-
matic representations of term variation. In Proceed-
ings of the 37rd Annual Meeting of the Association
for Computational Linguistics, pages 341–348. Col-
lege Park, MD, USA, 20-26 June 1999. San Fran-
cisco, CA: Morgan Kaufmann.
791
Christian Jacquemin. 2001. Spotting and Discovering
Terms through NLP. Mass.: MIT Press.
Brigitte Krenn and Stefan Evert. 2001. Can we do bet-
ter than frequency? A case study on extracting pp-
verb collocations. In Proceedings of the ACL Work-
shop on Collocations. Toulouse, France.
Dekang Lin. 1998. Automatic retrieval and cluster-
ing of similar words. In COLING/ACL’98 – Pro-
ceedings of the 36th Annual Meeting of the Asso-
ciation for Computational Linguistics & 17th In-
ternational Conference on Computational Linguis-
tics, volume 2, pages 768–774. Montr´eal, Quebec,
Canada, August 10-14, 1998. San Francisco, CA:
Morgan Kaufmann.
Dekang Lin. 1999. Automatic identification of non-
compositional phrases. In Proceedings of the 37th
Annual Meeting of the Association for Computa-
tional Linguistics, pages 317–324. College Park,
MD, USA, 20-26 June 1999. San Francisco, CA:
Morgan Kaufmann.
Christopher D. Manning and Hinrich Sch¨utze. 1999.
Foundations of Statistical Natural Language Pro-
cessing. Cambridge, MA; London, U.K.: Bradford
Book & MIT Press.
Goran Nenadi´c, Sophia Ananiadou, and John Mc-
Naught. 2004. Enhancing automatic term recog-
nition through recognition of variation. In COL-
ING Geneva 2004 – Proceedings of the 20th Inter-
national Conference on Computational Linguistics,
pages 604–610. Geneva, Switzerland, August 23-27,
2004. Association for Computational Linguistics.
Lothar Sachs. 1984. Applied Statistics: A Handbook
of Techniques. New York: Springer, 2nd edition.
UMLS. 2004. Unified Medical Language System.
Bethesda, MD: National Library of Medicine.
Joachim Wermter and Udo Hahn. 2004. Collocation
extraction based on modifiability statistics. In COL-
ING Geneva 2004 – Proceedings of the 20th Inter-
national Conference on Computational Linguistics,
volume 2, pages 980–986. Geneva, Switzerland, Au-
gust 23-27, 2004. Association for Computational
Linguistics.
Joachim Wermter and Udo Hahn. 2005. Paradig-
matic modifiability statistics for the extraction of of
complex multi-word terms. In HLT-EMNLP’05 –
Proceedings of the 5th Human Language Technol-
ogy Conference and 2005 Conference on Empiri-
cal Methods in Natural Language Processing, pages
843–850. Vancouver, Canada, October 6-8, 2005.
Association for Computational Linguistics.
792