Solid Waste Management and Greenhouse Gases A Life-Cycle Assessment of Emissions and Sinks potx
Bạn đang xem bản rút gọn của tài liệu. Xem và tải ngay bản đầy đủ của tài liệu tại đây (8.02 MB, 170 trang )
Solid Waste
Management
and
Greenhouse
Gases
A Life-Cycle Assessment
of Emissions and Sinks
SOLID WASTE MANAGEMENT AND GREENHOUSE GASES
A Life-Cycle Assessment of Emissions and Sinks
3
rd
EDITION
September 2006
This page intentionally left blank.
TABLE OF CONTENTS
Executive Summary: Background and Findings ES-1
ES.1 GHGs and Climate Change ES-1
ES.2 Climate Change Initiatives in the United States ES-2
ES.3 Municipal Solid Waste and GHG Emissions ES-4
ES.4 Genesis and Applications of the Report ES-5
ES.5 The Impact of Municipal Solid Waste on GHG Emissions ES-6
ES.6 Results of the Analysis ES-12
ES.7 Other Life-Cycle GHG Analyses and Tools ES-17
ES.8 Limitations of the Analysis ES-19
1. Life-Cycle Methodology 1
1.1 The Overall Framework: a Streamlined Life-Cycle Inventory 2
1.2 MSW Materials Considered in the Streamlined Life-Cycle Inventory 2
1.3 Key Inputs for the Streamlined Life-Cycle Inventory 5
1.4 Summary of the Life-Cycle Stages 8
1.5 Estimating and Comparing Net GHG Emissions 14
2. Raw Materials Acquisition and Manufacturing 17
2.1 GHG Emissions from Energy Use in Raw Materials Acquisition and
Manufacturing 17
2.2 Nonenergy GHG Emissions from Manufacturing and Raw Materials Acquisition 21
2.3 Results 21
2.4 Limitations 21
3. Source Reduction and Recycling 31
3.1 GHG Implications of Source Reduction 31
3.2 GHG Implications of Recycling 32
3.3 Open Loop Recycling 36
3.4 Source Reduction Through Material Substitution 38
3.5 Forest Carbon Sequestration 38
3.6 Limitations 45
4. Composting 49
4.1 Potential GHG Emissions 49
4.2 Potential Carbon Storage 50
4.3 Net GHG Emissions From Composting 60
4.4 Limitations 61
5. Combustion 65
5.1 Methodology 67
5.2 Results 76
5.3 Limitations 76
6. Landfilling 79
6.1 CH
4
Generation and Carbon Storage for Organic Materials 80
6.2 Fates of Landfill CH
4
86
6.3 Utility CO
2
Emissions Avoided 88
6.4 Net GHG Emissions from Landfilling 88
6.5 Limitations 90
7. Energy Impacts 97
7.1 Methodolgy for Developing Energy Factors 97
7.2 Energy Implications for Waste Management Options 98
7.3 Applying Energy Factors 99
7.4 Relating Energy Savings to GHG Benefits 100
8. Energy and Emission Benefits 107
8.1 Net GHG Emissions for Each Waste Management Option 107
8.2 Applying GHG Emission Factors 109
8.3 Tools and Other Life-Cycle GHG Analyses 112
8.4 Opportunities for GHG Reductions 114
Appendix A. Raw Materials Extraction Reference Point 125
Appendix B. Carbon Dioxide Equivalent Emission Factors 127
Appendix C. Roadmap from the Second Edition 135
TABLE OF EXHIBITS
Exhibit ES-1 Net GHG Emissions from Source Reduction and MSW Management Options ES-8
Exhibit ES-2 Components of Net Emissions for Various MSW Management Strategies ES-10
Exhibit ES-3 Greenhouse Gas Sources and Sinks Associated with the Material Life Cycle ES-11
Exhibit ES-4 Net GHG Emissions from Source Reduction and MSW Management Options ES-14
Exhibit ES-5 GHG Emissions of MSW Management Options Compared to Landfilling ES-15
Exhibit 1-1 Materials Analyzed and Energy-related Data Sources 4
Exhibit 1-2 Greenhouse Gas Sources and Sinks Associated with the Material Life Cycle 9
Exhibit 1-3 Components of Net Emissions for Various MSW Management Strategies 10
Exhibit 2-1 Carbon Coefficients For Selected Fuels (Per Million Btu) 23
Exhibit 2-2 GHG Emissions from the Manufacture of Selected Materials 24
Exhibit 2-3 Process GHG Emissions Per Ton of Product Manufactured from Virgin Inputs 26
Exhibit 2-4 Transportation GHG Emissions Per Ton of Product Manufactured from Virgin Inputs 27
Exhibit 2-5 Process GHG Emissions Per Ton of Product Manufactured from Recycled Inputs 28
Exhibit 2-6 Transportation GHG Emissions Per Ton of Product Manufactured from Recycled
Inputs 29
Exhibit 2-7 Retail Transport Energy and Emissions 30
Exhibit 3-1 GHG Emissions for Source Reduction 34
Exhibit 3-2 Composition of Mixed Paper Categories 35
Exhibit 3-3 Loss Rates For Recovered Materials 36
Exhibit 3-4 Relationship Between Paper Recovery and Pulpwood Harvest 40
Exhibit 3-5 Increased Forest Carbon Storage per Unit of Reduced Pulpwood Harvest 41
Exhibit 3-6 Change, with respect to baseline, in carbon stocks for FORCARB II pools 42
Exhibit 3-7 Forest Carbon Storage from Recycling and Source Reduction 43
Exhibit 3-8 GHG Emissions for Recycling 46
Exhibit 4-1 Soil Carbon Storage Colorado and Iowa sites; 10, 20, and 40 tons-per-acre
Application Rates 56
Exhibit 4-2 Incremental Carbon Storage as a Function of Nitrogen Application Rate 57
Exhibit 4-3 Total Soil C; Iowa Site, Corn Harvested for Grain 58
Exhibit 4-4 Incremental Carbon Storage: MTCE/Wet Ton Versus Time 59
Exhibit 4-5 Difference in Carbon Storage Between Compost Addition and Base Case 60
Exhibit 4-6 Net GHG Emissions from Composting 61
Exhibit 5-1 Gross Emissions of GHGs from MSW Combustion 70
Exhibit 5-2 Avoided Utility GHG Emissions from Combustion at Mass Burn and RDF Facilities 71
Exhibit 5-3 Estimating the Weighted Average Carbon Coefficient of the U.S. Average Mix of
Fuels Used to Generate Electricity 73
Exhibit 5-4 Estimating the Emission Factor for Utility Generated Electricity 74
Exhibit 5-5 Avoided GHG Emissions Due to Increased Steel Recovery from MSW at WTE
Facilities 75
Exhibit 5-6 Net GHG Emissions from Combustion at WTE Facilities 77
Exhibit 6-1 Landfill Carbon Mass Balance 81
Exhibit 6-2 Experimental and Adjusted Values for CH
4
Yield and Carbon Storage 84
Exhibit 6-3 CH
4
Yield for Solid Waste Components 85
Exhibit 6-4 Carbon Storage for Solid Waste Components 85
Exhibit 6-5 Composition of Mixed Paper Categories from Barlaz Experiments 87
Exhibit 6-6 GHG Emissions from CH
4
Generation 89
Exhibit 6-7 Calculation to Estimate Utility GHGs Avoided through Combustion of Landfill CH
4
92
Exhibit 6-8 Net GHG Emissions from Landfilling 93
Exhibit 6-9 Net GHG Emissions from CH
4
Generation at Landfills with Recovery 94
Exhibit 6-10 Net GHG Emissions from CH
4
Generation at Landfills with Recovery 95
Exhibit 7-1 Energy Savings per Ton Recycled 98
Exhibit 7-2 Recycling GHG Benefits Attributable to Energy Savings (Recycling vs. Landfilling) 99
Exhibit 7-3 Energy Consumed/Avoided for Source Reduction 101
Exhibit 7-4 Energy Consumed/Avoided for Recycling 102
Exhibit 7-5 Energy Consumed/Avoided for Combustion 103
Exhibit 7-6 Energy Consumed/Avoided for Landfilling 104
Exhibit 7-7 Net Energy Consumed/Avoided from Source Reduction and MSW Management
Options 105
Exhibit 7-8 Energy Consumed/Avoided for MSW Management Options Compared to Landfilling 106
Exhibit 8-1 Recommended Surrogates for Voluntary Reporting 108
Exhibit 8-2 GHG Emissions for Source Reduction 116
Exhibit 8-3 GHG Emissions for Recycling 117
Exhibit 8-4 GHG Emissions for Composting 118
Exhibit 8-5 GHG Emissions for Combustion 119
Exhibit 8-6 GHG Emissions for Landfilling 120
Exhibit 8-7 Net GHG Emissions from Source Reduction and MSW Management Options 121
Exhibit 8-8 Net GHG Emissions of MSW Management Options Compared to Landfilling 122
Exhibit A-1 Net GHG Emissions from Source Reduction and MSW Management Options -
Emissions Counted from a Raw Materials Extraction Reference Point 125
Exhibit A-2 Net GHG Emissions from Source Reduction and MSW Management Options - Emissions
Counted from a Raw Materials Extraction Reference Point 126
Exhibit B-1 Net GHG Emissions from Source Reduction and MSW Management Options -
Emissions Counted from a Waste Generation Reference Point (MTCO
2
E/Ton) 127
Exhibit B-2 GHG Emissions of MSW Management Options Compared to Landfilling
(MTCO
2
E/Ton) 128
Exhibit B-3 GHG Emissions for Source Reduction (MTCO2E/Ton of Material Source Reduced) 129
Exhibit B-4 Recycling (GHG Emissions in MTCO2E/Ton) 130
Exhibit B-5 Composting (GHG Emissions in MTCO2E/Ton) 131
Exhibit B-6 Combustion (GHG Emissions in MTCO2E/Ton) 132
Exhibit B-7 Landfilling (GHG Emissions in MTCO2E/Ton) 133
Exhibit C-1 GHG Emissions for Source Reduction 137
Exhibit C-2 GHG Emissions for Recycling 138
Exhibit C-3 Net GHG Emissions from Composting 139
Exhibit C-4 Gross Emissions of GHGs from MSW Combustion 139
Exhibit C-5 Net GHG Emissions from Landfilling 140
EXECUTIVE SUMMARY: BACKGROUND AND FINDINGS
In the 21
st
century, management of municipal solid waste (MSW) continues to be an important
environmental challenge facing the United States. In 2003, the United States generated 236.2 million
tons
1
of MSW, an increase of 15 percent over 1990 generation levels and 168 percent over 1980 levels.
2
Climate change is also a serious issue, and the United States is embarking on a number of voluntary
actions to reduce the emissions of greenhouse gases (GHGs) that can intensify climate change. By
presenting material-specific GHG emission factors for various waste management options, this report
examines the interrelationship between MSW management and climate change.
Among the efforts to slow the potential for climate change are measures to reduce emissions of
carbon dioxide (CO
2
) from energy use, decrease emissions of methane (CH
4
) and other non-carbon-
dioxide GHGs, and promote long-term storage of carbon in forests and soil. Management options for
MSW provide many opportunities to affect these processes, directly or indirectly. This report integrates
information on the GHG implications of various management options for some of the most common
materials in MSW. To EPA’s knowledge, this work represents the most complete national study on GHG
emissions and sinks from solid waste management practices. The report’s findings may be used to
support a variety of programs and activities, including voluntary reporting of emission reductions from
waste management practices.
ES.1 GHGs AND CLIMATE CHANGE
Climate change is a serious international environmental concern and the subject of much
research. Many, if not most, of the readers of this report will have a general understanding of the
greenhouse effect and climate change. However, for those who are not familiar with the topic, a brief
explanation follows.
3
A naturally occurring shield of “greenhouse gases” (primarily water vapor, CO
2
, CH
4
, and nitrous
oxide), comprising 1 to 2 percent of the Earth’s atmosphere, absorbs some of the solar radiation that
would otherwise be radiated into space and helps warm the planet to a comfortable, livable temperature
range. Without this natural “greenhouse effect,” the average temperature on Earth would be
approximately -2 degrees Fahrenheit, rather than the current 57 degrees Fahrenheit.
4
Many scientists are concerned about the significant increase in the concentration of CO
2
and other
GHGs in the atmosphere. Since the preindustrial era, atmospheric concentrations of CO
2
have increased
by nearly 30 percent and CH
4
concentrations have more than doubled. There is a growing international
scientific consensus that this increase has been caused, at least in part, by human activity, primarily the
1
All references to tonnage of waste in this report are in short tons. All references to tons of carbon or CO
2
equivalent are in metric tons (i.e., MTCE per short ton of material).
2
EPA Office of Solid Waste, Municipal Solid Waste in the United States: 2003 Facts and Figures, EPA (2005), p. 2.
3
For more detailed information on climate change, please see the 2005 Inventory of U.S. Greenhouse Gas Emissions
and Sinks: 1990-2003, available online at:
/>(September 2005); and Climate Change 2001: The Scientific Basis (J.T. Houghton, et al., eds. Intergovernmental
Panel on Climate Change [IPCC]; published by Cambridge University Press, 2001). To obtain a list of additional
documents addressing climate change, access EPA’s global warming Web site at
4
Climate Change 2001: The Scientific Basis, op. cit., pp. 89-90.
ES-1
burning of fossil fuels (coal, oil, and natural gas) for such activities as generating electricity and driving
cars.
5
Moreover, in international scientific circles a consensus is growing that the buildup of CO
2
and
other GHGs in the atmosphere will lead to major environmental changes such as (1) rising sea levels that
may flood coastal and river delta communities; (2) shrinking mountain glaciers and reduced snow cover
that may diminish fresh water resources; (3) the spread of infectious diseases and increased heat-related
mortality; (4) possible loss in biological diversity and other impacts on ecosystems; and (5) agricultural
shifts such as impacts on crop yields and productivity.
6
Although reliably detecting the trends in climate
due to natural variability is difficult, the most accepted current projections suggest that the rate of climate
change attributable to GHGs will far exceed any natural climate changes that have occurred during the
last 1,000 years.
7
Many of these changes appear to be occurring already. Global mean surface temperatures already
have increased by about 1 degree Fahrenheit over the past century. A reduction in the northern
hemisphere’s snow cover, a decrease in Arctic sea ice, a rise in sea level, and an increase in the frequency
of extreme rainfall events all have been documented.
8
Such important environmental changes pose potentially significant risks to humans, social
systems, and the natural world. Many uncertainties remain regarding the precise timing, magnitude, and
regional patterns of climate change and the extent to which mankind and nature can adapt to any changes.
It is clear, however, that changes will not be easily reversed for many decades or even centuries because
of the long atmospheric lifetimes of GHGs and the inertia of the climate system.
ES.2 CLIMATE CHANGE INITIATIVES IN THE UNITED STATES
In 1992, world leaders and citizens from some 200 countries met in Rio de Janeiro, Brazil, to
confront global ecological concerns. At this “Earth Summit,” 154 nations, including the United States,
signed the United Nations Framework Convention on Climate Change (UNFCCC), an international
agreement to address the danger of global climate change. The objective of the Convention was to
stabilize GHG concentrations in the atmosphere over time at a level at which manmade climate
disruptions would be minimized.
By signing the Convention, countries made a voluntary commitment to reduce GHGs or take
other actions to stabilize emissions of GHGs. All Parties to the Convention were required to develop and
periodically update national inventories of their GHG emissions. The United States ratified the
Convention in October 1992. One year later, the United States issued its Climate Change Action Plan
(CCAP), which calls for cost-effective domestic actions and voluntary cooperation with states, local
governments, industry, and citizens to reduce GHG emissions.
In order to achieve the goals outlined in the Climate Change Action Plan, EPA initiated several
voluntary programs to realize the most cost-effective opportunities for reducing emissions. For example,
in 1994 EPA created the Landfill Methane Outreach Program, which aims to reduce landfill CH
4
emissions by facilitating the development of projects that use landfill gas to produce energy.
9
In the same
year, EPA introduced the Climate and Waste Program to capture the climate benefits of a broader set of
waste-related initiatives (e.g., recycling, source reduction). In 2001 EPA started the Green Power
Partnership. This partnership aids organizations that want to obtain some or all of their power from
5
Ibid., p. 7.
6
J.J. McCarthy, et al., eds. 2001. Climate Change 2001: Impacts, Adaptation, and Vulnerability. IPCC. Cambridge
University Press. pp. 9-13.
7
Climate Change 2001: The Scientific Basis , op. cit., p. 2.
8
Ibid., p. 4.
9
Available at the U.S. Environmental Protection Agency’s Landfill Methane Outreach Program website:
Toll-free hotline number: 800-782-7937.
ES-2
renewable energy sources, including landfill gas. The program has more than 500 partners, whose green
power purchasing commitments now exceed two million megawatt-hours.
To date, EPA’s voluntary partnership programs for climate protection have achieved substantial
environmental results. In 2004 alone, these programs reduced GHG emissions by 57 million metric tons
of carbon equivalent (MMTCE)—the equivalent of eliminating the annual emissions from approximately
45 million cars.
10
In addition, substantial CH
4
emission reductions—estimated at more than one MMTCE
for the period from 1999–2000—are being obtained as an ancillary benefit of Clean Air Act (CAA)
regulatory requirements that were promulgated in 1996, limiting emissions from landfills.
Many corporations that are concerned about climate change and wish to take action have joined
EPA’s Climate Leaders program. Participating corporations set reduction targets for themselves and
agree to report their emissions annually and monitor progress toward their target. Participants come from
a broad range of sectors, including energy and oil, pharmaceuticals, banking, high-tech, and
manufacturing.
11
As of April 2006, there were 86 Climate Leaders, 46 of whom had set reduction targets.
Together, these 79 companies account for about 8 percent of U.S. GHG emissions; the targets, if met, will
prevent emissions of more than eight MMTCE per year.
12
The U.S. Department of Energy (DOE) administers a voluntary GHG reporting program under
section 1605(b) of the Energy Policy Act of 1992. This program enables companies and other entities to
report their GHG emissions and to gain recognition for reductions they have implemented, including
reductions through MSW management innovations. The 1605(b) program is currently finalizing revised
guidelines and provisions.
13
There has been significant action on the regional level as well. The six New England states
(Connecticut, Maine, Massachusetts, New Hampshire, Rhode Island, and Vermont) joined with the
eastern Canadian provinces in 2001 to write the New England Governors/Eastern Canadian Premiers
(NEG/ECP) Climate Change Action Plan. The Governors and Premiers agreed to commit their states and
provinces to write and implement action plans that will achieve the goals of reducing emissions to 1990
levels by 2010, and to 10 percent below 1990 emissions by 2020.
14
Some of these states were among the
first to write climate change action plans, as a result of commitment to the NEG/ECP goals. Seven
northeastern states (plus four observer states) have joined together to form the Regional Greenhouse Gas
Initiative (RGGI), which, when it comes into effect, will be a cap-and-trade system for power plant GHG
emissions, the first of its kind in the US. The West Coast Governors’ Global Warming Initiative was
started by the Governors of California, Oregon, and Washington in 2003. The goals of the initiative
include combining purchasing power to improve the efficiency of vehicle fleets and improving appliance
efficiency standards. They are considering the creation of a regional cap-and-trade system. California is
also contemplating a cap-and-trade system that would include not just power plants, but also other
stationary sources of GHG emissions, such as semiconductor manufacturers.
Meanwhile, an increasing number of states have instituted their own voluntary actions to reduce
emissions. Forty-two states and Puerto Rico have inventoried their GHG emissions. Twenty-eight states
10
EPA Press Release, “10 Billion Saved on Energy Bills,” 4 October 2005; car equivalent calculation available
online at the U.S. Climate Technology Cooperation Gateway’s Greenhouse Gas Equivalencies Calculator:
11
Available at the EPA’s Climate Leaders website:
12
John Millet, “Five Climate Leaders Companies Reach Their Greenhouse Gas Reduction Goals,” U.S.
Environmental Protection Agency press release. 18 January 2006.
13
DOE, “Enhancing DOE’s Voluntary Reporting of Greenhouse Gases (1605(b)) Program.” Department of Energy.
Available online at:
14
The New England Governors/Eastern Canadian Premiers website:
ES-3
and Puerto Rico have completed or initiated state action plans, which outline steps to reduce emissions.
15
Twenty-five of these action plans have incorporated the reduction of waste into their GHG mitigation
strategies. Finally, at least 11 states—including California, Illinois, New Hampshire, and Wisconsin—are
in the process of establishing GHG registries, which enable companies and other entities to report
voluntary emission reductions.
16
Many states are engaging in further study of climate change implications and, in some cases,
enacting legislation. For example, 22 states and the District of Columbia have renewable portfolio
standards (RPS), requiring that electricity producers obtain a certain amount of their power from
renewable sources. In most of these states, waste-to-energy facilities and landfill gas are permitted
energy sources.
Oregon recently created its Strategy for Greenhouse Gas Reductions, outlining recommended
actions to reduce GHG emissions at the state level. Ten of these actions fall under the category
“Materials Use, Recovery, and Waste Disposal” and include such strategies as increasing “Bottle Bill”
refunds to 10 cents from 5 and widening the scope to include all beverage containers except milk.
Cities and towns also are taking action. More than 160 municipalities in the United States have
joined the Cities for Climate Protection (CCP) campaign run by ICLEI (Local Governments for
Sustainability). CCP members agree to inventory their GHG emissions, set a reduction target, write an
action plan to reduce emissions, and implement the plan. One of the key sectors that the CCP program
focuses on is waste, and many cities have taken action on this issue. For example, Seattle has increased
its recycling rate, reduced landfill CH
4
emissions, and banned recyclables from garbage.
ES.3 MUNICIPAL SOLID WASTE AND GHG EMISSIONS
What does MSW have to do with rising sea levels, higher temperatures, and GHG emissions?
For many wastes, the materials in MSW represent what is left over after a long series of steps: (1)
extraction and processing of raw materials; (2) manufacture of products; (3) transportation of materials
and products to markets; (4) use by consumers; and (5) waste management.
Virtually every step along this “life cycle” impacts GHG emissions. Solid waste management
decisions can reduce GHGs by affecting one or more of the following:
(1) Energy consumption
(specifically, combustion of fossil fuels) associated with making,
transporting, using, and disposing the product or material that becomes a waste.
(2) Nonenergy-related manufacturing emissions
, such as the CO
2
released when limestone is
converted to lime (e.g., steel manufacturing).
(3) CH
4
emissions from landfills where the waste is disposed.
(4) CO
2
and nitrous oxide (N
2
O) emissions from waste combustion.
(5) Carbon sequestration
, which refers to natural or manmade processes that remove carbon from
the atmosphere and store it for long periods or permanently.
The first four mechanisms add GHGs to the atmosphere and contribute to global warming. The
fifth—carbon sequestration—reduces GHG concentrations by removing CO
2
from the atmosphere.
15
EPA’s Global Warming—Actions, “State” webpage. Available at:
16
Progressive Policy Institute, State Greenhouse Gas Registries, 5 September 2003. Available at:
ES-4
Forest growth is one mechanism for sequestering carbon; if more biomass is grown than is removed
(through harvest or decay), the amount of carbon stored in trees increases, and thus carbon is sequestered.
Different wastes and waste management options have different implications for energy
consumption, CH
4
emissions, and carbon sequestration. Source reduction and recycling of paper
products, for example, reduce energy consumption, decrease combustion and landfill emissions, and
increase forest carbon sequestration.
ES.4 GENESIS AND APPLICATIONS OF THE REPORT
Recognizing the potential for source reduction and recycling of municipal solid waste to reduce
GHG emissions, EPA included a source reduction and recycling initiative in the original 1994 Climate
Change Action Plan and set an emission reduction goal based on a preliminary analysis of the potential
benefits of these activities. It was clear that a rigorous analysis would be needed to gauge more
accurately the total GHG emission reductions achievable through source reduction and recycling.
That all of the options for managing MSW should be considered also became clear. By
addressing a broader set of MSW management options, a more comprehensive picture of the GHG
benefits of voluntary actions in the waste sector could be determined, and the relative GHG impacts of
various waste management approaches could be assessed. To this end, EPA launched a major research
effort, the results of which were published in the first edition of this report in September 1998. A second
edition of the report was published in May 2002. This third edition of the report includes additional
materials and incorporates updated data affecting some of the material-specific results. The emission
factors
17
presented will continue to be updated and improved as more data become available. The latest
emission factors, reflecting these ongoing revisions, can be found on EPA’s “Measuring Greenhouse Gas
Emissions from Waste” website.
18
The primary application of the GHG emission factors in this report is to support waste-related
decisionmaking in the context of climate change. By quantifying the climate impacts of waste
management decisions, the factors in this report enable municipalities, companies, and other waste
management decisionmakers to measure the benefits of their actions. In recent years, the emission factors
have been applied for this purpose in a number of ways. In conjunction with the DOE, EPA has used
these estimates to develop guidance for voluntary reporting of GHG reductions, as authorized by
Congress in Section 1605(b) of the Energy Policy Act of 1992. However, under the new, more rigorous
1605(b) reporting guidelines, emissions reductions from solid waste management practices would be
reported separately under “other indirect emissions” and not included in the main corporate inventory.
Other applications have included quantifying the GHG reductions from voluntary programs
aimed at source reduction and recycling, such as EPA’s WasteWise, Pay-As-You-Throw, and Coal
Combustion Products Partnership (C
2
P
2
) programs. EPA also has worked with the Climate Neutral
Network to develop company-specific GHG “footprints” for the network’s member companies, who have
pledged to become GHG “neutral” through emission reductions or offset activities.
Currently, Climate Leaders does not record GHG emissions reductions from the purchase of
recycled-content paper or the recycling of waste paper in a Partners' inventory. Climate Leaders focuses
on corporate-level GHG inventory emissions calculations and reporting. Calculating GHG emission
reductions from recycling uses a project-level approach which can involve a high level of uncertainty
from the calculation of avoided emissions. The approach used to calculate a corporate GHG emissions
inventory uses activity data, such as fuel consumption, which allow for a higher level of accuracy than the
17
An amount of waste (in short tons) is multiplied by an emission factor (in MTCE/ton) to yield GHG emissions in
MTCE. Each emission factor is specific to a particular waste management practice and to a particular material type.
18
EPA’s Global Warming—Waste, “Measuring Greenhouse Gas Emissions from Waste” webpage. Available at:
ES-5
avoided emissions approach. Therefore, Climate Leaders does not currently count these GHG emissions
reductions from avoided emissions. However, as the methodology for calculating project level reductions
from the use of recycled paper and the recycling of waste paper evolves, EPA will reconsider recognizing
Partners for these activities. Since the reductions from improved materials management activities do lead
to global reductions in GHG emissions EPA encourages Partners to continue efforts in promoting these
programs and measuring their impact.
The international community has shown considerable interest in using the emission factors—or
adapted versions—to develop GHG emission estimates for non-U.S. solid waste streams.
19
For example,
Environment Canada and Natural Resources Canada recently employed EPA’s life-cycle methodology
and components of its analysis to develop a set of Canada-specific GHG emission factors to support
analysis of waste-related mitigation opportunities.
20
Additionally, EPA worked with ICLEI to incorporate GHG emission factors into its municipal
GHG accounting software. Currently, more than 600 communities worldwide participate in ICLEI’s
Cities for Climate Protection Campaign, which helps them establish a GHG emission reduction target and
implement a comprehensive local action plan designed to achieve that target. Currently, EPA is exploring
other options for broadening the use of its research internationally.
To make it easier for organizations to use these emission factors, EPA created the Waste
Reduction Model (WARM), the Recycled Content (ReCon) Tool, and the Durable Goods Calculator
(DGC). All of these tools are discussed in more detail in Section
ES.7, below.
ES.5 THE IMPACT OF MUNICIPAL SOLID WASTE MANAGEMENT ON GHG
EMISSIONS
To measure the GHG impacts of MSW, EPA first decided which wastes to analyze. The universe
of materials and products found in MSW was surveyed and those that are most likely to have the greatest
impact on GHGs were identified. These determinations were based on (1) the quantity generated; (2) the
differences in energy use for manufacturing a product from virgin versus recycled inputs; and (3) the
potential contribution of materials to CH
4
generation in landfills. By this process, EPA limited the
analysis to the following 21 single-material items:
21
• Three categories of metal:
• Aluminum Cans;
• Steel Cans;
• Copper Wire;
• Glass;
• Three types of plastic:
• HDPE (high-density polyethylene);
• LDPE (low-density polyethylene);
• PET (polyethylene terephthalate);
19
Note that waste composition and product life cycles vary significantly among countries. This report may assist
other countries by providing a methodological framework and benchmark data for developing GHG emission
estimates for their solid waste streams.
20
Environment Canada. 2001. Determination of the Impact of Waste Management Activities on Greenhouse Gas
Emissions. Prepared by ICF Consulting, Torrie-Smith Associates, and Enviros-RIS.
21
The following materials are new to this edition: copper wire, clay bricks, concrete, fly ash, tires, carpet, and
personal computers.
ES-6
• Six categories of paper products:
• Corrugated Cardboard;
• Magazines/Third-class Mail;
• Newspaper;
• Office Paper;
• Phonebooks;
• Textbooks;
• Two types of wood products:
• Dimensional Lumber;
• Medium-density Fiberboard;
• Food Discards;
• Yard Trimmings;
• Clay Bricks;
• Concrete;
• Fly Ash; and
• Tires.
EPA’s researchers also included two products that are composites of several materials:
• Carpet; and
• Personal Computers.
The foregoing materials constitute more than 65 percent, by weight, of MSW, as shown in
Exhibit ES-1 (this figure excludes clay bricks, concrete, copper wire, fly ash, and medium-density
fiberboard, which were not included in the waste characterization report cited here).
22
In addition to the materials listed above, EPA examined the GHG implications of managing
mixed plastics, mixed metals, mixed organics, mixed recyclables, mixed MSW, and three definitions of
mixed paper. Each of these mixed categories is summarized below.
• Mixed plastics are composed of HDPE, LDPE, and PET and are estimated by taking a weighted
average of the 2003 recovery rates for these three plastic types.
• Mixed metals are composed of steel cans and aluminum cans and are estimated by taking a
weighted average of the 2003 recovery rates for these two metal types.
• Mixed organics are a weighted average of food discards and yard trimmings, using generation
rates for 2003.
• Mixed recyclables are materials that are typically recycled. As used in this report, the term
includes the items listed in
Exhibit ES-1, except food discards and yard trimmings. The emission
factors reported for mixed recyclables represent the average GHG emissions for these materials,
weighted by the tonnages at which they were recycled in 2003.
22
Note that these data are based on national averages. The composition of solid waste varies locally and regionally;
local or state-level data should be used when available.
ES-7
• Mixed MSW comprises the waste material
typically discarded by households and
collected by curbside collection vehicles; it
does not include white goods (e.g.,
refrigerators, toasters) or industrial waste.
This report analyzes mixed MSW on an “as-
disposed” (rather than “as-generated”) basis.
• Mixed paper is recycled in large quantities
and is an important class of scrap material in
many recycling programs. Presenting a
single definition of mixed paper is difficult,
however, because recovered paper varies
considerably, depending on the source. For
purposes of this report, EPA identified three
categories of mixed paper according to the
dominant source—broad (includes most
categories of recyclable paper products),
office, and residential (see Exhibit 3-2 for
definitions of mixed paper categories).
The EPA researchers developed a
streamlined life-cycle inventory for each of the
selected materials. The analysis is streamlined in the
sense that it examines GHG emissions only and is not
a comprehensive environmental analysis of all
emissions from municipal solid waste management
options.
23
Exhibit ES-1
U.S. Generation of MSW For Materials in This
Report
MSW Generation by
Weight (percent)
Material
Aluminum Cans 0.6%
Steel Cans 1.1%
Copper Wire N/A
Glass 4.5%
HDPE 1.6%
LDPE 1.3%
PET 0.9%
Corrugated Cardboard 12.6%
Magazines/Third-class
3.2%
Newspaper 5.4%
Office Paper 3.0%
Phonebooks 0.3%
Textbooks 0.4%
Dimensional Lumber
a
3.5%
Medium-density
Fiberboard
N/A
Food Discards 11.0%
EPA focused on those aspects of the life
cycle that have the potential to emit GHGs as
materials change from their raw states to products
and then to waste.
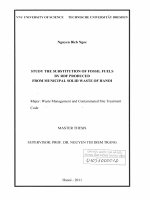
Exhibit ES-3 shows the steps in
the life cycle at which GHGs are emitted, carbon
sequestration is affected, and utility energy is
displaced. As shown, EPA examined the potential
for these effects at the following points in a product’s
life cycle:
Yard Trimmings 12.1%
Carpet 1.2%
Personal Computers N/A
Clay Bricks N/A
Concrete N/A
Fly Ash N/A
Tires 2.0%
TOTAL 64.8%
• Raw material acquisition (fossil fuel energy
and other emissions, and changes in forest
carbon sequestration);
a
Listed in Municipal Solid Waste in the United States: 2003
Facts and Figures as “Wood—Containers and Packaging.
Source: EPA. 2005. Municipal Solid Waste in the United
States: 2003 Facts and Figures, EPA 530-F-05-003.
23
EPA’s Office of Research and Development (ORD) performed a more extensive application of life-cycle
assessment for various waste management options for MSW. A decision support tool (DST) and life-cycle
inventory (LCI) database for North America have been developed with funding by ORD through a cooperative
agreement with the Research Triangle Institute (RTI) (CR823052). This methodology is based on a multimedia,
multipollutant approach and includes analysis of GHG emissions as well as a broader set of emissions (air, water,
and waste) associated with MSW operations. The LCI database is expected to be released in the summer of 2006.
The website address for further information is:
then search the term “DST.”
ES-8
Improvements to the New Edition
This report is the third edition of Greenhouse Gas
Emissions from Management of Selected Materials in Municipal
Solid Waste. This edition includes the following improvements:
• Develops emission factors for seven new material types:
copper wire, clay bricks, concrete, fly ash, tires, carpet, and
personal computers;
• Incorporates new energy data into calculations of utility
offsets;
• Updates U.S. landfill gas collection characteristics to reflect
the latest values from the U.S. Greenhouse Gas Inventory;
• Revises carbon coefficients and fuel use for national average
electricity generation;
• Includes a discussion of emerging issues in the area of
climate change and waste management;
• Includes a chapter on the energy reduction benefits of solid
waste management.
• Provides an updated list of suggested proxy values for
voluntary reporting of GHG emission reductions;
• Includes a discussion of open-loop recycling, as it relates to
EPA’s factors for fly ash, carpet, personal computers, and
mixed paper;
• Adds retail transport to the methodology;
• Updates the current mix of recycled/virgin inputs for various
materials; and
• Includes an updated analysis of forest carbon sequestration
and moves the discussion into the recycling chapter.
These changes and/or revisions are described in more detail
throughout the report and in Appendix C.
• Manufacturing (fossil fuel
energy emissions); and
• Waste management (CO
2
emissions associated with
composting, nonbiogenic CO
2
and N
2
O emissions from
combustion, and CH
4
emissions
from landfills); these emissions
are offset to some degree by
carbon storage in soil and
landfills, as well as avoided
utility emissions from energy
recovery at combustors and
landfills.
At each point in the material life
cycle, EPA also considered
transportation-related energy emissions.
Estimates of GHG emissions associated
with electricity used in the raw materials
acquisition and manufacturing steps are
based on the nation’s current mix of
energy sources,
24
including fossil fuels,
hydropower, and nuclear power.
However, when estimating GHG
emission reductions attributable to utility
emissions avoided, the electricity use
displaced by waste management practices
is assumed to be 100 percent fossil-
derived.
25
EPA did not analyze the GHG
emissions typically associated with
consumer use of products because the
primary concern of this report was
end-of-life management. Although the consumer-use stage of life can in some cases (e.g., personal
computers) account for significant energy consumption, the energy consumed during use would be
approximately the same whether the product was made from virgin or recycled inputs.
To apply the GHG estimates developed in this report, one must compare a baseline scenario with
an alternative scenario, on a life-cycle basis. For example, one could compare a baseline scenario, where
10 tons of office paper are manufactured, used, and landfilled, to an alternative scenario, where 10 tons
are manufactured, used, and recycled.
Exhibit ES-2 shows how GHG sources and sinks are affected by each waste management
strategy. For example, the top row of the exhibit shows that source reduction
26
(1) reduces GHG
24
The emissions are based on the current national grid mix, as opposed to regional grids.
25
EPA adopted this approach based on suggestions from several reviewers who argued that fossil fuels should be
regarded as the marginal fuel displaced by waste-to-energy and landfill gas recovery systems.
26
The source reduction techniques the EPA researchers analyzed involve using less of a given product—e.g., by
making aluminum cans with less aluminum (“lightweighting”); double-sided rather than single-sided photocopying;
ES-9
ES-10
emissions from raw materials acquisition and manufacturing; (2) results in an increase in forest carbon
sequestration; and (3) does not result in GHG emissions from waste management. The sum of emissions
(and sinks) across all steps in the life cycle represents net emissions.
Exhibit ES-2 Components of Net Emissions for Various MSW Management Strategies
GHG Sources and Sinks
MSW
Management
Strategy
Raw Materials Acquisition and
Manufacturing
Changes in Forest or
Soil Carbon Storage
Waste Management
Source Reduction Decrease in GHG emissions,
relative to the baseline of
manufacturing
Increase in forest carbon
sequestration (for
organic materials)
No emissions/sinks
Recycling Decrease in GHG emissions due
to lower energy requirements
(compared to manufacture from
virgin inputs) and avoided
process nonenergy GHGs
Increase in forest carbon
sequestration (for
organic materials)
Process and transportation
emissions associated with recycling
are counted in the manufacturing
stage
Composting (food
discards, yard
trimmings)
NA Increase in soil carbon
storage
Compost machinery emissions and
transportation emissions
Combustion NA
NA
Nonbiogenic CO
2
, N
2
O emissions,
avoided utility emissions, and
transportation emissions
Landfilling NA NA CH
4
emissions, long-term carbon
storage, avoided utility emissions,
and transportation emissions
NA = Not Applicable
or reuse of a product. EPA did not analyze source reduction through material substitution (except in the special case
of fly ash)—e.g., substituting plastic boxes for corrugated paper boxes. Nor did EPA estimate the potential for
source reduction of chemical fertilizers and pesticides with increased production and use of compost. For a
discussion of source reduction with material substitution, see Section 3.3.
Exhibit ES-3 Greenhouse Gas Sources and Sinks Associated with the Material Life Cycle
ES-11
ES.6 RESULTS OF THE ANALYSIS
Management of municipal solid waste presents many opportunities for GHG emission
reductions. Source reduction and recycling can reduce GHG emissions at the manufacturing
stage, increase forest carbon sequestration, and avoid landfill CH
4
emissions. When waste is
combusted, energy recovery displaces electricity generated by utilities by burning fossil fuels
(thus reducing GHG emissions from the utility sector), and landfill CH
4
emissions are avoided.
Landfill CH
4
emissions can be reduced by using gas recovery systems and by diverting organic
materials from landfills. Landfill CH
4
can be flared or utilized for its energy potential. When
used for its energy potential, landfill CH
4
displaces fossil fuels, as with MSW combustion.
In order to support a broad portfolio of climate change mitigation activities covering a
range of GHGs, various methodologies for estimating emissions are needed. The primary result
of this research is the development of material-specific GHG emission factors that can be used to
account for the climate change benefits of waste management practices.
Exhibit ES-4 presents the GHG impacts of source reduction, recycling, composting,
combustion, and landfilling. The impacts are calculated per short ton of waste managed. Please
note that the emission factors presented in this report are intended to be compared with one
another. They are not meant to reflect absolute values, but instead reflect the impact of choosing
one waste management option over another for a given material type. This convention enabled
EPA to calculate emission impacts from a waste generation reference point (i.e., from the
moment a material is discarded). This process is in contrast to a typical life-cycle analysis, which
reflects a raw materials extraction reference point. “Upstream” emissions and sinks are captured
in EPA’s streamlined methodology once a baseline waste management practice is compared to an
alternative waste management practice.
In addition, this report does not include emissions from the use phase of a product’s life,
since use does not have an effect on the waste management emissions of a product. EPA took
this approach because expert review of the first edition indicated that a waste management
perspective would be more useful and comprehensible to waste managers, at whom this report is
chiefly aimed.
27
The results are the same in the end, because it is the difference between the
baseline and the alternative waste disposal scenarios that show the GHG savings from different
treatment options; therefore, all tables and analyses in this report use a “waste generation”
reference point.
Exhibit ES-4 presents these values in MTCE/short ton of waste.
28
In these
tables, emissions for 1 ton of a given material are presented across different management options.
The life-cycle GHG emissions for each of the first four waste management strategies—source
reduction, recycling, composting, and combustion—are compared to the GHG emissions from
landfilling in
Exhibit ES-5. These exhibits show the GHG values for each of the first four
management strategies, minus the GHG values for landfilling. With these exhibits, one may
compare the GHG emissions of changing management of 1 ton of each material from landfilling
(often viewed as the baseline waste management strategy) to one of the other waste management
options.
All values shown in
Exhibit ES-4 and Exhibit ES-5 are for national average conditions
(e.g., average fuel mix for raw material acquisition and manufacturing using recycled inputs;
typical efficiency of a mass burn combustion unit; and national average landfill gas collection
rates). GHG emissions are sensitive to some factors that vary on a local basis, and thus site-
specific emissions will differ from those summarized here.
27
For the same results using a raw material extraction reference point, please see Appendix A.
28
For the same results in MTCO
2
E, please see Appendix B.
ES-12
Following is a discussion of the principal GHG emissions and sinks for each waste
management practice and the effect that they have on the emission factors:
• Source reduction, in general, represents an opportunity to reduce GHG emissions in a
significant way. For many materials, the reduction in energy-related CO
2
emissions from
the raw material acquisition and manufacturing process, and the absence of emissions
from waste management, combine to reduce GHG emissions more than other options do.
• For most materials, recycling represents the second best opportunity to reduce GHG
emissions. For these materials, recycling reduces energy-related CO
2
emissions in the
manufacturing process (although not as dramatically as source reduction) and avoids
emissions from waste management. Paper recycling increases the sequestration of forest
carbon.
• Composting is a management option for food discards and yard trimmings. The net GHG
emissions from composting are lower than landfilling for food discards (composting
avoids CH
4
emissions), and higher than landfilling for yard trimmings (landfilling is
credited with the carbon storage that results from incomplete decomposition of yard
trimmings). Overall, given the uncertainty in the analysis, the emission factors for
composting or combusting these materials are similar.
• The net GHG emissions from combustion of mixed MSW are lower than landfilling
mixed MSW (under national average conditions for landfill gas recovery). Combustors
and landfills manage a mixed waste stream; therefore, net emissions are determined more
by technology factors (e.g., the efficiency of landfill gas collection systems and
combustion energy conversion) than by material specificity. Material-specific emissions
for landfills and combustors provide a basis for comparing these options with source
reduction, recycling, and composting.
ES-13
Exhibit ES-4
Net GHG Emissions from Source Reduction and MSW Management Options
(MTCE/Ton)
a
Material
Source
Reduction
b
Recycling Composting Combustion
c
Landfilling
d
Aluminum Cans -2.24 -3.70 NA 0.02 0.01
Steel Cans -0.87 -0.49 NA -0.42 0.01
Copper Wire -2.00 -1.34 NA 0.01 0.01
Glass -0.16 -0.08 NA 0.01 0.01
HDPE -0.49 -0.38 NA 0.25 0.01
LDPE -0.62 -0.46 NA 0.25 0.01
PET -0.57 -0.42 NA 0.30 0.01
Corrugated Cardboard -1.52 -0.85 NA -0.18 0.11
Magazines/Third-class Mail -2.36 -0.84 NA -0.13 -0.08
Newspaper -1.33 -0.76 NA -0.20 -0.24
Office Paper -2.18 -0.78 NA -0.17 0.53
Phonebooks -1.72 -0.72 NA -0.20 -0.24
Textbooks -2.50 -0.85 NA -0.17 0.53
Dimensional Lumber -0.55 -0.67 NA -0.21 -0.13
Medium-density Fiberboard -0.60 -0.67 NA -0.21 -0.13
Food Discards NA NA -0.05 -0.05 0.20
Yard Trimmings NA NA -0.05 -0.06 -0.06
Mixed Paper
Broad Definition NA -0.96 NA -0.18 0.09
Residential Definition NA -0.96 NA -0.18 0.07
Office Paper Definition NA -0.93 NA -0.16 0.13
Mixed Metals NA -1.43 NA -0.29 0.01
Mixed Plastics NA -0.41 NA 0.27 0.01
Mixed Recyclables NA -0.79 NA -0.17 0.04
Mixed Organics NA NA -0.05 -0.05 0.06
Mixed MSW as Disposed NA NA NA -0.03 0.12
Carpet -1.09 -1.96 NA 0.11 0.01
Personal Computers -15.13 -0.62 NA -0.05 0.01
Clay Bricks -0.08 NA NA NA 0.01
Concrete NA 0.00 NA NA 0.01
Fly Ash NA -0.24 NA NA 0.01
Tires -1.09 -0.50
e
NA 0.05 0.01
Note that totals may not add due to rounding, and more digits may be displayed than are significant.
NA: Not applicable, or in the case of composting of paper, not analyzed.
a
MTCE/ton: Metric tons of carbon equivalent per short ton of material. Material tonnages are on an as-managed (wet
weight) basis.
b
Source reduction assumes initial production using the current mix of virgin and recycled inputs.
c
Values are for mass burn facilities with national average rate of ferrous recovery.
d
Values reflect estimated national average CH
4
recovery in year 2003.
e
Recycling of tires, as modeled in this analysis, consists only of retreading the tires.
ES-14
Exhibit ES-5
GHG Emissions of MSW Management Options Compared to Landfilling (MTCE/Ton)
a
(Management Option Net Emissions Minus Landfilling Net Emissions)
Material
Source
Reduction
b
(Current
Mix)
Source
Reduction
(100%
Virgin
Inputs) Recycling Composting
c
Combustion
d
Aluminum Cans -2.26 -4.28 -3.71 NA 0.01
Steel Cans -0.88 -1.02 -0.50 NA -0.43
Copper Wire -2.01 -2.03 -1.35 NA 0.00
Glass -0.17 -0.19 -0.09 NA 0.00
HDPE -0.50 -0.55 -0.39 NA 0.24
LDPE -0.63 -0.65 -0.47 NA 0.24
PET -0.58 -0.60 -0.43 NA 0.28
Corrugated Cardboard -1.63 -2.32 -0.96 NA -0.29
Magazines/Third-class Mail -2.28 -2.36 -0.76 NA -0.05
Newspaper -1.09 -1.39 -0.52 NA 0.03
Office Paper -2.71 -2.79 -1.31 NA -0.70
Phonebooks -1.49 -1.49 -0.49 NA 0.03
Textbooks -3.03 -3.11 -1.38 NA -0.70
Dimensional Lumber -0.42 -0.42 -0.54 NA -0.08
Medium-density Fiberboard -0.47 -0.47 -0.54 NA -0.08
Food Discards NA NA NA -0.25 -0.25
Yard Trimmings NA NA NA 0.01 0.00
Mixed Paper
Broad Definition NA NA -1.06 NA -0.27
Residential Definition NA NA -1.03 NA -0.25
Office Paper Definition NA NA -1.06 NA -0.29
Mixed Metals NA NA -1.44 NA -0.30
Mixed Plastics NA NA -0.42 NA 0.26
Mixed Recyclables NA NA -0.83 NA -0.20
Mixed Organics NA NA NA -0.12 -0.12
Mixed MSW as Disposed NA NA NA NA -0.15
Carpet -1.10 -1.10 -1.97 NA 0.10
Personal Computers -15.14 -15.14 -0.63 NA -0.06
Clay Bricks -0.09 -0.09 -0.01 NA -0.01
Concrete -0.01 -0.01 -0.01 NA -0.01
Fly Ash -0.01 -0.01 -0.25 NA -0.01
Tires -1.10 -1.10 -0.51
e
NA 0.04
Note that totals may not add due to rounding, and more digits may be displayed than are significant.
NA: Not applicable, or in the case of composting of paper, not analyzed.
a
Values for landfilling reflect projected national average CH
4
recovery in year 2003.
b
Source reduction assumes initial production using the current mix of virgin and recycled inputs.
c
Calculation is based on assuming zero net emissions for composting.
d
Values are for mass burn facilities with national average rate of ferrous recovery.
e
Recycling of tires, as modeled in this analysis, consists only of retreading the tires.
ES-15
The ordering of combustion, landfilling, and composting is affected by (1) the GHG inventory
accounting methods, which do not count CO
2
emissions from sustainable biogenic sources,
29
but do count
emissions from sources such as plastics; and (2) a series of assumptions on sequestration, future use of
CH
4
recovery systems, system efficiency for landfill gas recovery, ferrous metal recovery, and avoided
utility fossil fuels. On a site-specific basis, the ordering of results between a combustor and a landfill
could be different from the ordering provided here, which is based on national average conditions.
EPA conducted sensitivity analyses to examine the GHG emissions from landfilling under
varying assumptions about (1) the percentage of landfilled waste sent to landfills with gas recovery, and
(2) CH
4
oxidation rate and gas collection system efficiency. The sensitivity analyses demonstrate that the
results for landfills are very sensitive to these factors, which are site-specific.
30
Thus, using a national
average value when making generalizations about emissions from landfills masks some of the variability
that exists from site to site.
The scope of this report is limited to developing emission factors that can be used to evaluate
GHG implications of solid waste decisions. EPA does not analyze policy options in this report.
Nevertheless, the differences in emission factors across various waste management options are
sufficiently large as to imply that GHG mitigation policies in the waste sector can make a significant
contribution to U.S. emission reductions. A number of examples, using the emission factors in this
report, illustrate this point.
• At the firm level, targeted recycling programs can reduce GHGs. For example, a commercial
facility that shifts from (a) a baseline practice of landfilling (in a landfill with no gas collection
system) 50 tons office paper and 4 tons of aluminum cans to (b) recycling the same materials can
reduce GHG emissions by more than 100 MTCE.
• At the community level, a city of 100,000 with average waste generation (4.5 lbs/day per capita),
recycling (30 percent), and baseline disposal in a landfill with no gas collection system could
increase its recycling rate to 40 percent—for example, by implementing a pay-as-you-throw
program—and reduce emissions by more than 3,400 MTCE per year. (Note that further growth
in recycling would be possible; some communities already are exceeding recycling rates of 50
percent).
• A city of 1 million, disposing of 650,000 tons per year in a landfill without gas collection, could
reduce its GHG emissions by about 260,000 MTCE per year by managing waste in a mass burn
combustor unit.
• A town of 50,000 people landfilling a total of 30,000 tons per year could install a landfill gas
recovery system with electricity generation and reduce emissions by about 13,500 MTCE per
year.
• At the national level, if the United States attains the goal of a 35 percent recycling rate by 2008,
emissions will be nearly 59 million MTCE per year lower than if no recycling took place.
29
Sustainable biogenic sources include paper and wood products from sustainably managed forests. When these
materials are burned or aerobically decomposed to CO
2
, the CO
2
emissions are not counted. The approach to
measuring GHG emissions from biogenic sources is described in detail in Chapter 1.
30
For details on the sensitivity analyses, see section 6.5 and Exhibits 6-7 and 6-8.
ES-16
ES.7 OTHER LIFE-CYCLE GHG ANALYSES AND TOOLS
Life-cycle analysis is being used increasingly to quantify the GHG impacts of private and public
sector decisions. In addition to the life-cycle analyses that underpin the emission factors in this report,
Environmental Defense,
31
ICLEI, Ecobilan, and others have analyzed the life-cycle environmental
impacts of various industry processes (e.g., manufacturing) and private and public sector practices (e.g.,
waste management). In many cases, the results of life-cycle analyses are packaged into software tools
that distill the information according to a specific user’s needs.
ICF International worked with EPA to create the WARM, ReCon, and DGC tools, in addition to
researching and writing this report, and creating the emission factors used here and in the tools. As
mentioned earlier, WARM was designed as a tool for waste managers to weigh the GHG and energy
impacts of their waste management practices. As a result, the model focuses exclusively on waste sector
GHG emissions, and the methodology used to estimate emissions is consistent with international and
domestic GHG accounting guidelines. Life-cycle tools designed for broader audiences necessarily
include other sectors and/or other environmental impacts, and are not necessarily tied to the
Intergovernmental Panel on Climate Change (IPCC) guidelines for GHG accounting or the methods used
in the Inventory of U.S. Greenhouse Gas Emissions and Sinks.
• WARM is an EPA model that enables users to input several key variables (e.g., landfill gas
collection system information, electric utility fuel mix, and transportation distances).
32
The
model covers 34 types of materials and five waste management options: source reduction,
recycling, combustion, composting, and landfilling. WARM accounts for upstream energy and
nonenergy emissions, transportation distances to disposal and recycling facilities, carbon
sequestration, and utility offsets that result from landfill gas collection and combustion. The tool
provides participants in DOE’s 1605(b) program with the option to report results by year, by gas,
and by year and gas (although under 1605(b)’s revised guidelines, avoided emissions from
recycling must be reported separately under “other indirect emissions” and not included in the
main corporate inventory). WARM software is available free of charge in both a Web-based
calculator format and a Microsoft® Excel spreadsheet. The tool is ideal for waste planners
interested in tracking and reporting voluntary GHG emission reductions from waste management
practices and for comparing the climate change impacts of different approaches. To access the
tool, visit:
then follow link to Tools.
• Recycled Content (ReCon) Tool was created by EPA to help companies and individuals estimate
life-cycle GHG emissions and energy impacts from purchasing and/or manufacturing materials
with varying degrees of postconsumer recycled content. The tool covers 17 material types and an
analysis of baseline and alternative recycled-content scenarios. ReCon accounts for total
“upstream” GHG emissions based on manufacturing processes, carbon sequestration, and avoided
disposal that are related to the manufacture of the materials with recycled content. ReCon also
accounts for the total energy (based on manufacturing processes and avoided disposal) related to
the manufacture of materials with recycled content. The tool is ideal for companies and
individuals who want to calculate GHG emissions and energy consumption associated with
purchasing and manufacturing using baseline and alternate recycled-content scenarios. To access
the tool, visit:
then follow link to Tools.
31
Blum, L., Denison, R.A., and Ruston, V.F. 1997. A Life-Cycle Approach to Purchasing and Using
Environmentally Preferable Paper: A Summary of the Paper Task Force Report,” Journal of Industrial Ecology.
I:3:15-46. Denison, R.A. 1996. “Environmental Life-Cycle Comparison of Recycling, Landfilling, and Incineration:
A Review of Recent Studies”; Annual Review of Energy and the Environment 21:6:191-237.
32
Microsoft Excel and Web-based versions of this tool are available online at the following website:
ES-17