OUTBREAKS BY THE NUMBERS: FRUITS AND VEGETABLES 1990-2005 potx
Bạn đang xem bản rút gọn của tài liệu. Xem và tải ngay bản đầy đủ của tài liệu tại đây (85.27 KB, 15 trang )
OUTBREAKS BY THE NUMBERS: FRUITS
AND
VEGETABLES
1990-2005
CAROLINE SMITH DEWAAL
FARIDA BHUIYA
C
ENTER FOR SCIENCE IN THE PUBLIC INTEREST
W
ASHINGTON, DC 20009
ABSTRACT
The year 2006 was a banner year for produce-related foodborne
illness outbreaks, marked by outbreaks linked to spinach, tomatoes and
lettuce. In a comprehensive survey of outbreaks with an identified food
source, produce outbreaks accounted for 13% (713/5,416) of outbreaks
and 21% (34,049/161,089) of associated illnesses from 1990 though 2005,
according to data from the Center for Science in the Public Interest (CSPI).
CSPI conducted a hazard analysis on produce by identifying the most
common food/pathogen combinations and ranked their risk based on their
history of causing outbreaks and associated illnesses.
Greens-based salads contaminated with Norovirus was the most
common cause of outbreaks, followed by lettuce with Norovirus, sprouts
with Salmonella, unspecified fruit with Norovirus, greens-based salads
with Salmonella, melon with Salmonella, mushrooms with chemicals or
toxins, greens-based salads with E. coli, lettuce with E. coli, and potatoes
with Salmonella.
In all produce outbreaks, Norovirus is the top cause of outbreaks
(40%), followed by Salmonella (18%), E. coli (8%) and Clostridium (6%).
The main hazards associated with fruits are Norovirus (39%), Salmonella
(28%), and Cyclospora (8%). In vegetable outbreaks, the major pathogens
are Norovirus (26%), Salmonella (21%), and Clostridium (12%). The
major pathogens in produce dish outbreaks are Norovirus (51%),
Salmonella (13%), E. coli (6%) and Shigella (6%).
In light of the recent produce related outbreaks, identifying ways to
control hazards will reduce the risk of foodborne illness from produce. By
identifying food/pathogen combinations responsible for produce
outbreaks, we can generate a hazard analysis, which is the first step in
identifying appropriate solutions.
BACKGROUND
• Each year, 76 million people become ill and 5,000 die after eating
poisoned food, according to the Centers for Disease Control and
Prevention (CDC).
• Only a small proportion of foodborne illnesses are associated with
outbreaks reported to CDC, and of the reported outbreaks
between 1990 and 2005, less than 37% have both an identified
etiology and food source.
• The CDC publishes foodborne illness outbreak line listings
organized by pathogen, including outbreaks with unknown
etiologies and outbreaks with unknown food vehicles.
• CSPI maintains a database of only those foodborne illness
outbreaks with an identified etiology and food vehicle. The
outbreaks are categorized by specific food type, which is critical
information for making science-based risk management decisions.
• Outbreak data has helped improve the hazard analysis for various
food commodities, such as meat, seafood, and juice. It can also be
used for produce, a commodity that causes high numbers of
outbreaks and illnesses. In the past year alone, numerous
multistate produce outbreaks have highlighted the urgency of
gaining a better understanding of that pathogens that cause
produce outbreaks in order to better ensure produce safety.
METHODS
• CSPI’s data is compiled from various sources, including the CDC,
state and local health departments, and scientific and medical
journals.
• The database is updated regularly, and only includes those
incidents of foodborne illness which meet the CDC’s definition of
an outbreak, occurred in the United States between 1990 and
2004, and for which there is a known or suspected etiology and an
identified food vehicle.
• Outbreaks in the CSPI database are grouped according to
regulatory agency, and placed within one of thirteen food
categories. Each category is then subdivided into food types. The
database is updated as new reports of foodborne illness are
identified, and is published periodically in CSPI’s Outbreak Alert!
• Using the Outbreak Alert! database, we identified the most
common produce-pathogen combinations causing outbreaks from
1990 to 2004.
RESULTS
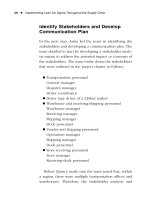
• Between 1990 and 2005, there were 713 outbreaks and 34,049
individual cases linked to produce in the CSPI database. Produce
outbreaks account for 13% of foodborne illness outbreaks and
21% of illnesses in the database. (Figure 1)
• Fifty percent of the produce outbreaks are caused by food from
restaurants and other food establishments. Private homes account
for 13% of produce outbreaks. Other locations for produce
outbreaks include the workplace, catered events, and schools.
(Figure 2)
• Between 1990 and 2005, produce outbreaks have an average of 48
illnesses per outbreak. Produce outbreaks cause more illnesses on
average than beef, poultry and seafood outbreaks. (Figure 3)
• Norovirus is the major cause of these outbreaks, accounting for
40% of all outbreaks. Salmonella is responsible for 18% of
produce outbreaks, while E. coli causes 8%. (Figure 4)
• The most common produce items associated with outbreaks are
greens-based salads, lettuce, potatoes, unspecified fruits and
sprouts. Produce items causing the most illnesses linked to
outbreaks are greens-based salads, berries, tomatoes, lettuce, and
sprouts.
RESULTS
• The main hazards associated with greens-based salad outbreaks
are Norovirus (64%), Salmonella (9%), and E. coli (7%). In
lettuce outbreaks the major hazards are Norovirus (47%), E. coli
(22%), and Salmonella (11%). Major hazards in potato outbreaks
are Salmonella (33%) and Staphylococcus (24%). In unspecified
fruit outbreaks, prominent hazards are Norovirus (67%) and
Salmonella (9%). In sprouts, the most common hazards are
Salmonella (80%) and E. coli (20%). (Figure 5)
• Norovirus and Salmonella are the two major pathogens in produce
and show up frequently on a variety of produce items. Norovirus
shows up most frequently on: greens-based salad, lettuce, and
unspecified fruits. Salmonella shows up most frequently on:
sprouts, greens-based salad, melon, potatoes. Mushrooms with
chemical/toxins were also a frequent contributor to produce
outbreaks. Finally, E. coli in green-based salad and lettuce
appeared regularly. (Table 1)
• Between 1998 and 2005, Norovirus is responsible for four of the
top five produce-pathogen combinations. The domination of
Norovirus as a major pathogen in recent years may be explained
by improved lab detection of Norovirus or by the increasing
prevalence of the virus worldwide. (Table 2)
CONCLUSIONS
In light of the frequency and size of produce-related outbreaks,
solutions are urgently needed to reduce the risk of foodborne illness
from produce. By identifying food/pathogen combinations
responsible for produce outbreaks, we can generate a hazard
analysis, which is the first step to identifying appropriate solutions.
The produce industry needs to implement a Hazards and Critical
Control Points (HACCP) based program to reduce the risk of
microbial contamination, using the Seafood HACCP program as a
model. Mandatory seafood HACCP utilized a preventative control
program for seafood processors in an industry with many small
companies. The Food and Drug Administration (FDA) should
establish a regulatory requirement that all produce growers and
processors develop a food safety plan and FDA should set
requirements for what should be in the plan. Finally, the agency
should publish a “Hazards and Controls Guide” outlining hazards in
different produce items using the outbreak data, and the best known
controls to prevent or reduce the risk. This Guide can be updated as
needed to reflect new science.
In order to build a solid risk-based approach to produce safety, we
must develop a hazard analysis for produce items, using outbreak
data on the most common produce items and pathogens, and data
from other sources.
NB: In 1998, the Centers for Disease Control enhanced outbreak surveillance efforts. The sharp
increase in outbreak numbers between 1997 and 1998 is likely due to the enhanced surveillance.
Outbreaks
Y
ea
r
2000
Illnesses
0
10
20
30
40
50
60
70
80
90
1990 1991 1992 1993 1994 1995 1996 1997 1998 1999 2000 2001 2002 2003 2004 2005
0
500
1000
1500
2500
3000
3500
4000
Outbreaks
Illnesses
FIGURE 1. YEARLY TRENDS IN PRODUCE OUTBREAK
S
FIGURE 2. PRODUCE OUTBREAK LOCATIONS
Catered Event
3%
Camp/Picnic/Farm
3%
Workplace
6%
Sick/Elderly/Youth
Services
3%
School
3%
Restaurant/Food
Establishment
50%
Religious/Social Club
3%
Private Home
13%
Othe
r
7%
Multiple Locations/Unknown
9%
9.9
27.4
30.4
47.8
0
10
20
30
40
50
60
Produce Poultry Bee
f
Seafood
Category
Average Cases
FIGURE 3. AVERAGE CASES PER OUTBREAK BY
FOOD CATEGORY 1990-2005
FIGURE 4. PATHOGENS IN PRODUCE
Norovirus
40%
Salmonella
18%
Other
14%
E. coli
8%
Clostridium
6%
Staphylococcus
3%
Bacillus
3%
Hepatitis A
4%
Shigella
4%
Vegetable Outbreaks
Bacillus
5%
Hepatitis A
5%
Cyclospora
2%
E. col
i
11%
Clostridium
12%
Othe
r
17%
Salmonella
21%
Campylobacte
r
2%
Norovirus
25%
Produce Dish Outbreaks
Campylobacte
r
4%
Staphylococcus
4%
Clostridium
4%
Bacillus
3%
Shigella
5%
E. coli
6%
Othe
r
11%
Salmonella
13%
Norovirus
50%
Fruit Outbreaks
Norovirus
40%
Staphylococcus
3%
Shigella
3%
E. coli
5%
Othe
r
7%
Hepatitis A
6%
Cyclospora
8%
Salmonella
28%
TABLE 1. MAJOR FOOD-PATHOGEN COMBINATIONS
CAUSING OUTBREAKS, 1990-2005
Rank Food Pathogen Outbreaks Illnesses
% Produce Outbreaks
1 Greens Salad Norovirus 144 5,353 20.2%
2 Lettuce Norovirus 30 1,025 4.2%
3 Sprouts Salmonella 24 1,875 3.4%
4 “Fruit” Norovirus 22 1,636 3.1%
5 Greens Salad Salmonella 20 1,033 2.8%
6 Melon Salmonella 16 1,137 2.2%
7 Mushrooms
Chemicals/Toxins
16 82 2.2%
8 Greens Salad E. coli 15 791 2.1%
9 Lettuce E. coli 14 382 2.0%
10 Potato Salmonella 14 206 2.0%
Source: Outbreak Alert! Center for Science in the Public Interest
,
2007
TABLE 2. MAJOR FOOD-PATHOGEN COMBINATIONS
CAUSING OUTBREAKS, 1998-2005
Rank Food Pathogen Outbreaks Illnesses
% Produce Outbreaks
1 Greens Salad Norovirus 139 5,139 24.6%
2 Lettuce Norovirus 29 949 5.1%
3 “Fruit” Norovirus 18 1,147 3.2%
4 Sprouts Salmonella 16 681 2.8%
5 “Vegetables” Norovirus 13 521 2.3%
6 Greens Salad Salmonella 12 519 2.1%
7 Fruit Salad Norovirus 12 355 2.1%
8 Tomato Salmonella 11 1,512 2.0%
9 Greens Salad E. coli 11 560 2.0%
10 Melon Salmonella 11 401 2.0%
Source: Outbreak Alert! Center for Science in the Public Interest
,
2007
FIGURE 5. PATHOGENS IN TOP PRODUCE VEHICLES
1990-2005
Norovirus
Norovirus
Norovirus
Salmonella
Salmonella
Salmonella
Salmonella
E.coli
E.coli
E.coli
Othe
r
Othe
r
Othe
r
Salmonella
Staphylococcus
Othe
r
0
50
100
150
200
Salad Lettuce Potato
"Fruit" Sprouts
Vehicles
Outbreaks
FIGURE 6. PATHOGENS IN TOP PRODUCE VEHICLES
1998-2005
Vehicles
Norovirus
Norovirus
Norovirus
Norovirus
Salmonella
Salmonella
E.coli
E.coli
Othe
r
Othe
r
Othe
r
Othe
r
Salmonella
Salmonella
Staphylococcus
Othe
r
0
20
40
60
80
100
120
140
160
180
200
Salad Lettuce Potato Salsa "Vegetables"
Outbreaks