Progress in Biomass and Bioenergy Production Part 2 pot
Bạn đang xem bản rút gọn của tài liệu. Xem và tải ngay bản đầy đủ của tài liệu tại đây (518 KB, 30 trang )
Scale-Up of a Cold Flow Model of FICFB Biomass Gasification
Process to an Industrial Pilot Plant – Example of Dynamic Similarity
19
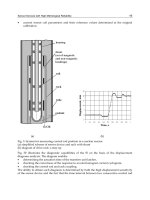
prove to be a successful construction for the reactor. With beds higher than 13 cm fluidized
beds are in aggregative or bubbling fluidization states. In turn, at bed heights over 30 cm even
a slugging state is attained. The solution at this point is a conical bed design in accordance
with Kaewklum and Kuprianov, 2008.
8. Symbols
A
p
Cross-section of
p
article [
m
2
]
A
t
Tube cross-sectio
n
[
m
2
]
B
c
y
c
Width of rectan
g
ular c
y
clone inlet dutch [m]
C
x
Dra
g
coefficient
D
c
y
c
Characteristic c
y
clone diameter [m]
D
comb
Riser diameter [mm]
D
g
as,1
Diameter of reactor u
pp
er se
g
ment [mm]
D
g
as,2
Diameter of reactor lower se
g
ment [mm]
D
p
Diameter of
p
article [
μ
m]
D
p
,50
Particle diameter at which 50% of
p
articles are collected b
y
c
y
clone [
μ
m]
D
tube
Inside tube diameter [mm]
F
g
_
p
Gravit
y
of
p
article [N]
g
Gravit
y
acceleration [9,81 m/s
2
]
g
c
Conversion factor [9,81
g
m m/s
2
wt]
H
comb
Riser hei
g
ht [mm]
i Natural number
j
Natural number
L Stationar
y
bed hei
g
ht [m]
L
m
f
Bed hei
g
ht at minimum fluidization conditio
n
[m]
L
mf
f
Bed hei
g
ht at minimum full
y
fluidized state [m]
N
s
Number of turns made b
y
g
as stream in a c
y
clone se
p
arator
p
Pressure [Pa]
p
g
,ar
Pressure at arbitrar
y
conditions [Pa]
p
i
Relative
p
ressure in
p
oint i [Pa]
p
i,
j
Differential
p
ressure between
p
oints i and
j
[Pa]
p
j
Relative
p
ressure in
p
oint
j
[Pa]
p
n
Pressure at normal conditions [Pa]
Re
p
Particle Re
y
nolds number
T
g
,ar
Tem
p
erature at arbitrar
y
conditions [°C]
T
n
Tem
p
erature at normal conditions [°C]
v
comb
Gas velocit
y
in riser [m/s]
v
g
Gas velocit
y
[m/s]
v
g,ref
Gas velocit
y
measured with pitot tube or orifice in tube before
g
as enterin
g
reactor
[m/s]
v
g
as
Gas velocit
y
in
g
asification zone [m/s]
v
m
f
Minimal fluidization velocit
y
[m/s]
v
mff
Minimal velocit
y
of full fluidizatio
n
[m/s]
v
t
Terminal velocit
y
[m/s]
Δ
p
differential
p
ressure [Pa]
Δ
p
m
f
differential
p
ressure at minimum fluidizatio
n
[Pa]
Δ
p
mff
differential
p
ressure at full fluidizatio
n
[Pa]
Progress in Biomass and Bioenergy Production
20
ε Bed voida
g
e
ε
m
f
Bed voida
g
e at minimum fluidizatio
n
ε
mf
f
Bed voida
g
e at full fluidizatio
n
η
g
D
y
namical viscosit
y
of
g
as [Pa·s]
η
g
,ar
D
y
namical viscosit
y
of
g
as at arbitrar
y
conditions [Pa·s]
η
n
D
y
namical viscosit
y
of
g
as at normal conditions [Pa·s]
ρ
g
Densit
y
of
g
as [k
g
/
m
3
]
ρ
p
Densit
y
of
p
article [k
g
/
m
3
]
Φ
m
Mass flow [k
g
/h]
Φ
m_
g
Mass flow of
g
as [k
g
/h]
Φ
V
Volume flow [
m
3
/h]
Φ
V_
g
Volume flow of
g
as [
m
3
/h]
9. Acknowledgements
10. References
Glicksman, L. R. (1982). Scaling Relationships For Fluidized Beds, Chemical engineering
science, 39, 1373-1384
Kaewklum, R. & Kuprianov, V. I. (2008). Theoretical And Experimental Study On Hydrodynamic
Characteristic Of Fluidization In Air-Sand Conical Beds, Chemical Engineering Science
63 1471-1479
Kaiser, S.; Löffler, G.; Bosch, K.; Hofbauer, H. (2003). Hydrodynamics of a Dual Fluidized Bed
Gasifier - Part Ii: Simulation of Solid Circulation Rate, Pressure Loop and Stability,
Chemical Engineering Science, 58, 4215 – 4223
Kunii, D. & Levenspiel, O.; (1991). Fluidization Engineering - Second edition, John Wiley &
Sons, inc.,
Löffler G., Kaiser S., Bosch K., Hofbauer H. (2003). Hydrodynamics of a Dual Fluidized - Bed
Gasifier - Part I : Simulation of a Riser With Gas Injection and Diffuser, Chemical
Engineering Science, 58, 4197 – 4213
Mele, J.; Oman, J.; Krope, J. (Jan. 2010). Scale-up of a cold flow model of FICFB biomass
gasification process to an industrial pilot plant - hydrodynamics of particles, WSEAS
transactions on fluid mechanics, vol. 5, iss. 1, str. 15-24.
Nicastro, M. T. & Glicksman, L. R. (1982). Experimental Verification of Scaling Relationships for
Fluidized Beds, Chemical engineering science, 39, 1373-1384
Oman J. (2005), Generatorji Toplote, University in Ljubljana, Faculty of mechanical
engineering, Ljubljana,
Oman, J.; Senegačnik, A.; Mirandola, A. (2006). Air, Fuels and Flue Gases: Physical Properties
and Combustion Constants, Edizioni Librerita Progeto, Padova, Italy
Perry, R. H. (1988). Perry’s Chemical Engineers Handbook (6th ed.), New York: McGraw Hill
International Ed.
Zabrodsky, S. S. (1966). Hydrodynamics And Heat Transfer In Fluidized Beds, The MIT press,
Cambrige
2
Second Law Analysis of Bubbling
Fluidized Bed Gasifier for Biomass Gasification
B. Fakhim and B. Farhanieh
School of Mechanical Engineering,
Division of Energy Conversion, Sharif University of Technology, Tehran,
Iran
1. Introduction
The management of refused derived fuel (RDF) is one of the most significant problems
especially for developing countries. Technologies to convert biomass energy already exist as
well. Gasification through a bubbling fluidized bed gasifier (BFBG) is discussed in this
context. A BFBG is able to deal with wide variety of fuels due to the presence of inert bed
material, in which bubbles mix turbulently under buoyancy force from a fluidizing agent
like air or oxygen [1]. Under such violent bed conditions biomass waste particles are able to
react fully to release volatiles as a result from high solids contact rate. Gases are released
from the biomass particles and can then be used for producing electricity. In the literature
there are several investigations on gasification processes from the thermodynamic point of
view. Altafini and Mirandola [2] presented a coal gasification model by means of chemical
equilibrium, minimizing the Gibbs free energy. The authors studied the effect of the
ultimate analysis and the gasifying agents/fuel ratio on the equilibrium temperature
(adiabatic case) in order to obtain the producer gas composition and the conversion
efficiency. They concluded that the equilibrium model fits the real process well. Similar
conclusions for biomass gasification are presented by the same authors [3], simulating the
gasifying process in a downdraft gasifier, where the object of study was the effect of the
biomass moisture content on the final gas composition assuming chemical equilibrium.
Lapuerta et al. [4] predicted the product gas composition as a function of the fuel/ air ratio
by means of an equilibrium model. A kinetic model was used to establish the freezing
temperature, which is used for equilibrium calculations in combination with the adiabatic
flame temperature. The biomass gasification process was modeled by Zainal et al. [5] based
on thermodynamic equilibrium. They analysed the influence of the moisture content and
reaction temperature on the product gas composition and its calorific value. Ruggiero and
Manfrida [6] emphasized the potential of the equilibrium model considering the Gibbs free
energy. This proceeding can be used under different operating conditions for predicting
producer gas composition and the corresponding heating value.
Many studies on the modeling of coal gasifers, in general, and coal gasification in bubbling
fluidized beds, in particular, can be found in the literature. Nevertheless, thermodynamic
modeling of the biomass gasification in bubbling fluidized beds has not been amply
addressed. A few articles on the modeling of biomass bubbling fluidized bed gasifiers
Progress in Biomass and Bioenergy Production
22
(BBFBGs) can be found in the literature. In modeling the biomass gasification (with air) in
bubbling fluidized beds (BFBG), Belleville and Capart [7] developed an empirical model
which was successfully applied to the biomass gasifier of Creusot Loire in Clamecy (France).
Fan and Walawender [8] and Van den Aarsen [9] reported two of the pioneering models,
which are well known today; Corella et al. [10] modeled some non-stationary states of
BFBBGs; Bilodeau et al. [11] considered axial variations of temperature and concentration
and applied their results to a 50 kg/h pilot gasifier; Jiang and Morey [12,13] introduced new
concepts in this modeling, especially related to the freeboard and the fuel feed rate; Hamel
and Krumm [14] provided interesting axial profiles of temperature, although their work was
mainly focused on gasification of coal and did not give many details of their model;
Mansaray et al. [15,16] presented two models using the ASPEN PLUS process simulator.
In this work the equilibrium modeling of BFBG has been applied for the biomass waste
gasification. The model employs equilibrium constants of all constituent reactions, in
addition, the effect of the fuel/air ratio, moisture content of the fuel and gasifying
temperature on the mole fraction of product gases of RDF gasification and corresponding
higher heating value of it. Moreover, the exergetic efficiency and cold gas efficiency of the
BFBG has been evaluated.
2. The model of the BFBG
2.1 Energy analysis
The idealized fluidized bed gasifier model is used with the following assumptions:
(i) The chemical equilibrium between gasifier products is reached, (ii) the ashes are not
considered and (iii) heat losses in the gasifier are neglected.
The global gasification reaction can be written as follows:
22 212232
42 5 4 62 72
(3.76)+++ →++
++ ++
abcde
CHONS wHO mO N nH nCO nCO
nHO nCH nN nHS
(1)
In which the
abcde
CHOSN is the substitution fuel formula which can be calculated by the
ultimate analysis of the fuel and the mass fractions of the carbon, hydrogen, oxygen,
nitrogen and sulphur. “m” and “w” are the molar quantity of air entering the gasifier and
moisture molar fraction in the fuel, respectively. The variable “m” corresponds to the molar
quantity of air used during the gasifying process which is entering the BFBG at the
temperature of 120
o
C and the pressure of 45 bar and depends on the gasification relative
fuel/air ratio and the stoichiometric fuel/air ratio relating to the biomass waste as a fuel[17]
1
r
g
st
m
FF
=
(2)
And w is determined from the moisture content of the fuel
2
(1 )
w
BM
HO
M
M
φ
φ
=
−
(3)
On the right-hand side, n
i
are the numbers of mole of the species i that are unknown.
In a fluidized bed gasifier, nearly the entire sulfur in the feed is converted to H2S, which
must be effectively removed to ensure that the sulfur content of the final gas is within
Second Law Analysis of Bubbling Fluidized Bed Gasifier for Biomass Gasification
23
acceptable limits. In the case of fluidized bed gasifiers, limestone can be fed into the gasifier
along with coal to capture most of the H
2S produced within the bed itself. The limestone
(CaCO
3) calcines inside the gasifier to produce lime (CaO), which in turn is converted to
calcium sulfide (CaS) upon reaction with the H
2S inside the gasifier.
32
CaCO CaO CO→+ (4)
22
CaO H S CaS H O+→+ (5)
The substitution fuel formula
abcde
CHOSN can be calculated Starting from the ultimate
analysis of the biomass waste and the mass fractions of the carbon, hydrogen, oxygen,
nitrogen and sulphur (C, H, O, N, S), assuming a= 1, with the following expressions:
,, ,
CC CC
H
ONS
HM OM NM SM
bcde
CM CM CM CM
====
(6)
Ultimate analysis of the biomass waste (RDF) used in this model is shown in Table 1.
Waste
Fuel
C% H% O% N% S% Ash HHV(MJ/Kg)
RDF 44.7 6.21 38.6 0.69 0.00 10.4 19.495
Table 1. Ultimate analysis of RDF (dry basis, weight Percentage) [18]
From the substitution fuel formula, the specific molecular weight of the biomass waste, the
molar quantity of water per mole of biomass waste, the stoichiometric fuel/air ratio and the
formation enthalpy of the biomass waste can be calculated.
Now for calculating the molar quantity of the product gases 7 equations are needed:
From the molar biomass waste composition
abcde
CHOSN and the molar moisture quantity, the
atomic balances for C, H, O, N and S are obtained, respectively
235
:Ca n n n=++
145
:2 2 2 4Hb w n n n+=+ +
234
:22Ocw m n n n++ = + + (7)
6
: 2 3.76 2
N
dm n+× =
7
:Se n=
There are now only 5 equations to calculate 7variables. To solve the system, two other
equations should be added. From the first assumption, two equations in equilibrium can be
used. Chemical equilibrium is usually explained either by minimization of Gibbs free energy
Progress in Biomass and Bioenergy Production
24
or by using an equilibrium constant. To minimize the Gibbs free energy, constrained
optimization methods are often used which requires a realizing of complex mathematical
theories. For that reason, the present thermodynamic model is developed based on the
equilibrium constant. Therefore, the remaining two equations were obtained from the
equilibrium constant of the reactions occurring in the gasification zone as shown below:
In the reduction zone of the gasifier, hydrogen is reduced to methane by carbon
(methanation reaction).
24
2CH CH+↔ (8)
Methane formation is preferred especially when the gasification products are to be used as a
feedstock for other chemical process. It is also preferred in IGCC applications due to
methane’s high heating value.
The equilibrium constant
1
K relates the partial pressures of the reaction as follows:
4
2
1
(/)
(/ )
CH total
H total
PP
k
PP
=
(9)
Or as a function of the molar composition, assuming the behavior of the product gas to be
ideal,
1
5
2
1
total
k
nn
n
=
×
(10)
The second reaction, also known as the water gas shift reaction, describes the equilibrium
between CO and H
2 in the presence of water
222
CO H O CO H+↔+
(11)
The heating value of hydrogen is higher than that of carbon monoxide. Therefore, the
reduction of steam by carbon monoxide to produce hydrogen is a highly desirable reaction.
The corresponding equilibrium K
2 constant is obtained as follows:
22
2
2
(/)(/)
(/ )( / )
CO total H total
CO total H O total
PP PP
k
PP P P
=
(12)
Or as a function of the molar composition of the gas
13
2
24
nn
k
nn
=
(13)
The values of the equilibrium constants K1 and K2 are calculated from the Gibbs free energy
()
0
exp /
pTu
K
GRT=−Δ
(14)
Where
0
T
GΔ is the difference of the Gibbs free energy between the products and the reactants:
Second Law Analysis of Bubbling Fluidized Bed Gasifier for Biomass Gasification
25
00 0
T
GHTSΔ=Δ−Δ
(15)
Substituting the Gibbs free energy in Eqs. (5) and (8), the equilibrium constants are obtained
as
()()
42
00
1,,
exp 2 /
TCH TH u
K
GGRT=− −
(16)
()()
22 2
00 00
2,,,,
exp /
TH TCO TCO THO u
K
GG GG RT=− + − − (17)
With
()
00 0
,,298
298
T
Ti f p
Gh CTdTTs=Δ + −
(18)
Where
()
p
CT is the specific heat at constant pressure in (J/mol K) and is a function of
temperature. It can be defined by empirical equation below.
23
()
p
CT A BT CT DT=+ + +
In which the coefficients are obtained from the table 2
23
()
p
CT A BT CT DT=+ + +
(J/mol K)
compound
A
2
10B ×
5
10C ×
8
10D ×
2
H
29.062 -0.82 0.199 0.0
2
O
25.594 13.251 -0.421 0.0
CO
26.537 7.683 -0.1172 0.0
2
CO
26.748 42.258 -1.425 0.0
4
CH
25.36 1.687 7.131 -4.084
Table 2. Heat capacity of an ideal gas[19]
Gasifying temperature
For calculating K
1 and K2, the temperature in the gasification or reduction zone must be
known. It should be noted that in bubbling fluidized bed the bed, temperature will be in the
range of 900-1200
o
K by which the equilibrium constants will be calculated.
Enthalpy definition
After defining the corresponding equations, Because of nonlinear nature of some of the
equations the Newton-Raphson method has been used to calculate the values n
1
-n
7
.
The enthalpy of the product gas is
Progress in Biomass and Bioenergy Production
26
()
0
,,ifi Ti
iprod
hxhh
=
=+Δ
(19)
where xi is mole fraction of species i in the ideal gas mixture and
0
f
h is the enthalpy of
formation and
T
hΔ
represents the enthalpy difference between any given state and at
reference state. It can be approximated by
298
()
T
Tp
hCtdTΔ=
(20)
Table 3 shows some the value of
0
f
h for some gas components.
Compound
0
f
h (kJ/mol)
2
H
0.0
2
O
0.0
CO
-110.52
2
CO
-393.51
4
CH
-74.85
2
()HOl
-285.84
2
H S
-20.501[21]
2
SO
-296.833[21]
Table 3. Enthalpy of formation at the reference state [20]
It should be noted that enthalpy of formation for solid fuel can be calculated as:
,
,
1
f
i
fbm db i
iprod
bm
h HHV h
M
ν
=
=+
(21)
Where
()
0
f
k
h is the enthalpy of formation of the product k under the complete combustion of
the solid and
HHV is the higher heating value of the solid fuel.
Heat of formation of any biomass waste material can be calculated with good accuracy from
the following equation[22]:
( / ) 0.2326(146.58 56.878 51.53 6.58 29.45)
C
H HHV KJ Kmol C H O AΔ= = + − − + (22)
Where C, H, O and A are the mass fractions of carbon, hydrogen, oxygen and Ash,
respectively in the dry biomass waste.
Second Law Analysis of Bubbling Fluidized Bed Gasifier for Biomass Gasification
27
2.2 Exergy analysis
The entropy of ideal gas is represented by:
0
0
ln
T
p
To
C
P
SS dTR
TP
=+ −
(23)
Where P is the pressure of the bubbling fluidized bed gasifier, and
0
S is entropy at reference
state. Table 4 shows some components
0
S
Compound
0
S (J/molK)
2
H
130.59
2
O
205.03
CO
197.91
2
CO
213.64
4
CH
186.19
2
()
H
Ol
69.94
2
H S
205.757[21]
2
SO
284.094[21]
Table 4. Entropy at the reference state(at T
ref
=298.15K(25
0
C),p
ref
=1 bar) [20]
The exergy of the product gas is comprised of two components: Exergy chemical exergy
()
CH
E
and physical exergy
()
PH
E
.Total exergy of the product gas is given as
P
HCH
pg
E
EE=+
(24)
The physical exergy is the maximum theoretical work obtainable as the system( here the
product gas) passes from its initial state where the temperature is the gasifying temperature
and the pressure equals the gasifier pressure to the restricted dead state where the
temperature is T
0
and the pressure is P
0
and is given by the expression
0
()()
PH
oo
E
HH TSS=− − −
(25)
The physical exergy of gas mixture per mole is derived from the conventional linear mixing
rule
P
HPH
ii
exe=
(26)
Progress in Biomass and Bioenergy Production
28
The chemical exergy is the maximum theoretical useful work obtainable as the system
passes from the restricted dead state to the dead state where it is in complete equilibrium
with the environment.
And chemical exergy of gas mixture is given by
0, 0
ln
CH CH
ii i i
ii
exRTxx
ε
=+
(27)
Where
,
C
H
oi
ε
is the standard chemical exergy of a pure chemical compound i which is
available in Table 5 for some gas components.
Substance
0,
(/ )
CH
i
kJ kmol
ε
2
H
238490
CO
275430
2
CO
20140
2
()
H
Og
11710
4
CH
836510
2
N
720
2
H S
812000[21]
2
SO
313.4[21]
Table 5. Standard chemical exergy of some substances at 298.15K and p
0
[21]
Special considerations apply for the gasifying products when evaluating the chemical and
physical exergy. When a product gas mixture is brought to P
0
, T
0,
some
consideration would
occur: At 25
o
C, 1 atm, the mixture consists of
2242
,,,,
H
CO CO CH N , together with saturated
water vapor in equilibrium with saturated liquid. So it would be required to calculate the
new composition at the dead state including the saturated liquid. Then the
o
h and
o
s
values
required to evaluate the physical exergy and the product gas mole fraction at the dead state
essential for evaluating the chemical exergy can be calculated.
The exergy components and the total exergy for the moisture content of the fuel is obtained
2()
00
,0
()
l
PH
mois f liq H O
EwhhTss=−−−
(28)
2()
0,
L
CH CH
mois H O
Ew
ε
=× (29)
CH PH
mois mois mois
EEE=+
(30)
Second Law Analysis of Bubbling Fluidized Bed Gasifier for Biomass Gasification
29
Exergy for the fluidizing air entering the fluidized bed is defined with molar analysis of
0.21% O
2
and 0.79% N
2
with the pressure of 45 bar and the temperature of 373
0
K
, by using
equations 25 and 26
CH PH
air air air
EEE=+ (31)
For a biomass waste the chemical exergy is obtained as follows
0,biomass biomass
HHV
εβ
=
(32)
The factor
β
is the ratio of the chemical exergy to the HHV of the organic fraction of
biomass waste. This factor is calculated with the following correlation [18]:
[]
1.0412 0.216( / ) 0.2499 / 1 0.7884 / 0.045 /
1 0.3035 /
HC OC HC Nc
OC
Z
ZZZ ZZZZ
ZZ
β
+− + +
=
−
(33)
,,
OCH
Z
ZZ
and
N
Z
are the weight fractions of oxygen, Carbon, Hydrogen and Nitrogen,
respectively in the biomass waste.
Therefore the total exergy of the biomass waste as a fuel can be defined:
0,
f
uel biomass fuel
En
ε
=× (34)
2.3 Heating value and efficiencies
2.3.1 Heating value
The heating value of the producer gas can be obtained as the sum of the products of the
molar fractions of each of the energetic gases (CO, H
2
and CH
4
) with its corresponding
heating value (Table 6).
LHV (MJ/kg mol) HHV (MJ/kg mol) gas
282.99 282.99 CO
241.83 285.84 H
2
802.34 890.36 CH
4
518.59 562.59 H
2
S
Table 6. Heating value of combustible gases
2.3.1 Evaluation of the efficiency
It is assumed that the fluidized bed gasifier operates as adiabatic and pseudo-homogeneous
reactor at atmospheric pressure.
Gasification entails partial oxidation of the feedstock, so chemical energy of biomass waste
is converted into chemical and thermal energy of product gas.
The first law thermodynamic or cold gas efficiency can be defined as the relation between
the energy leaving the gasifier i.e. the energy content of the producer gas, and the energy
Progress in Biomass and Bioenergy Production
30
entering the gasifier, i.e. the biomass waste and moisture. We assume the gas leaves the
process at the reference temperature (25
o
C), loosing the energy corresponding to its sensible
enthalpy, and define the cold gas efficiency
Cg
η
as
gas
biomass
Cg
HHV
HHV
η
= (35)
Where HHV
gas and HHVbiomass are the net heats of combustion (lower heating values) of gas
and biomass waste, respectively.
The exergetic efficiency may be defined as the ratio between chemical exergy as well as
physical exergy of product gas and the total exergy of the entering streams i.e. the biomass
waste and the moisture and fluidizing air.
pg
out
in air mois fuel
Ex
E
E
EEE E
η
==
++
(36)
In this work variations of the exergy efficiency, cold gas efficiency and product gas
concentration will be investigated as a function of temperature, gasifying fuel/air ratio (F
rg
),
and moisture content of the fuel (φ).
3. Results and discussion
3.1 Validation of the model
The model presented in this article has been compared to the experimental work for the
wood particles
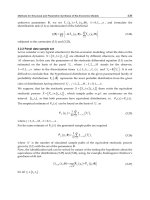
presented by Narvaez et al. [23]. By way of illustration the predicted HHV
producer gas by the model and the results from the experiments are presented in Figure 1.
Temperature (
o
K)
HHV(MJ/Nm
3
)
600 700 800 900 1000 1100 1200 1300 1400
2
2.5
3
3.5
4
4.5
5
5.5
6
Model
Narvaez et al. 1996
Fig. 1. Higher heating values of product gas at different temperatures for wood particles
Second Law Analysis of Bubbling Fluidized Bed Gasifier for Biomass Gasification
31
3.2 Sensitivity analyses
The effect of F
rg
on product gas composition and higher heating value for RDF gasification
is presented in Figure 2. An increase in F
rg
brings about an increase in the concentration of
H
2
and CO and a substantial decrease in CO
2
concentration in dry gas product. This is
because of the decreasing role of the char combustion in the bed compared to its
gasification reaction, which results in higher concentration of combustible gases and
lower CO
2
.
Frg
RDF Product Gas Concentration(Mol%)
HHV(MJ/Nm
3
)
1.5 2 2.5 3 3.5 4 4.5
0
10
20
30
40
50
4
5
6
7
H
2
CO
2
CO
H
2
O
CH
4
N
2
HHV
Fig. 2. Concentration of product gases and higher heating value at different F
rg
values and
T
bed
= 1100°K.
The effect of moisture content of the fuel on product gas composition and higher heating
value for RDF gasification is presented in Figure 3. As shown in the figure, an increase in
moisture content brings about an increase in the concentration of H
2
and CH
4
and
decrease in the concentration of CO. This is because of the increasing role of the moisture
content of the fuel and effect of the methanation reaction (equation8) and the water-gas
shift reaction (equation11) in which the molar concentration of the CO decreases because
of the reaction with H
2
O and production of H
2, ‘
and resulting an increase in the molar
quantity of CH
4
. Therefore the higher heating value will decrease as the moisture content
increases.
The effect of gasifying temperature on product gas composition is shown in Figure 4. The
figure shows that an increase in temperature brings about an increase in the concentration of
H
2
and CO of RDF. This is because of the increasing role of the temperature in the
equilibrium constants (16), (17) in which the equilibrium constant is dependent on the BFBG
temperature, so an increase in temperature causes more production of combustible gases.
The higher heating value in this temperature range at the constant Frg is to some extent
constant that is valid according to experimental works [22].
Progress in Biomass and Bioenergy Production
32
φ(%)
RDF Product Gas Concentration(Mol%)
HHV(MJ/Nm
3
)
10 20 30 40 50
0
5
10
15
20
25
30
35
5.5
6
6.5
7
7.5
H
2
CO
2
CO
H
2
O
CH
4
N
2
HHV
Fig. 3. Concentration of product gases and higher heating value at different moisture
content of the fuel at T
bed
= 1100°K and F
rg
=3.
T
bed
(
o
K)
RDF Product Gas Concentration(Mol%)
HHV(MJ/Nm
3
)
900 1000 1100 1200 1300
0
5
10
15
20
25
30
35
5.4
5.6
5.8
6
6.2
6.4
6.6
6.8
7
H
2
CO
2
CO
H
2
O
CH
4
N
2
HHV
Fig. 4. Concentration of product gases and higher heating value at various gasifying
temperatures at F
rg
=3
Second Law Analysis of Bubbling Fluidized Bed Gasifier for Biomass Gasification
33
The effect of F
rg
with moisture content of the fuel on exergetic efficiency and cold gas
efficiency for RDF gasification are presented (by line & flood contour type) in Figures 5, 6. It
is shown that the exergetic efficiency of BFBG increases with rising fuel/air ratio because
when less air is admitted to the process, the variations in mole fractions of product gases
will influence the exergy of the product in comparison to exergy of the fuel. Higher moisture
content will increase the exergetic efficiency because of its considerable effect on enthalpy of
the product gases (figure5). An increase in F
rg
, as discussed before, brings about an increase
in the concentration of combustible gases and higher heating value which yields an increase
in cold gas efficiency and an increase in moisture content of the fuel, as discussed before,
causes decrease in the concentration of combustible gases and higher heating value which
yields a decrease in the cold gas efficiency (figure6).
5
0
5
5
5
5
6
0
6
0
6
5
6
5
7
0
7
0
7
5
7
5
8
0
80
8
5
8
5
9
0
9
0
Frg
φ(%)
1 2 3 4 5
0.1
0.2
0.3
0.4
η
Ex
(%)
90
85
80
75
70
65
60
55
50
Fig. 5. Exergetic efficiency of the gasifying process as a function of the gasifying relative
fuel/air ratio and the moisture content
The effect of F
rg
and the bed temperature on exergetic efficiency and cold gas efficiency for
RDF gasification are presented (by line & flood contour type) in Figures 7, 8. It is shown that
the exergetic efficiency of BFG increases with rising fuel/air ratio as discussed for figures 5
and6. Higher temperature will increase the exergetic efficiency because of its considerable
effect on enthalpy of the product gases (figure7). An increase in bed temperature, as
discussed for figure 4, brings about an increase in the concentration of combustible gases
and higher heating value which yields an increase in cold gas efficiency (figure8)
Progress in Biomass and Bioenergy Production
34
Frg
φ(%)
1 2 3 4 5
0.1
0.2
0.3
0.4
η
Cg
(%)
100
95
90
85
80
75
70
65
60
55
50
45
40
Fig. 6. Cold gas efficiency efficiency of the FBG as a function of the gasifying relative
fuel/air ratio and the moisture content
66
7
0
7
0
7
4
7
4
7
4
7
8
7
8
7
8
8
2
8
2
8
2
8
6
86
8
6
9
0
9
0
9
4
Frg
T
bed
(
o
K)
1.5 2 2.5 3 3.5 4 4.5
800
900
1000
1100
1200
1300
η
Ex
(%)
94
90
86
82
78
74
70
66
62
58
Fig. 7. Exergetic efficiency of the gasifying process as a function of the gasifying relative
fuel/air ratio and the gasifying temperature
Second Law Analysis of Bubbling Fluidized Bed Gasifier for Biomass Gasification
35
Frg
T
bed
(
o
K)
1.5 2 2.5 3 3.5 4 4.5
800
900
1000
1100
1200
1300
η
Cg
(%)
100
95
90
85
80
75
70
65
60
55
Fig. 8. Cold gas efficiency of the FBG as a function of the gasifying relative fuel/air ratio and
the bed temperature
4. Conclusion
An equilibrium model was developed for the biomass waste gasification in the bubbling
fluidized bed waste gasification. It was shown that higher moisture would decrease the
product gas higher heating value as well as cold gas efficiency while increase the exergetic
efficiency. Moreover, It was concluded that higher temperature and higher F
rg
would
increase both the product gas higher heating value, cold gas efficiency and the exergetic
efficiency.
5. Nomenclature
C
mass fraction of carbon
H
mass fraction of hydrogen
rg
F
gasification relative fuel/air ratio
s
t
F
stoichiometric biomass waste/air ratio
M
molecular weight (kg/mol)
B
M
M
biomass waste molecular weight (kg/mol)
Progress in Biomass and Bioenergy Production
36
N
mass fraction of nitrojen
m
molar quantity of air
w
molar quantity of biomass waste moisture
content
p
g
E
Product gas total Exergy
P
H
E
physical Exergy
CH
E
chemical Ecergy
0
T
GΔ
gibbs free Energy((kJ/mol)
O mass fraction of oxygen
HHV
db
higher heating value in dry base
P pressure
S
0
standard Entropy(KJ/mol K)
S mass fraction of sulphur
T temperature
Greek symbols
φ
moisture content of the biomass waste fuel
E
x
η
Gasifier exergetic efficiency
Cg
η
Cold gas efficiency
6. References
[1] Basu, P., Combustion and gasification in fluidized beds, Taylor & Fransis, 2006
[2] Altafini CR, Mirandola A, A chemical equilibrium model of the coal gasification process
based on the minimization of the Gibbs free energy. In: Flowers 97, Florence, Italy,
1997.
[3] Altafini CR, Wander PR, Barreto RM. Prediction of working parameters of a wood
waste gasifier through an equilibrium model. Energy Convers Manage
2003;44:2763–77.
[4] Lapuerta M, Herna´ndez J, Tinaut FV, Horillo A. Thermochemical behaviour of producer
gas from gasification of lignocellulosic biomass in SI engines. SAE Paper series
2001-01-3586, 2001.
[5] Zainal ZA, Ali R, Lean CH, Seetharamu KN, Prediction of performance of a
downdraft gasifier using equilibrium modeling for different biomass materials.
Second Law Analysis of Bubbling Fluidized Bed Gasifier for Biomass Gasification
37
Energy Convers Manage 2001;42:1499–515. [6] Ruggiero M, Manfrida G. An
equilibrium model for biomass gasification processes. Renew Energy
1999;16:1106–9.
[7] P. Belleville, R. Capart, A model for predicting outlet gas concentration from a wood
gasifier, in: A.V. Bridgwater (Ed.), Thermochemical Processing of Biomass,
Butterworks, London, UK, 1983,pp. 217– 228.
[8] C.C. Chang, L.T. Fan, W.P. Walawender, Dynamic modeling of biomass gasification in a
fluidized bed, AICHE Symposium Series 80 (234) (1984) 80–90.
[9] F.G. Van den Aarsen, Fluidized bed wood gasifier performance and modeling. PhD
thesis, Univ. of Twente (NL), 1985.
[10] J. Corella, F.J. Alday, J. Herguido, A model for the non-stationary states of a commercial
fluidized bed air gasifier of biomass, in: G. Grassi, et al., (Eds.), Biomass for Energy
and Industry, vol. 2, Elsevier, London, 1990, pp. 2804– 2809.
[11] J F. Bilodeau, N. The´rien, P. Proulx, S. Czernik, E. Chornet, A mathematical model of
fluidized bed biomass gasification, The Canadian Journal of Chemical Engineering
71 (1993) 549.
[12] H. Jiang, R.V. Morey, Pyrolysis of corncobs at fluidization, Biomass and Bioenergy 3
(1992) 81.
[13] H. Jiang, R.V. Morey, A numerical model of fluidized bed biomass gasifier, Biomass and
Bioenergy 3 (1992) 431.
[14] S. Hamel, W. Krumm, Modelling and simulation of bubbling fluidized bed gasification
reactors, Proceed. Of 3rd European Conference on Fluidization, Toulouse, France,
(2000), 29–31 May, 2000, pp. 519–527.
[15] K.G. Mansaray, A.M. Al-Taweel, A.E. Ghaly, F. Hamdullahpur, V.I. Ugursal,
Mathematical modeling of a fluidized bed rice husk gasifier: Part I—Model
development, Energy Sources 22 (2000) 83.
[16] ] K.G. Mansaray, A.M. Al-Taweel, A.E. Ghaly, F. Hamdullahpur, V.I. Ugursal,
Mathematical modeling of a fluidized bed rice husk gasifier: Part II—Model
sensitivity, Energy Sources 22 (2000) 167.
[17]Andre´s Melgar , Juan F. Pe´rez , Hannes Laget , Alfonso Horillo, Thermochemical
equilibrium modelling of a gasifying process, Energy Conversion and Management
48 (2007) 59–67
[18] Krzysztof J. Ptasinski, Mark J. Prins, Anke Pierik, Exergetic evaluation of biomass
gasification , Energy, Vol. 32, pp.568-574, 2007
[19] S. Jarungthammachote, A. Dutta, Thermodynamic equilibrium model and second law
analysis of a downdraft waste gasifier, Energy 32 (2007) 1660–1669
[20] Yunus Cengel, Boles, Thermodynamics An Engineering Approach, 1999
[21] Adrian Bijan, G. Tsatsaronis, Thermal Design and Optimization, 1996 by John Wiley &
Sons.
[22] Channiwala SA, Parikh PP., A unified correlation for estimating HHV of solid, liquid
and gaseous fuels, Fuel, Vol. 81, pp.1051-63, 2007
[23] Narvaez I, Orio A, Aznar MP, Corella J.,Biomass gasification with air in an atmospheric
bubbling fluidized bed. Effect of six operationa variables on the quality of the
produced raw gas, Ind Eng Chem Re,Vol 35, pp.2110-2120, 1996.
Progress in Biomass and Bioenergy Production
38
[24] Bubbling fluidized bed biomass gasification—Performance, process findings and energy
analysis, Renewable Energy 33 (2008) 2339–2343
3
Thermal Plasma
Gasification of Biomass
Milan Hrabovsky
Institute of Plasma Physics ASCR
Czech Republic
1. Introduction
Since the 1980s applications of thermal plasmas experienced an important increase. In the
1990s fundamental research led to great progress in the understanding of the basic
phenomena involved, and to a renewed interest in applying thermal plasmas to material
processing and waste treatment. The application of plasma torches for environmental
purposes is a relatively new process. Thermal plasma offers unique capability of carrying
extremely high energy by small amount of plasma and ensures high heat transfer rates to
treated materials. All materials can be decomposed if they are brought into contact with
plasma.
Generators of thermal plasma (plasma torches) operate simultaneously as a plasma-
chemical and a thermal apparatus. The electrical energy of the torches goes into the plasma
which transfers its energy to the substances to be treated, thereby triggering a dual
simultaneous reaction process in the plasmachemical reactor: the organic compounds are
thermally decomposed into their constituent elements (syngas with more complete
conversion of carbon into gas phase than in incinerators), and the inorganic materials are
melted and converted into a dense, inert, non-leachable vitrified slag, that does not require
controlled disposal. Therefore, it can be viewed as a totally closed treatment system.
While decomposition of waste and dangerous materials in thermal plasmas has been
intensively studied in the last decade and industrial scale systems for treatment of various
types of waste has been installed, plasma gasification of biomass is newly appearing
application. For this application, the principal goal of the technology is production of fuel
gases, principally mixture of carbon monoxide and hydrogen, called syngas. Thermal
plasma offers possibility of decomposition of biomass by pure pyrolysis in the absence of
oxygen, or with steichiometric amount of oxygen (gasification) to produce high quality
syngas, with high content of carbon monoxide and hydrogen and minimum presence of
other components. As production of fuel gas is the main goal of the technology, an energy
balance of the process is thus much more important than in case of waste treatment, where
the principal goal is material decomposition.
Gasification is a process by which either a solid or liquid carbonaceous material, containing
mostly chemically bound carbon, hydrogen, oxygen, is reacted with air or oxygen. The
reactions provide sufficient exothermic energy to produce a primary gaseous product
containing mostly CO, H
2
, CO
2
, H
2
O(g), and small content of higher hydrocarbons. Heat
Progress in Biomass and Bioenergy Production
40
from external sources is usually supplied into the reactor to control the process and the
reaction temperature, but most of heat for realization of the reaction usually comes from
calorific value of biomass. In case when thermal decomposition of biomass is realized under
the action of externally supplied heat and without any oxidant, we speak about pyrolysis.
Especially pyrolysis is particularly well adapted to the valorization of lignocellulosic
products such as wood or straw with good control of parameters of the process (gas
composition, formation of tar) to maximize the production of hydrogen or syngas.
Principal problem of common biomass gasification technologies, based on the reaction
between a heated carbon source with limited amounts of oxygen, consists in production of
tar, which is formed from complex molecules of hydrocarbons created during the process.
The gas from low temperature gasification typically contains only 50% of the energy in
syngas components CO and H
2
, while the remainder is contained in CH
4
and higher
aromatic hydrocarbons [Boerrigter 2005]. Moreover, the syngas is diluted by CO
2
produced by partial oxidation process. The possibility of control of syngas composition in
classical technologies is limited. The necessity of production of clean syngas with
controlled composition leads to technologies based on external energy supply for material
gasification.
Plasma pyrolysis and gasification for production of syngas is an alternative to conventional
methods of biomass treatment. Plasma is a medium with the highest energy content and
thus substantial lower plasma flow rates are needed to supply sufficient energy compared
with other media used for this purpose. This results in minimum contamination and
dilution of produced syngas by plasma gas and easy control of syngas composition. The
process acts also as energy storage – electrical energy is transferred into plasma energy and
then stored in produced syngas. The main advantages are better control of composition of
produced gas, higher calorific value of the gas and reduction of unwanted contaminants like
tar, CO
2
, CH
4
and higher hydrocarbons. The other advantage of plasma is wide choice of
treated materials. As energy for the process is supplied by plasma and chemical reactions in
the reaction products are not primary source of energy, the process can be applied for wide
choice of organic materials and biomass. For evaluation of technical and economic
feasibility of plasma treatment these advantages must be taken into account together with
higher energy consumption of plasma technology.
Plasma treatment offers better control of process temperature, higher process rates, lower
reaction volume and especially optimum composition of produced syngas. Plasma pyrolysis
or gasification exploits the thermochemical properties of plasma. The particles kinetic
energy in the form of heat is used for decomposing biomass. In addition, the presence of
charged and excited species renders the plasma environment highly reactive which can
catalyses homogeneous and heterogeneous chemical reactions. The main advantage of
plasma follows from much higher enthalpy and temperature of plasmas compared to the
ones of gases used in conventional methods. Thus, substantially lower plasma flow rates can
carry sufficient energy for the process and composition of produced syngas is not much
influenced by plasma gas composition and moreover, substantially less energy is consumed
to heating of plasma to reaction temperature. These advantages are especially noticeable in
case of plasma generated in water stabilized plasma torches, which are characterized by
extremely high enthalpies and low plasma mass flow rates. Compared to non-plasma
methods the advantages of plasma gasification can be summarized as follows:
- Energy for gasification is supplied by plasma rather than energy liberated from
combustion and thus it is independent of the treated substances, providing flexibility,
Thermal Plasma Gasification of Biomass
41
fast process control, and more options in process chemistry. Broad range of biomass
feedstock, incl. biodegradable fraction of waste, can be thus gasified.
- No combustion gases generated in conventional autothermal reactors are produced.
- The temperature in the reactor can be easily controlled by control of plasma power and
material feed rate.
- As sufficiently high temperatures and homogeneous temperature distribution can be
easily maintained in the whole reactor volume, production of higher hydrocarbons, tars
and other complex molecules is substantially reduced.
- High energy density and high heat transfer efficiency can be achieved, allowing shorter
residence times and large throughputs.
- Highly reactive environment and easy control of composition of reaction products.
- Low thermal inertia and easy feedback control.
- Much lower plasma gas input per unit heating power than the gas flow of classical
reactors and thus lower energy loss corresponding to the energy necessary for heating of
plasma to reaction temperature; also lower amount of gases diluting produced syngas.
- Smaller plants than for conventional reactors due to high energy densities, lower gas
flows, and volume reduction.
2. Thermodynamic analysis of plasma gasification of biomass
Principally all carbon and hydrogen atoms from biomass can be used for syngas production
if biomass is heated to sufficiently high temperature. Maximum biomass to syngas
conversion efficiency is achieved if all carbon is oxidized to CO. As most of biomass
materials contain more carbon atoms than oxygen atoms, some oxygen has to be added to
gasify all carbon. This can be done by addition of oxygen, air, steam or CO
2
.
For the energy balance analysis, following three processes are taken into account:
a. Gasification with addition of steichiometric amount of O
2
()
2
22
2
CO
CH
nn
biomass O n CO n H
−
+ + (1)
b. Gasification with steichiometric amount of steam
()
()
22
2
CO C CO
H
biomass n n H O n CO n n n H+− ++− (2)
c. Gasification with steichiometric amount of CO
2
()( )
2
22
2
CO CO H
biomass n n CO n n CO n H+− −+
(3)
where n
C
= c/M
C
, n
H2
= h/2M
H
and n
O
= o/M
O
are molar concentrations of carbon, hydrogen
and oxygen in biomass with mass fractions of carbon, hydrogen and oxygen equal to c, h
and o, respectively.
The power balance of the process can be written as
() () ()
()
out out out
r torch react r
g
as r sol r
p
l
p
lr
Q W P TQTQTQTT
η
Δ=− −−−≥ (4)
where
Δ
Q
r
is power available for gasification,
η
is efficiency and W
torch
power of the torch,
P
react
power loss to the reactor wall, Q
gas,
Q
sol
and Q
pl
are power losses carried out of the
Progress in Biomass and Bioenergy Production
42
reactor by produced gases, solids and plasma, respectively. These power losses are
dependent on temperature in the reactor
T
r
and the temperature of plasma gas leaving the
reactor
T
pl.
The temperature T
pl
is equal to T
r
if complete mixing and heat transfer from
plasma to treated material during residence time in the reactor is ensured.
The terms on the right hand side of equation (4) are determined by the torch power and its
efficiency, by the construction of plasma reactor and by the reaction temperature
T
r
. The
reaction temperature needed for biomass gasification can be determined from calculation of
temperature dependence of composition of products of reactions (1) – (3). Due to high
temperature in plasma reactor, we can assume that all reaction components in plasma
reactor are in thermodynamic equilibrium. Under this assumption we can calculate the
composition of reaction products from thermodynamic computations.
Fig. 1 presents the temperature dependence of composition of system containing mass
fractions of carbon, hydrogen and oxygen corresponding to fir wood. The equilibrium
composition of this heterogeneous system was calculated using the method described in
[Coufal 1994], the input data for calculations of standard reaction enthalpy and standard
thermodynamic functions of system components were taken from database [Coufal 2005]. It
can be seen that wood is decomposed into hydrogen, carbon monoxide and solid carbon
with small amount of other components at temperatures above 1 200 K. The presence of
solid carbon, which in gasification reactors leads to formation of char, can be suppressed by
addition of gas containing oxygen. To maintain high concentrations of CO and H
2
in the
produced gas, it is advantages to use oxygen, carbon dioxide or steam as oxidizing media.
Dry Wood (res1)
0
0,2
0,4
0,6
0,8
1
300 800 1300 1800 2300 2800
Temperature (K)
Mol Fraction [mol/g]
CO
H
2
C
sol.
H
2
O
CO
2
CH
4
HC
2
H
2
Fig. 1. Composition of products of wood pyrolysis. The mass ratios of components in wood:
carbon
c = 0.511 , hydrogen h = 0.064 , oxygen o = 0,425
Fig. 2 shows the composition of products of gasification of wood with addition of CO
2
and
oxygen. The components considered in the computation correspond to the experimental
Thermal Plasma Gasification of Biomass
43
conditions described in the paragraph 4. Mixture of oxygen and carbon dioxide was used as
an oxidizing medium for gasification of fir wood, the atmosphere in the reactor contained
also steam plasma with small amount of argon supplied into the reactor by plasma torch. It
can be seen that composition of produced syngas changed substantially due to the addition
of other components. It can be seen in Figs. 1 and 2 that optimum composition of syngas
with high concentration of H
2
and CO is reached at temperatures higher than 1200 K. As all
power losses specified in equation (1) are increasing with temperature T
r
, it will be optimal
for energy balance to keep reactor temperature close to temperature 1 200 K.
Wood (res2)
0
0,2
0,4
0,6
0,8
1
300 800 1300 1800 2300 2800
Temperature (K)
Mol Fraction [mol/g]
CO
H
2
C
sol.
H
2
O
CO
2
CH
4
HC
2
H
2
Ar
Fig. 2. Composition of products of wood gasification. The mass ratios of components in
wood:
c = 0.511 , h = 0.064 , o = 0,425. Wood 47 kg/h, humidity 6.5%, argon 13.55 slm, water
plasma 18 g/min, CO
2
115 slm, O
2
30 slm.
The power available for material gasification
Δ
Q
r
determines maximum possible feed rate of
the material. We calculate energy Δh
r
needed for realization of reactions represented by
equations (1), (2), (3). As values representing heat of formation of biomass are not generally
known, we calculate the heat Δh
r
from known heats of combustion of cellulosic materials
using the scheme in Fig. 3. The scheme in Fig. 3 corresponds to the reaction (1). The heat of
gasification, i.e. production of syngas with composition
n
c
CO + n
H2
H
2
, is calculated as the
difference of heat of combustion
Δ
h
c, net
and heat of combustion of syngas
Δ
h
c, syng
,,
g
as c net c s
y
n
g
hh hΔ=Δ −Δ
(5)
The heat of combustion of cellulosic materials can be calculated from the equation
[Dietenberger 2002]
,0
13.23 [ / ]
cnet
hrkJ
g
Δ=
(6)