Masters thesis of science a molecular simulation study of thermal and ph effects on apo lactoferrin stability implications for potential encapsulation function of gram positive bacteria
Bạn đang xem bản rút gọn của tài liệu. Xem và tải ngay bản đầy đủ của tài liệu tại đây (2.15 MB, 162 trang )
A Molecular Simulation Study of Thermal and pH effects
on apo-Lactoferrin Stability: Implications for Potential
Encapsulation Function of Gram-positive Bacteria
A thesis submitted in fulfilment of the requirements for the degree of Master of Science
Carol Nhan
B. Sci (App. Sci) (Hons) RMIT University
School of Science
College of Science, Engineering and Health
RMIT University
April 2018
2
Declaration
I certify that except where due acknowledgement has been made, the work is that of the
author alone; the work has not been submitted previously, in whole or in part, to qualify
for any other academic award; the content of the thesis is the result of work which has
been carried out since the official commencement date of the approved research
program; any editorial work, paid or unpaid, carried out by a third party is
acknowledged; and, ethics procedures and guidelines have been followed.
I acknowledge the support I have received for my research through the provision of an
Australian Government Research Training Program Scholarship.
Carol Nhan
24 April 2018
3
Acknowledgments
As I begin to finish up my Masters by Research journey I’d like to firstly show
acknowledgement and appreciation to my two supervisors, Dr Bee May and Dr Andrew
Hung for their invaluable and kind advice, support, guidance and encouragement
throughout my research years as I completed my honours’ and now Master’s thesis,
without them, these two theses would not be possible.
This project was completed at RMIT University, City Campus. I would like to thank the
HDR School of Science for their fast replies, availability and friendliness to assist me
during my postgrad candidature, especially with the travel grant procedure to Japan to
present my honours thesis in my first symposium on “Modelling of pH effects on milk
proteins and implications for binding to bacterial surface peptidoglycan” in 2016 and
later, travel funds associated to Sydney, to present a poster based on my first result
chapter of this thesis.at the Australian Institute of Food Science and Technology
Convention in 2017, it was a very smooth journey. Furthermore, the computational
facilities utilised in this thesis was undertaken with the assistance of resources and
services from the National Computational Infrastructure (NCI) and the Pawsey
Supercomputing Centre, which are supported by the Australian Government.
I would also like to thank Associate Professor Colin Rix for his professional advice for
my first result chapter and Associate Professor Darryl Small for his kind offer to view
my second result chapter. Others include postgraduate friends for offering their help and
suggestions, my best friends for sticking with me and friends that I made have given
support and encouragement during my research candidature.
Lastly to end, to thank my parents, these past 3+ years have not been easy and was
difficult for them to understand research study and what it entails, for their support and
understandings.
4
Publications and Presentations
Journal publications
Nhan C, Rix C, May BK, Hung A. Temperature-induced structural changes of apolactoferrin and their functional implications: a molecular dynamics
simulation study. (Manuscript under revision, Molecular Simulation,
April 2018)
Nhan C, Small DM, May BK, Hung A. pH-induced structural changes of apolactoferrin and implications for its function: a molecular dynamics
simulation
study.
Molecular
Simulation.
2018.
DOI:
10.1080/08927022.2018.1535178
Other conference presentations
Nhan C, May BK, Hung, A. High-Temperature Molecular Simulations of Lactoferrin:
Implications for Bacterial Attachment. Poster session presented at: RMIT
Research Day; 2017 Jul 10; Melbourne, AU.
Nhan C, May BK, Hung, A. High-Temperature Molecular Simulations of Lactoferrin:
Implications for Bacterial Attachment. Poster session presented at:
Australian Institute of Food Science & Technology (AIFST) 50th
Anniversary Convention; 2017 Jul 17-18; Sydney, AU.
5
Thesis with Publications Declaration
6
Chapter Declaration for Thesis with
Publication
School of Science
Chapter Declaration for Thesis with Publications
Chapter 3 is represented by the following paper:
Temperature-Induced Structural Changes of apo-Lactoferrin and Their Functional Implications:
A Molecular Dynamics Simulation Study, Carol Nhan, Colin J. Rix, Bee K. May and Andrew
Hung, Molecular Simulation (under review, April 2018)
Declaration by candidate
I declare that I wrote the initial draft of this manuscript, and my overall contribution to this
paper is detailed below:
Nature of Contribution
Extent of Contribution (%)
Performed all simulations unless duly acknowledged, analysed
all of the data and prepared the graphs and tables, interpreted the
results, prepared the manuscript draft, revised the manuscript.
70
The following co-authors contributed to the work. The undersigned declare that the
contributions of the candidate and co-authors are correctly attributed below.
Author
Nature of Contribution
Colin J. Rix
Edited the first and final draft, providing
advice on written English and scientific
advice.
Supervised the project, edited the first and
final draft and approved the manuscript for
submission, edited and approved the revised
manuscript.
Supervised the project, edited the first and
final draft and approved the manuscript for
submission, edited and approved the revised
manuscript and submitted to the journal
Bee K. May
Andrew Hung
Extent of Contribution (%)
6
12
12
Candidate’s Signature
23 April 2018
Senior Supervisor’s
Signature
23 April 2018
7
School of Science
Chapter Declaration for Thesis with Publications
Chapter 4 is represented by the following paper:
pH-Induced Structural Changes of apo-Lactoferrin and Implications for Its Function: A
Molecular Dynamics Simulation Study, Carol Nhan, Darryl M. Small, Bee K. May and Andrew
Hung, Molecular Simulation (under review, April 2018, now accepted October 2018)
Declaration by candidate
I declare that I wrote the initial draft of this manuscript, and my overall contribution to this
paper is detailed below:
Nature of Contribution
Extent of Contribution (%)
Performed all simulations unless duly acknowledged, analysed
all of the data and prepared the graphs and tables, interpreted the
results, prepared the manuscript draft, revised the manuscript.
70
The following co-authors contributed to the work. The undersigned declare that the
contributions of the candidate and co-authors are correctly attributed below.
Author
Nature of Contribution
Extent of Contribution (%)
Darryl M. Small Edited the final draft, providing advice on
written English.
Bee K. May
Supervised the project, edited the first and
final draft and approved the manuscript for
submission, edited and approved the revised
manuscript.
2
Andrew Hung
14
Supervised the project, edited the first and
final draft and approved the manuscript for
submission, edited and approved the revised
manuscript and submitted to the journal
14
Candidate’s Signature
23 April 2018
Senior Supervisor’s
Signature
23 April 2018
8
Abstract
In this Masters thesis computational modelling techniques were employed to investigate
iron-free apo-Lactoferrin (apo-Lf) structural conformation changes in the presence of
variant temperature and pH. These conditions represent the environment most milk
protein goes through in food processing and the production of food products.
Lactoferrin (Lf) is an iron-binding glycoprotein present in secretory fluids of nasal,
pancreatic, amniotic, seminal plasma, saliva and tears, and in milk secretions such as
those from human and bovine sources. It is reported to have multifunctional roles such
as antibacterial, antivirus, antifungal, anti-inflammatory and anticancer activities.
In order to explore apo-Lf’s potential as an encapsulant for probiotics, sequence
alignment was employed to identify a region on the C-lobe of Lf capable of binding to
bacterial cell surfaces, followed by all-atom explicit solvent molecular dynamics (MD)
simulations which were applied to study the conformational changes of apo-Lf after
exposure to three processing temperatures: pasteurization (72 °C), spray drying (90 °C)
and close to ultra-high temperature (UHT) (135 °C) in a pH 7.0 environment.
Below 90 °C, the simulations indicate relatively minor changes in overall protein
structure, dimensions, per-residue fluctuations and inter-residue contacts and motional
correlations, relative to a low temperature (27 °C) control simulation, consistent with
experimentally-known conservation of apo-Lf structure and properties at low thermal
processing temperatures. At conditions similar to UHT (127 °C), however, marked
disruptions to protein structure are predicted to occur at a number of levels. There was a
substantial decrease in protein dimensions due to collapse in the inter-lobe region,
causing a reduction in separation between the N- and C-terminal lobes. The α-helical
content was reduced, although much of the β-pleated sheet structure was retained. There
was a marked increase in residue fluctuations in several regions of known functional
importance, including the antibacterial and iron-binding regions, as well as a C-terminal
area predicted to play a role in bacterial membrane surface binding. It is proposed that
this putative membrane binding region was stabilized by a triplet of hydrophobic
9
residues comprised of Leu446, Trp448 and Leu451, and that their mutual interactions
are severed at 400 K, resulting in changes to the structure, and potential membrane
binding propensity, of this region. Network analysis of disruptions to inter-residue
contacts also identified large clusters of residues in the N-terminal lobe which lose
contacts with their neighbours. Taken together, UHT conditions are therefore predicted
to cause disruptions to multiple functional properties of apo-Lf.
Furthermore, a unique method was proposed for identifying thermal-induced protein
unfolding based on examining the topology of networks of inter-residue motional
correlation gain for high-temperature simulation trajectories relative to a lowtemperature control simulation.
To further explore apo-Lf’s potential as an encapsulant for Gram-positive bacteria, MD
simulations along with examining topology networks were applied again to study the
pH-induced protein unfolding of apo-Lf after the exposure of pH conditions potentially
experienced by the protein in the course of its lifetime as a food component product,
from processing to consumption. This was achieved by studying the effects of
“extreme” acidic (nominally pH 1.0) and basic (nominally pH 14.0) conditions on apoLf relative to neutral pH 7.0. These simulations predicted that pH 1.0 conditions
affected parts of the N-Lobe, the lobe where the antibacterial peptides are located, while
the pH 14.0 conditions affected the C-Lobe, the lobe in which the identified Grampositive bacteria binding peptide is found. Overall, the MD simulation studies of apoLf, showed protein structural deviations which might have implications for the
temperature- and pH-dependent properties of the bacterial cell binding regions
identified in apo-Lf.
By enabling the thermal and pH sensitivity of several regions of functional importance
to be identified, the results of these simulations can be used to further assist in the
prediction of conditions suitable for successful protection and encapsulation of lactic
acid bacteria using bovine milk protein materials such as lactoferrin. The outcome of
this thesis can benefit the functional food and pharmaceutical industry by offering an
alternative encapsulation material.
10
Table of Contents
Declaration…………........................................................................................................ 3
Acknowledgments ............................................................................................................ 4
Publications and Presentations ......................................................................................... 5
Thesis with Publications Declaration ............................................................................... 6
Chapter Declaration for Thesis with Publication ............................................................. 7
Abstract……………………………………………………………………………….…9
Table of Contents ........................................................................................................... 11
List of Figures ................................................................................................................. 13
List of Tables .................................................................................................................. 18
Abbreviations ................................................................................................................. 19
Chapter 1 Introduction .................................................................................................... 22
1.1
Background ........................................................................................................... 22
1.2
Research Aim and Objectives ............................................................................ 24
1.2.1 Aim .............................................................................................................. 24
1.2.2 Objectives .................................................................................................... 24
1.3
Thesis Outline ....................................................................................................... 25
Chapter 2 Background and Literature Review .............................................................. 26
2.1
Milk Proteins ........................................................................................................ 26
2.1.1 Casein Proteins ............................................................................................ 27
2.1.2 Whey Proteins .............................................................................................. 29
2.1.3 Lactoferrin ................................................................................................... 33
2.1.4 Summary of Current Knowledge of Lf ........................................................ 45
2.2
Bacterial Surface Peptide-LysM ........................................................................ 46
2.3
Computational Techniques and Simulations for Protein Studies .................. 47
2.3.1 Protein Structure .......................................................................................... 47
2.3.2 Molecular Modelling ................................................................................... 56
2.3.4 Molecular Mechanics: Empirical Force Field Models ................................ 58
2.3.5 Molecular Dynamics: Theory and Applications to Protein Simulations ..... 63
2.3.6 EMBOSS Needle Pairwise Sequence Alignment ........................................ 68
2.3.7 Applications of Molecular Dynamics Simulations to Milk and Other
Proteins ........................................................................................................ 70
11
2.3.8 Summary of Challenges and Limitations .................................................... 73
Chapter 3 Materials and Methods.................................................................................. 75
3.1
Materials ................................................................................................................ 75
3.2
Simulation Procedures ......................................................................................... 75
3.2.1 High Temperature Simulations .................................................................... 77
3.2.2 Extreme pH Simulations .............................................................................. 77
3.3
Simulation Analysis Methods ............................................................................ 78
3.3.1 Root Mean Square Deviation (RMSD) ....................................................... 78
3.3.2 Root Mean Square Fluctuation (RMSF) ...................................................... 79
3.3.3 Solvent Accessible Surface Area (SASA) ................................................... 79
3.3.4 Radius of Gyration (Rg) .............................................................................. 80
3.3.5 Secondary Structure Analysis ...................................................................... 80
3.3.6 Identification of Hydrogen Bonds ............................................................... 81
3.3.7 Intramolecular Protein Core Energy ............................................................ 82
3.4
Network Analyses ................................................................................................ 82
3.4.1 Conformational Networks ........................................................................... 83
3.4.2 Inter-residue Contact Loss Networks .......................................................... 83
3.4.3 Inter-residue Correlation Gain Networks .................................................... 84
Chapter 4 Temperature-Induced Structural Changes of apo-Lactoferrin and Their
Functional Implications: A Molecular Dynamics Simulation Study........... 85
4.1
Introduction ........................................................................................................... 85
4.2
Materials and Methods ........................................................................................ 88
4.2.1 Protein Sequence Alignment ....................................................................... 88
4.2.2 Molecular Dynamics Simulations................................................................ 88
4.2.3 Simulation Trajectory Analyses .................................................................. 89
4.2.4 Network Analyses ........................................................................................ 90
4.3
Results and Discussion ........................................................................................ 91
4.3.1 Identification of Possible Bacterial Surface Binding Region ...................... 92
4.3.2 Conformational Networks: Qualitative Analyses of Tertiary Structure ...... 93
4.3.3 RMSD and Radius of gyration: Quantitative Analyses of Tertiary Structure
..................................................................................................................... 96
4.3.4 Overall Secondary Structure and Internal Hydrogen Bonding Differences 99
4.3.5 Residue-Level Differences: RMSF & SASA ............................................ 101
12
4.3.6 Inter-residue Contact Loss Networks ........................................................ 105
4.3.7 Inter-residue Correlation Gain Networks .................................................. 109
4.4
Conclusions ......................................................................................................... 112
Chapter 5 pH-Induced Structural Changes of apo-Lactoferrin and Implications for Its
Function: A Molecular Dynamics Simulation Study ................................ 114
5.1
Introduction ......................................................................................................... 114
5.2
Materials and Methods ...................................................................................... 117
5.2.1 Protein Sequence Alignment ..................................................................... 117
5.2.2 Preparation of apo-Lf Structure ................................................................. 117
5.2.3 Molecular Dynamics Simulations.............................................................. 118
5.2.4 Simulation Trajectory Analyses ................................................................ 119
5.2.5 Network Analyses ...................................................................................... 119
5.3
Results and Discussion ...................................................................................... 121
5.3.1 Identification of Possible Bacterial Surface Binding Region .................... 121
5.3.1 Conformational Networks: Qualitative Analyses of Tertiary Structure .... 123
5.3.2 Root-mean-square Deviation and Radius of Gyration: Quantitative Analyses
of Tertiary Structure .................................................................................. 126
5.3.3 Overall Secondary Structure, Internal Energy, and Hydrogen Bonds ....... 129
5.3.4 Residue-Level Differences: Root-mean-square Fluctuations and SolventAccessible Surface Areas .......................................................................... 132
5.3.5 Inter-residue Contact Loss Networks ........................................................ 136
5.3.6 Inter-residue Correlation Gain Networks .................................................. 140
5.4
Conclusions ......................................................................................................... 143
Chapter 6 Conclusions and Future Work .................................................................... 146
6.1
Summary of Results and Discussion ............................................................... 146
6.2
Major Conclusions ............................................................................................. 149
6.3
Future Work ........................................................................................................ 150
References….…………………………………………………………………………152
13
List of Figures
Figure 2.1 Schematic diagram of milk proteins found in bovine milk [13, 14, 15, 16,
17]. ............................................................................................................... 27
Figure 2.2 Holt’s model of casein micelle with calcium phosphate nanocluster, adapted
from Hornes [20] ......................................................................................... 28
Figure 2.3 Schematic representation of whey protein: bovine β-Lg (PDB ID: 4GNY)
[39]. Yellow arrows represent β-strands, purple represents α-helices, dark
blue represents π-helices, and cyan represents turns. .................................. 32
Figure 2.4 Schematic representation of whey protein: bovine α-La (PBD ID: 1HFX)
[42]. Yellow arrows represent β-strands, purple represents α-helices, dark
blue represents π-helices, and cyan represents turns. .................................. 33
Figure 2.5 Symmetric representation of the lobes in bovine lactoferrin with 2 iron
(FeIII) present (Purple): N and C-lobe is displayed as N1 (Blue), N2 (Red),
C1 (Green) and C2 (Orange) with a connecting three turn helix at 334 to
344 (pink) [59] ............................................................................................. 36
Figure 2.6 The amino acids surrounding the iron binding site. Image adapted from
Sreedhara et al. [51] ..................................................................................... 38
Figure 2.7 Process of binding of free iron in Lf. Image adapted from Berg et al. [67] .. 38
Figure 2.8 Antibacterial peptides found in bovine lactoferrin: bLfcin (17 - 47) (red) and
LFampinB (265 - 284) (orange), sequence adapted from Bellamy et al. [70]
and van der Kraan et al. [80] ....................................................................... 40
Figure 2.9 Surface representation of Lf with basic (blue) and acidic (red) residues
coloured, indicating that at pH 7.0 the N-lobe surface is predominantly
positive, while a mixture of positive and negative charges exists on the Clobe surface .................................................................................................. 44
Figure 2.10 Schematic diagram of primary, secondary, tertiary and quaternary
structures. Image adapted from Carl Branden and John Tooze [128] ......... 48
Figure 2.11 A typical amino acid showing a carboxylic acid group, amino group and
sidechain R-group ........................................................................................ 49
Figure 2.12 Example of electrostatic (pKa) using alanine (simplest amino acid) and
aspartic acid (an amino acid with longer side chain) ................................... 50
Figure 2.13 Location of peptide bond between polypeptides and representation of
torsion angles: phi (φ), psi (ψ), and omega (ω) ........................................... 51
14
Figure 2.14 Representations of protein secondary structure: α-helix ............................. 52
Figure 2.15 Representations of protein secondary structure of two β-pleated sheets .... 53
Figure 2.16 Diagram of the different types of simulation categories, their time scales
and length scales .......................................................................................... 58
Figure 2.17 A two-dimensional and three-dimensional illustration of a PBC ............... 65
Figure 2.18 Example of a FASTA file. Source: Sequence related to Albumin protein of
chicken species retrieved from NCBI .......................................................... 70
Figure 3.1 Diagram representing solvent accessible surface area calculations. ............. 80
Figure 3.2 Diagram representing secondary structure analysis. ..................................... 81
Figure 3.3 Diagram representing hydrogen bonding criteria. ........................................ 82
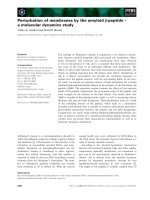
Figure 4.1 (a) Protein sequence alignment of a known bacterial membrane binding
domain, LysM. Location of bacterial cell wall binding region in lactoferrin,
revealing the possible membrane-binding areas in lactoferrin present in one
near continuous single-strand. (b) Side-on view, revealing the most
electropositive region (red), the bacterial binding site, in the C-Lobe, with
the most electronegative region, (yellow) in the N-lobe. (c) End-on view
with electropositive region His420-Ser421 and Leu427-Ala460 highlighted
as a separate sequence. ................................................................................ 93
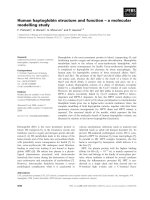
Figure 4.2 Conformational networks (left) and most highly-populated structures of Lf
(right) for simulations at (a) 300 K, (b) 363 K and (c) 400 K. (The 345 K
network is similar to that of the 363 K and is not shown). Networks are
colour coded according to communities (conformational clusters) identified.
Node sizes are proportion to the degree of the node (i.e. number of
connections). Three conformational clusters are identified for 300 K,
indicating a relatively rigid structure, whereas many more distinct clusters
are identified at higher temperatures. Ribbon structures are colour-coded as
follows: magenta = α-helix, yellow = β-pleated sheets, cyan = turns, blue =
3-10 helix. .................................................................................................... 94
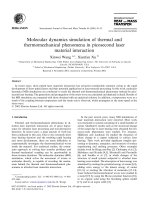
Figure 4.3 Structural analysis of the MD simulation results. (a) Backbone RMSD of
lactoferrin for 300 K (purple), 345 K (blue), 363 K (orange) and 400 K
(red); and (b) radius of gyration (Rg) with respect to time, averaged over 3
independent trajectories. The RMSD indicates that while structural
deviation is similar at 345 K and 363 K, far more substantial structural drift
is observed at 400 K. Rg indicates that Lf has similar overall dimensions at
300 K, 345 K and 363 K, but becomes more compact a 400 K. ................. 97
15
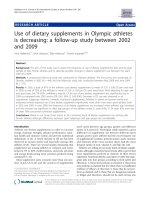
Figure 4.4 (a) RMSF of the Cα positions in the lactoferrin backbone versus residue
number. Key residues with enhanced RMSF at high temperatures are
marked. (b) Differences in SASA with respect to residue number for 400 K,
calculated relative to the SASA for 300 K. (c) Ribbon structure of Lf
colour-coded according to RMSF value at 400 K, indicating particularly
high flexibility at loop regions (circled) in both the N- and C-lobes......... 103
Figure 4.5 Residue contact loss networks (left) and ribbon structures of Lf (right) with
residues of interest shown as large spheres and colour coded, for (a) 345 K,
(b) 363 K, and (c) 400 K. The networks show residues which lose contact
with their neighbours relative to 300 K. Networks are colour coded
according to communities (residues) which collectively lose contacts at high
temperature. Node sizes are proportion to the number of connections lost.
Progressively larger numbers of residues lose contact with increasing
temperature. The influence of heat on the identified bacterial binding region
in apo-Lf are shown as follows: (d) starting position structure at 300 K, and
(e) final structure at 400 K. The figures show a comparison of the starting
structure and final structure after thermal exposure, with emphasis on
monitoring Leu446, Trp448 and Leu451................................................... 108
Figure 4.6 Residue motional correlation gain networks (left) and ribbon structures of Lf
(right) with residues of interest shown as large spheres for (a) 345 K (b) 363
K and (c) 400 K. The networks show residues which collectively have
increased correlated motion at high temperature, relative to 300 K. Nodes
are colour coded according to communities (residues) which collectively
show increased correlation under high temperature. Node sizes are
proportion to the number of residues with which the node (residue) in
question show increased correlation. Progressively larger numbers of
residues move in concerted motion with increasing temperature. ............. 111
Figure 5.1 (a) Protein sequence alignment of a known bacterial membrane binding
domain, LysM. (b) Side-on view, revealing the most electropositive region
(red), the bacterial binding site, in the C-Lobe, with the most electronegative
region, (yellow), which houses several sequences from which antibacterial
peptides have been derived, on the opposite side, in the N-Lobe of
lactoferrin. (c) End-on view with electropositive region His420-Ser421 and
Leu427-Ala460 highlighted as a separate sequence. (d) Surface
representation of Lf with basic (blue) and acidic (red) residues coloured,
indicating that at pH 7.0 the N-lobe surface is predominantly positive, while
a mixture of positive and negative charges exist on the C-lobe surface. ... 122
Figure 5.2 Conformational networks (left) and most highly-populated structures of Lf
(right) for simulations at (a) pH 7.0, (b) pH 1.0 and (c) pH 14.0. Networks
are colour coded according to communities (conformational clusters)
16
identified. Node sizes are proportion to the degree of the node (i.e. number
of connections). Three conformational clusters are identified for pH 7.0,
indicating relatively rigid structure, whereas many more distinct clusters are
identified under extreme pH conditions. ................................................... 124
Figure 5.3 Structural analysis of the MD simulation results. (a) Backbone RMSD of
lactoferrin for acidic pH: pH 1.0 (blue), basic pH:pH 14.0 (red) and
control:pH 7.0 (purple) and (b) radius of gyration (Rg) with respect to time,
averaged over 3 independent trajectories. Rg indicates that compactness was
lost at pH 1.0 and pH 14.0. (c) Ribbon structures of Lf simulated at pH 7.0
(purple) with the N-terminal lobe fitted and overlayed onto that of pH 1.0
(blue) and (d) onto pH 14.0 (red), indicating substantial twist and
detachment of C-lobe relative to the N-lobe. This motion is particularly
obvious at pH 14.0 (red), consistent with the much higher RMSD value. 128
Figure 5.4 (a) Root-Mean-Square-Fluctuation (RMSF) in the Cα of the position of
lactoferrin backbone versus residue. Highest fluctuation occurred in the NLobe for pH 1.0 and the C-Lobe in pH 14.0. Differences in solvent
accessible surface area (SASA) with respect to residue number for (b) pH
1.0 and (c) for pH 14.0, calculated relative to the SASA for pH 7.0. (d)
Ribbon structure of Lf with areas of high relative fluctuation at pH 1.0 (blue
ribbons) and at pH 14.0 (red ribbons), emphasising the different regions of
enhanced flexibility for acidic compared to basic pH conditions.............. 133
Figure 5.5 Residue contact loss networks (left) and ribbon structures of Lf (right) with
residues of interest shown as large spheres and colour coded, for (a) pH 1.0
and (b) pH 14.0. The networks show residues which lose contact with its
neighbours relative to pH 7.0. Networks are colour coded according to
communities (residues) which collectively lose contacts under extreme pH
conditions. Node sizes are proportion to the degree of the node (i.e. number
of connections lost). At pH 1.0, most of the contacts lost occur at the edges
of the N-lobe, while at pH 14.0, more contacts are lost at the C-lobe and in
the inter-lobe regions. Influence of pH on the identified bacterial binding
region in apo-lactoferrin. Comparison of it’s starting structure and final
structure after acidic exposure with emphasis on monitoring of Leu446,
Trp448 and Leu451 in: (c) Starting position structure at pH 7.0 (Control) (d)
final structure at pH 1.0 and (e) final structure at pH 14.0. ....................... 138
Figure 5.6 Residue motional correlation gain networks (left) and ribbon structures of Lf
(right) with residues of interest shown as large spheres and colour coded, for
(a) pH 1.0 and (b) pH 14.0. The networks show residues which collectively
have increased correlated motion at extreme pH conditions relative to pH 7.
Networks are colour coded according to communities (residues) which
collectively show increased correlation under extreme pH conditions. Node
17
sizes are proportion to the degree of the node (i.e. number of residues with
which a particular residue has increased correlation). At pH 1.0, most of the
correlation increases occur at the N-lobe, while at pH 14.0, much more
inter-lobe correlations are produced, with more residues involved at the Clobe. ........................................................................................................... 141
18
List of Tables
Table 2.1 Total number of animo acid residues per corresponding R-side chain groups
located in bovine Lf ....................................................................................... 35
Table 2.2 The 20 common amino acids with their associated pKa and isoelectric (pI)
values. Note: a blanked-out box presents no side chain. Adapted from Hunt
and Spinney [130] .......................................................................................... 51
Table 2.3 Types of sequence alignment programs under three grouped categories: global
alignment, local alignment and genomic alignment. ..................................... 68
Table 4.1 Percentage of secondary structures of simulated apo-Lf at target temperatures.
........................................................................................................................ 99
Table 4.2 Hydrogen bonding and salt bridge analyses of simulated apo-Lf relating to
denaturation. ................................................................................................. 101
Table 5.1 Percentage of secondary structures of simulated apo-lactoferrin at target pH
values. .......................................................................................................... 130
Table 5.2 pH-Dependent intra-molecular energies of apo-lactoferrin ......................... 131
Table 5.3 Hydrogen bonding analyses of simulated apo-lactoferrin relating to
denaturation. ................................................................................................. 131
19
Abbreviations
α-La
Alpha-Lactalbumin
Apo-LF
Iron free lactoferrin
APBS
Adaptive Poisson-Boltzmann Solver
β-Lg
Beta-Lactoglobulin
bLfcin
Bovine lactoferricin
CFU
Colony-forming unit
CPK
Corey-Pauling-Koltun
DFT
Density Functional Theory
FF
Force Field
g
gram/grams
GROMACS
GROningen MAchine for Chemical Simulation
hLfcin
Human lactoferricin
Holo-Lf
Iron saturated of lactoferrin
K
Kelvin (measure of temperature)
LAB
Lactic Acid Bacteria
Lf
Lactoferrin
LFampinB
Bovine lactoferampin
LFampinH
Human lactoferampin
LP
Lactobacillus Plantarum
LysM
Lysin motif
MC
Monte Carlo
MD
Molecular Dynamics
Native-Lf
1 iron atom present in lactoferrin
NPT
Constants number of particles, pressure and temperature
NVE
Constant number of particles, volume and energy
NVT
Constant number of particles, volume and temperature
PBC
Periodic boundary condition
PDB
Protein Data Bank
PME
Particle-Mesh Ewald
20
pI
Isoelectric point
pKa
–log of acid dissociation constant
QM
Quantum Mechanics
Rg
Radius of gyration
RMSD
Root Mean Square Deviation
RMSF
Root Mean Square Fluctuation
SASA
Solvent Accessible Surface Area
SPC
Simple Point Charge
UHT
Ultra-high temperature
VMD
Visual Molecular Dynamics
XRD
X-ray Diffraction
21
Chapter 1
Introduction
This chapter provides the background, issues, research aim and objectives. In addition,
this chapter also provides an outline of different chapters of the thesis.
1.1
Background
Probiotics from the Bifidobacterium and Lactobacillus genus are currently of high
interest, due to their health benefits, and the fact that these bacteria are generally
regarded as safe for human consumption [1]. These lactic acid bacteria (LAB) are
commonly used in the food industry for fermentation and to benefit the host by
regulating gut health to assist the breakdown of sugars, promote good digestion, boost
the immune system, maintain proper intestinal pH, and successfully compete with
pathogens [2, 3]. To provide such benefits to the host, these bacteria must be active and
be delivered at a minimum dosage of 106 – 107 CFU/g [4] under the physiological and
processing conditions to which they are exposed.
The use of milk protein as an encapsulating material is gaining interest due to its
commercial availability, the ability to adjust its gel formation to match the bacterial
environment, the capability of the milk protein to encapsulate any hydrophobic and
hydrophilic live bacteria, and its nutritional importance [4, 5, 6]. In a previous project
by Khem [7], the author searched for protective encapsulants and demonstrated that the
whey proteins component offered a promising encapsulation material for the coating of
Lactobacillus plantarum A17 and B21. These strains that belong to the Lactobacillus
genus had been generally accepted as bacterial species ascribed to the general category
of probiotics [8].
22
Most bacteria have a high affinity iron acquisition system [9] as part of their metabolic
pathway in order to function.
However, Archibald [10] found that Lactobacillus
plantarum species have a very low affinity for iron and this provides Fe-free L.
plantarum with a competitive advantage in its natural habitat. This unique characteristic
means that while being encapsulated by an iron-scavenging protein, Lactobacillus
plantarum would be able to deliver beneficial advantages to the host without any
detrimental effects, and still be able to carry out its antibacterial action on pathogenic
bacteria such as Escherichia coli, Listeria monocytogenes and Shigella flexneri [11].
In this project, lactoferrin, a minor whey protein with its well documented ironscavenging property, has been hypothesised as a protein with the potential to be an
encapsulant for L. plantarum. Bovine lactoferrin, which forms the minor constituents of
whey protein, made up about 0.1 g/kg in milk [12]. This minor protein, from the same
category of whey proteins, has the potential to be an encapsulant for probiotics;
however the stability of the overall protein fold, the motional fluctuations of the sidechain residues, secondary structure changes, and intra-molecular interactions, with
respect to changes in processing conditions such as temperature and pH are yet to be
explored at the molecular level. In addition, the implications of changes on functionally
relevant regions on the protein, including the bacterial-binding region deduced from
theoretical models, can be used to further assist in the prediction of successful
protection and encapsulation of Lactobacillus plantarum using Lf after various
treatment conditions.
In this thesis, the focus is on the iron-free form of bovine lactoferrin (apo-lactoferrin,
apo-Lf), for the following reason: part of the potential benefit imparted by lactoferrin as
an encapsulator of L plantarum is its iron-scavenging capability, which potentially
serves a bacteriostatic function by depriving competing pathogenic microorganisms of
essential iron, while causing no such negative effects on L. plantarum itself (the bacteria
protein is purported to protect), which does not require iron. Thus, apo-Lf is the most
functionally relevant isoform in the context of its potential application as a probiotic
encapsulant protein.
23
1.2
Research Aim and
Objectives
1.2.1
Aim
To understand the stability of apo-Lf under a variety of high temperature and
extreme pH conditions using Molecular Dynamics simulations.
1.2.2
Objectives
To investigate the effect of various processing temperatures on the stability of apo-Lf
protein structure under food processing conditions: room temperature (27 °C),
pasteurization (72 °C), spray drying (90 °C) and close to UHT (127 °C). To investigate
the effect of pH on the stability of apo-Lf protein structure using “model” extreme pH
conditions, nominally pH 1.0 and pH 14.0. Accordingly this project was also designed
based on the following hypotheses:
i.
The multifunctional lactoferrin could attach to the bacterial cell surfaces.
ii.
A region on lactoferrin exists which has sequence similarity to LysM (a
known membrane-binding peptide, known to attach to Gram-positive and
some Gram-negative bacterial cells).
iii.
Insights into the stability of Lf can be monitored using advanced
computational methods.
iv.
The stability of Lf is affected by temperature.
v.
The stability of Lf is affected by pH.
24
1.3
Thesis Outline
This thesis has been written in six chapters including this introductory chapter. Chapter
1 provides an overview of the research project followed by background and literature
review (Chapter 2) where relevant concepts relevant to this project were reviewed.
Chapter 3 describes the methods and procedures utilised in the whole project including
the principle of operation for the computational methods and analysis.
Chapter 4 explores the effect of pasteurization, spray drying and UHT temperature- on
structural changes of apo-Lf and provided potential implications for bacterial
attachment. Chapter 5 investigates the same in silico study that further explored variant
extremes of pH on the structural changes of apo-Lf and provides further implications for
bacterial attachment. Finally, a general discussion and conclusions chapter discusses
and summarises the key findings in this work and also presents recommendations for
future work.
25