Primavera Manual - Part 2
Bạn đang xem bản rút gọn của tài liệu. Xem và tải ngay bản đầy đủ của tài liệu tại đây (323.22 KB, 18 trang )
Lab 2 – Reports, Graphs, and Diagrams
2.1 Practice Starting a Precedence Network
Considering that you have had an introduction in class to Precedence
networks and the varied relationship types, today’s laboratory will give
you good practice for preparing your next Project assignment.
If you choose TOOLS from the upper menu, options and the activity
inserting before you create or open your project, you can change the
activity ID’s and the increments as you wish.
Practice 2.1
1. On your own, create a new project using the last 4 digits of your social
security number or student identification number.
2. This project is a valve and flowmeter vault being done for the City of Mesa.
Include this information for your new project
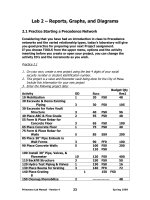
3. Enter the following project data:
Budget Qty
Activity OD Succ Res1
10 Mobilization 1 20 FS0 48
20 Excavate & Demo Existing
Piping 3 30 FS0 105
30 Excavate for Valve Vault
Structure 3 40 FS0 96
40 Place ABC & Fine Grade 2 55 FS0 48
55 Form & Place Rebar for
Concrete Floor 3 65 FS0 100
65 Place Concrete Floor 1 75 FS0 40
75 Form & Place Rebar for
Walls 5 85 SS9 200
85 Place 30” Pipe Embeds in
Wall Forms 3 90 FF0 100
90 Place Concrete Walls 5 100 FS0 200
110 FS0
100 Install 30” Pipe, Valves, &
Flowmeter 10 120 FS0 400
110 Backfill Structure 3 150 FS0 50
120 Hydro Test Piping & Valves 1 130 FS0 16
130 Place Beams for Grating 3 140 FF0 72
140 Place Grating 1 150 FS0
8
150 Cleanup/Demobilize 2 48
Primavera Lab Manual - Version 4 Spring 1999
23
4. Calculate the project duration (refer to page 9 if you’ve forgotten). Be sure
that there are no loops and only one activity without a predecessor and one
without a successor.
5. Printout the calculation run – insert your name on the report before it prints
(no penciled in names!). Save this for submission at the end of the
class.
6. Answer the following questions by keying the questions and your answers on
your calculation run:
What date does your project end on?
How many relationships does your project have
?
7. Backup your project up to diskette using the compressed mode. Be careful
not to delete what is already on your disk. You can avoid this by backing up
Primavera files to a new subdirectory.
Primavera Lab Manual - Version 4 Spring 1999
24
Remember, to delete a project, highlight the project you want to
delete and toggle the Delete Key. Respond Yes when prompted.
Using Primavera to Create Reports:
I will demonstrate and then you will perform the tasks on the
following pages.
Primavera Lab Manual - Version 4 Spring 1999
25
2.2 Early Start and Relationship Reports
To create Schedule Reports in a tabular format select Tools, Tabular
Reports, Schedule from the Upper Menu Bar.
You will see a list of all of the currently available (previously created)
reports. DO NOT USE THESE REPORTS.
Primavera Lab Manual - Version 4 Spring 1999
26
ADD your own reports because, in general, those already created were
constructed for the Tutorial and refer to the many sample projects
provided with the program. We will be creating our own reports to
meet our specifications. There are many different ways to provide
report information. First let’s have a look at all of the variables we
have to choose from.
First is the CONTENT window.
Primavera Lab Manual - Version 4 Spring 1999
27
Just Click On OK – it
really doesn’t matter
what the Report ID is.
We can put
many
different
items on our
report. We
can skip lines
to enhance
the
presentation
too.
Here are some of the choices you have in
addition to the activity code line. Use the
scroll bar on the right to see all of the
choices. For example, you may want a
report to have the workday number as well
as the calendar date – use Workperiod.
Let’s move to the FORMAT window.
Primavera Lab Manual - Version 4 Spring 1999
28
Here we can decide what information to
show on the activity code line. The only
thing you should ever mask here for class
is activity codes and perhaps calendar.
This information is good to use
when you are on a big project
and want to prepare reports for
certain people.
Look
below
for a list
of
choices
here.
You can sort your reports on Early Start,
the earliest activities first and the last
activity last. Or you can sort by Total
Float with all the activities with zero total
float first and those with the most total
float last. Or you can make a combination
of many parameters. An example is a
TFES report, where activities are first
sorted by total float and then by early
start.
Last is the SELECTION window.
The criteria are shown below.
The High and Low Value Range is used for those conditions requiring
that notation. For example, when Select = TF, IS = WR, LOW Value
could = 0 and High Value = 10, thus providing only activities in the
report with 0 to 10 days of Total Float.
Primavera Lab Manual - Version 4 Spring 1999
29
This window
lets you limit
the activities
shown on the
report based
on criteria you
select.
These schedule parameters allow the
user to select only activities with a
calendar ID of 2, TF< 0, or an
activity ID that contains ELE. This is
the SELECT column.
The IS column looks like this.
Here you can establish the
boundaries of the criteria
The ANY or ALL diamonds on the Selection window allow you to make
multiple criteria mutually inclusive or exclusive. If you need a
combination of effects use the Level Selection in combination with the
ANY and ALL criteria.
• The Content window is used to describe what is in the report.
• The Format window is used to describe, among other things, how
the report is to be sorted.
• The Selection window is used to the limit number of activities on
each report.
Practice 2.2
1. Prepare a report sorted by early start and containing the Work period in
addition to the Activity Code Line.
2. Prepare a TFES report – remember to sort first by TF and then by ES.
Include the Resource 1 in your printout.
3. Prepare a relationship report using the detailed predecessor and successor
from the CONTENT screen. Put the activity first, then the predecessor and
then the successor and skip a line before the next activity.
4. Prepare a report with the activities sorted by their ID’s. Limit your report to
those activities with ID’s from 40 to 90.
5. Submit your reports, stapled and including your name in a prominent position,
when you have completed this practice exercise.
2.3 Project Diagrams
Primavera Lab Manual - Version 4 Spring 1999
30
As you can see there
are a lot of choices
again. Let’s try the
Pure Logic Diagram.
Again ADD your own, DO NOT USE one that’s already been established.
Go to the next page to see the next screen.
Primavera Lab Manual - Version 4 Spring 1999
31
Say OK; the
number
doesn’t
matter.
The CONTENT window here allows the user to select what will appear
on the network diagram. I generally delete the percent complete,
remaining duration, and calendar ID from projects with one calendar,
which are not in progress. I usually select the late dates for display in
addition to the defaults.
Make these choices now. Also check the box “Connectors to excluded
activities.” Use the Rev title area to write your Name and ID number.
Change the title from PL-04, or whatever you have, to something
meaningful to you regarding a network diagram. Then move to the
FORMAT window.
Primavera Lab Manual - Version 4 Spring 1999
32
In general, this screen will be left in its default condition. Note that
you can change the determination of what to depict as critical on your
diagram. Maybe your project is large and long and 10 days of float
seems critical. Change it here and all activities with 10 days of float or
less will be red or emboldened on the printout of the diagram.
The check mark in the Confirm preparation box means that Primavera
will tell you how many pages it will take to show your diagram and you
will have a chance to cancel your run, before viewing or printing too
many pages.
Move on to the SELECTION window.
Primavera Lab Manual - Version 4 Spring 1999
33
This looks just like the selection window for the reports and functions
the same way. Refer to page 29 if you need a refresher here.
The SIZE window is unique to Graphics. It allows you to change the
FONT and spacing to reduce the number of pages of printout, or
enlarge the writing. The image has been reduced to fit on this page.
Primavera Lab Manual - Version 4 Spring 1999
34
Practice 2.3
1. Produce a Pure Logic diagram for your network.
2. Include your name in the Rev Title Box.
3. See how few pages you can get it on and still have it be legible.
4. Save it for submission at the end of class.
2.4 Histogram and S-Curve Graphs
Primavera Lab Manual - Version 4 Spring 1999
35
YUP, Add a
new one.
Select
Resource
Cost
There are lots of choices here – you should review each of the eight
windows before you prepare your histogram or S-Curve (Cumulative).
The defaults are usually
good for the CONTENT
screen.
Primavera Lab Manual - Version 4 Spring 1999
36
Let’s stick
with
Resources
not Cost.
You can do
either or
both
together.
At this point in our
scheduling career the
number is unimportant!
We don’t
have a
target
schedule
yet.
Primavera Lab Manual - Version 4 Spring 1999
37
Be sure
these
dates
match your
project.
Change
this to
Daily.
You have
to fill this
out with
your
resource.
Get rid of
the ???
with the
space bar.
Primavera Lab Manual - Version 4 Spring 1999
38
The SIZE window is the
same as shown on the
Pure Logic Diagram.
The Selection screen
remains the same.
Use this if you want to
limit your output. For
example if you want
only the man hours for
a certain for of the
building or the critical
path.
In general, the default on
the FORMAT screen is
sufficient. Experiment with
it on your own.
Having descriptive line types, weights, and/or colors helps to separate
and identify, through the legend, what each line or bar represents.
Primavera Lab Manual - Version 4 Spring 1999
39
This screen will allow the user to
change pen colors, line weights
and types, and fill patterns. This is
very helpful when attempting to
show comparative data.
The Last Window is TITLES.
This screen allows the user to enter X- and Y-axis titles, a main Graph
title which can now be different from the Resource title. It also allows
for a maximum Y-Scale. This is very helpful when making graphs that
you want to compare or for large projects that take more than one
page to display.
Practice 2.4
1. Prepare a histogram for Resource 1. Make the bar have some sort of hash
marked pattern (not entirely filled).
2. Prepare an S-Curve of the same resource. Show both early and late curves
and use different line types to distinguish between them.
3. Submit these graphs with your name in the Rev Title area along with any
unsubmitted work from practices 2.1 and 2.3.
Have a lovely weekend.
Primavera Lab Manual - Version 4 Spring 1999
40