Primavera Manual - Part 3
Bạn đang xem bản rút gọn của tài liệu. Xem và tải ngay bản đầy đủ của tài liệu tại đây (262.18 KB, 14 trang )
Lab 3 Leveling and Targets
3.1 Setting Max and Min Levels
Leveling a network means to move activities in time, moving those
with float, using some or all of the float, to achieve a more uniform
resource profile. Take 15 minutes to read through the example that
follows to see how the method works.
First comes the network and here the example is of ACME National
Hair Center.
Primavera Lab Manual - Version 4 Spring 1999
41
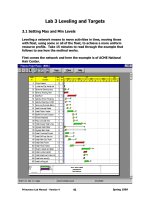
The following page shows a bar chart for a portion of a project and the
corresponding man hour histogram. A good tool to use is to include the
resource column or a report with the resource line included in the
Content Window.
Primavera Lab Manual - Version 4 Spring 1999
42
Primavera Lab Manual - Version 4 Spring 1999
43
ACTIVITY ID
EARLY
START
EARLY
FINISH
ORIG
DUR
1997 1998
SEP OCT NOV DEC JAN
8 15 22 29 6 13 20 27 3 10 17 24 1 8 15 22 29 5 12
290 29OCT97 7NOV97 8
300 10NOV97 13NOV97 4
360 12NOV97 24NOV97 9
310 14NOV97 19NOV97 4
320 14NOV97 3DEC97 14
330 14NOV97 24NOV97 7
340 14NOV97 18NOV97 3
350 25NOV97 26NOV97 2
370 25NOV97 25NOV97 1
380 4DEC97 25DEC97 16
390 4DEC97 19DEC97 12
400 26DEC97 30DEC97 3
410 31DEC97 5JAN98 4
420 6JAN98 14JAN98 7
430 14JAN98 0
Plot Date 8SEP97
Data Date 8SEP97
Project Start 8SEP97
Project Finish 14JAN98
(c) Primav era Systems, Inc.
Activity Bar/Early Dates
Critical Activ ity
Progress Bar
Activity Late Dates
Milestone/Flag Activity
Man-Hour Histogram
Leveling Demonstration
DEWSC - Planning & Scheduling
MANL Sheet 1 of 1 Schedule dates
0
80
160
240
320
400
480
560
SEP
1
1997
SEP
15
SEP
29
OCT
13
OCT
27
NOV
10
NOV
24
DEC
8
DEC
22
JAN
5
1998
392
488
440
304
312
360 360
456
504
360
376
160
112
160 160
88
144
128
72
Man-Hour
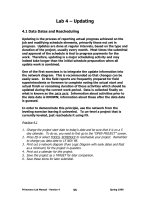
Perhaps the biggest thing to notice in the histogram below is that
there are several uncharacteristically high peaks. Many of the peaks
are associated with activities that have total float. We want to use
this float then to delay the corresponding activities so that we can
smooth the profile.
In general there are many methods or algorithms for how we choose
activities to delay. The default for Primavera and the one we will use
the most is called the conventional method. However before we get to
what to move, we need to establish a leveling limit that seems
achievable.
Notice that the entire Histogram shows many peaks and many valleys.
In order to find a place to begin leveling, try finding the average man-
hour use per day. Note that to level, the histogram has to be done
daily
. In order to find the average we need to know the total man-
hours and the total duration in days. To find the total man-hours on
large projects use the earned value or other resource report. To find
the duration, look for the last activity, click on “Dates,” and investigate
it ending workday number corresponding to the early finish. For this
Primavera Lab Manual - Version 4 Spring 1999
44
Projec t Start 8SEP97
Projec t Finish 14JAN98
Data Date 8SEP97
Plot Date 8SEP97
(c) Primavera Sys tems, Inc .
Schedul e dates
Normal Limi t/Reso urc e Above Normal
Max imum Limi t/Resou rce Abov e Maxi mum
Date ApprovedCheck edRevision
DEW SC - Planning & Scheduling
Leveling Demonstration
RC -11
MANL Sheet 1 of 1
0
20
40
60
80
100
120
140
160
SEP
8
1997
SEP
15
SEP
22
SEP
29
OCT
6
OCT
13
OCT
20
OCT
27
NOV
3
NOV
10
NOV
17
NOV
24
DEC
1
DEC
8
DEC
15
DEC
22
DEC
29
JAN
5
1998
JAN
12
Days
24
72
72
80
144
112
96
104
88
88
88
88
88
88
88
88
72
32
64
48
48
48
72
72
72
72
72
72
72
72
72
72
72
72
72
72
80
96
104
104
120
96
96
96
96
64
64
56
72
104
88
88
72
64
64
64
40
24
16
16
16
16
16
32
32
32
32
32
32
32
32
32
32
32
32
16
16
16
16
24
24
24
32
32
32
32
24
24
24
24
24
24
24
Man-Hour
project assume we have 5376 MH and a 93 day duration, therefore the
average resource use is 5376/93 = 57.8 ≅ 58/day.
There are many other caveats that you will learn in class about
choosing a beginning level. If we assume that 58 is a good level for
right now, notice when you may have to start to move activities. On
day 5 the required resource is 144 (I know it’s hard to see). This is
larger than 58, so we would see what activities could be moved.
Obviously, if an activity is critical or has already started it would seem
less likely that these activities could be delayed and moved
downstream. Consequently, attention must be focused on activities
that begin on Day 5 and have total float. Well that’s how the
algorithm works and how the computer moves day by day through the
network.
Having leveled this project before I know that 60 is a better level than
58. So here’s what happens in Primavera for leveling. First select
TOOLS from the upper menu bar then select LEVELING.
Primavera Lab Manual - Version 4 Spring 1999
45
Or use Shift +
F9
A new screen will appear that invites selection.
Here there are a lot of choices, forward leveling vs. backward leveling,
smoothing, leveling for the entire or partial project, and prioritization.
To begin with, leave everything as the default. Double click on the
RESOURCES button on the right side of the screen and you’ll see:
Once a resource has been selected, the LIMITS button will be
activated. Click to see:
Primavera Lab Manual - Version 4 Spring 1999
46
Clicking on
the “+” will
give you a list
of your
resources.
For this
project we’ll
be using MH
for man-
hours.
The Normal limit should be set at the value you have selected to try to
achieve (here 60), while the Maximum limit should be set higher that
the highest peak on your resource histogram. One hundred fifty is
higher than the maximum of 144 on this project. Once you identify
these limits, Click on OK as you back out of the levels you have
entered. This will commence the leveling process. A report (Leveling
Report) is
automatically generated
. This is one of the reports you will
be required to submit with your project, so pay special attention to its
contents. The following two pages are a partial printout of the leveling
report. Notice that there are two special column categories: Delayed
by Pred. and Delayed by Res. As you can likely see, any activity with
information in either of these columns has been affected by the
leveling process. When doing your project be sure that several
activities move. For the project the concern is not with improving the
profile necessarily, but instead with understanding the process and
evaluating the results. In the report that follows many activities
moved.
Primavera Lab Manual - Version 4 Spring 1999
47
This is not the same project shown on previous pages but uses 46 as
the Normal limit and 120 as the Maximum limit.
Primavera Lab Manual - Version 4 Spring 1999
48
Leveling Test Primavera Project Planner Starr Distribution Warehouse
Report Date 16SEP98 12:33 Forward Resource Leveling Analysis Report Start Date 08OCT97 Fin Date 06MAR98
Data Date 08OCT97 Page no. 2
Daily Res Rem Early Start Delayed by Pred Delayed by Res Early Leveled
Activity Id Resource Usage Lag Dur Date Tf Norm Max Date Tf Norm Max Date Tf Norm Max Start Finish
10 Delivery and setup o 1 08OCT97 0 08OCT97 08OCT97
MH 16.0 1 08OCT97 46.0 120.0 08OCT97 08OCT97
20 Delivery of storage 1 08OCT97 0 08OCT97 08OCT97
MH 16.0 1 08OCT97 30.0 104.0 08OCT97 08OCT97
30 Clear and grub 2 09OCT97 0 09OCT97 10OCT97
MH 10.0 2 09OCT97 46.0 120.0 09OCT97 10OCT97
40 Survey 3 13OCT97 0 13OCT97 15OCT97
MH 48.0 3 13OCT97 46.0 120.0 13OCT97 15OCT97
50 Structural fill 2 16OCT97 0 16OCT97 17OCT97
MH 24.0 2 16OCT97 46.0 120.0 16OCT97 17OCT97
60 Water & compact 1 20OCT97 0 20OCT97 20OCT97
MH 16.0 1 20OCT97 46.0 120.0 20OCT97 20OCT97
70 Machine grading 1 21OCT97 0 21OCT97 21OCT97
MH 8.0 1 21OCT97 46.0 120.0 21OCT97 21OCT97
80 Hand grading 2 22OCT97 0 22OCT97 23OCT97
MH 24.0 2 22OCT97 46.0 120.0 22OCT97 23OCT97
90 Install undr.grnd.pl 3 29OCT97 0 29OCT97 31OCT97
MH 48.0 3 29OCT97 46.0 120.0 29OCT97 31OCT97
130 Machine excavate con 1 28OCT97 4 28OCT97 28OCT97
MH 8.0 1 28OCT97 46.0 120.0 28OCT97 28OCT97
100 Machine excavate for 2 24OCT97 6 24OCT97 27OCT97
MH 8.0 2 24OCT97 46.0 120.0 24OCT97 27OCT97
140 Hand excavate contin 1 29OCT97 4 03NOV97 1 03NOV97 03NOV97
MH 24.0 1 29OCT97 0.0 72.0 03NOV97 46.0 120.0 03NOV97 03NOV97
150 Install forms & reba 3 05NOV97 0 05NOV97 07NOV97
MH 32.0 3 05NOV97 46.0 120.0 05NOV97 07NOV97
110 Hand excavate for sp 1 28OCT97 6 28OCT97 28OCT97
MH 16.0 1 28OCT97 38.0 112.0 28OCT97 28OCT97
120 Install rebar & anch 2 29OCT97 6 03NOV97 3 03NOV97 04NOV97
MH 32.0 2 29OCT97 0.0 72.0 03NOV97 22.0 96.0 03NOV97 04NOV97
160 Pour concrete footin 2 10NOV97 0 10NOV97 11NOV97
MH 40.0 2 10NOV97 46.0 120.0 10NOV97 11NOV97
190 Crane lift & place s 3 13NOV97 0 13NOV97 17NOV97
MH 32.0 3 13NOV97 46.0 120.0 13NOV97 17NOV97
170 Remove forms 1 12NOV97 5 12NOV97 12NOV97
MH 24.0 1 12NOV97 46.0 120.0 12NOV97 12NOV97
180 Backfill footings 1 13NOV97 5 18NOV97 2 18NOV97 18NOV97
MH 24.0 1 13NOV97 14.0 88.0 18NOV97 46.0 120.0 18NOV97 18NOV97
200 Install edge forms 2 21NOV97 0 21NOV97 24NOV97
MH 24.0 2 21NOV97 46.0 120.0 21NOV97 24NOV97
210 Place ABC 1 25NOV97 1 25NOV97 25NOV97
MH 24.0 1 25NOV97 46.0 120.0 25NOV97 25NOV97
220 Grade & compact ABC 1 26NOV97 1 26NOV97 26NOV97
MH 16.0 1 26NOV97 46.0 120.0 26NOV97 26NOV97
230 Place welded wire fa 1 01DEC97 1 01DEC97 01DEC97
MH 24.0 1 01DEC97 46.0 120.0 01DEC97 01DEC97
Primavera Lab Manual - Version 4 Spring 1999
49
Leveling Test Primavera Project Planner Starr Distribution Warehouse
Report Date 16SEP98 12:33 Forward Resource Leveling Analysis Report Start Date 08OCT97 Fin Date 06MAR98
Data Date 08OCT97 Page no. 3
Daily Res Rem Early Start Delayed by Pred Delayed by Res Early Leveled
Activity Id Resource Usage Lag Dur Date Tf Norm Max Date Tf Norm Max Date Tf Norm Max Start Finish
240 Pour slab on grade 3 03DEC97 0 03DEC97 05DEC97
MH 48.0 3 03DEC97 46.0 120.0 03DEC97 05DEC97
250 Erect tilt-up walls 15 08DEC97 0 08DEC97 29DEC97
MH 64.0 15 08DEC97 46.0 120.0 08DEC97 29DEC97
260 Place masonry block 3 08DEC97 12 08DEC97 10DEC97
MH 40.0 3 08DEC97 0.0 56.0 08DEC97 10DEC97
270 Install ledger angle 2 30DEC97 0 30DEC97 31DEC97
MH 32.0 2 30DEC97 46.0 120.0 30DEC97 31DEC97
280 Place glue lam beams 3 02JAN98 0 02JAN98 06JAN98
MH 32.0 3 02JAN98 46.0 120.0 02JAN98 06JAN98
340 Install metal stairs 2 15DEC97 12 30DEC97 2 30DEC97 31DEC97
MH 32.0 2 15DEC97 0.0 56.0 30DEC97 14.0 88.0 30DEC97 31DEC97
290 Place wood joists 2 02JAN98 1 02JAN98 05JAN98
MH 32.0 2 02JAN98 14.0 88.0 02JAN98 05JAN98
300 Install trusses 3 07JAN98 0 07JAN98 09JAN98
MH 32.0 3 07JAN98 46.0 120.0 07JAN98 09JAN98
320 Build wall partition 2 19DEC97 12 06JAN98 2 06JAN98 07JAN98
MH 24.0 2 19DEC97 0.0 56.0 06JAN98 14.0 88.0 06JAN98 07JAN98
380 Run electrical condu 10 12JAN98 0 12JAN98 23JAN98
MH 64.0 10 12JAN98 46.0 120.0 12JAN98 23JAN98
310 Install plywood 2 12JAN98 8 12JAN98 13JAN98
MH 24.0 2 12JAN98 0.0 56.0 12JAN98 13JAN98
350 Install metal roof 3 14JAN98 8 26JAN98 0 26JAN98 28JAN98
MH 48.0 3 14JAN98 0.0 56.0 26JAN98 46.0 120.0 26JAN98 28JAN98
370 Installation of gutt 1 19JAN98 10 29JAN98 2 29JAN98 29JAN98
MH 24.0 1 19JAN98 0.0 56.0 29JAN98 46.0 120.0 29JAN98 29JAN98
390 Install blowers, com 2 03FEB98 0 03FEB98 04FEB98
MH 32.0 2 03FEB98 46.0 120.0 03FEB98 04FEB98
360 Apply waterproofing 2 21JAN98 9 02FEB98 1 02FEB98 03FEB98
MH 32.0 2 21JAN98 0.0 56.0 02FEB98 46.0 120.0 02FEB98 03FEB98
430 Paint exterior 3 05FEB98 0 05FEB98 09FEB98
MH 24.0 3 05FEB98 46.0 120.0 05FEB98 09FEB98
470 Install landscape ir 3 10FEB98 0 10FEB98 12FEB98
MH 40.0 3 10FEB98 46.0 120.0 10FEB98 12FEB98
480 Plant trees, shrubbe 4 13FEB98 0 13FEB98 18FEB98
MH 40.0 4 13FEB98 46.0 120.0 13FEB98 18FEB98
490 Place ABC for asphal 2 19FEB98 0 19FEB98 20FEB98
MH 32.0 2 19FEB98 46.0 120.0 19FEB98 20FEB98
560 Install above grnd. 3 23DEC97 41 08JAN98 31 05FEB98 11 05FEB98 09FEB98
MH 48.0 3 23DEC97 0.0 56.0 08JAN98 14.0 88.0 05FEB98 22.0 96.0 05FEB98 09FEB98
500 Grade ABC 1 23FEB98 0 23FEB98 23FEB98
MH 16.0 1 23FEB98 46.0 120.0 23FEB98 23FEB98
410 Place wall insulatio 3 26JAN98 20 23FEB98 0 23FEB98 25FEB98
MH 24.0 3 26JAN98 0.0 72.0 23FEB98 30.0 104.0 23FEB98 25FEB98
510 Place asphalt cement 2 24FEB98 0 24FEB98 25FEB98
MH 48.0 2 24FEB98 22.0 96.0 24FEB98 25FEB98
Notice the how the network has changed. Activity 180, Backfill
Footings has lost 3 days of float although it has not become critical.
May other activities have lost total float too.
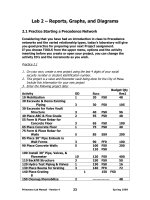
Practice 3.1
1. Input the activities, resources, and relationships found on page 51.
2. Calculate the network, then find the project duration in workdays, and the
total number of man-hours.
3. Run and printout a Daily MH histogram (Original MH histogram), write out on
the histogram the average man-hours per day. Label the histogram
appropriately. Name the histogram as “Original Daily MH Histogram.”
Primavera Lab Manual - Version 4 Spring 1999
50
3.2 Leveling and Comparing to Targets
Before we level the project, let’s make a copy of the current schedule;
a baseline so that we can compare it with future schedules. To create
a target, select the Tools, Project Utilities, Target from the upper
menu.
Then name your target, 4 characters – make it unique.
Primavera Lab Manual - Version 4 Spring 1999
51
G H 3.3 Input a New Network
A B C I J SS9 K FF0 M S
SS0
SS3
D FF2 E
L N P Q FF0 R
SS1 FS2
F O
The duration and total budget resource data for above activities are listed in the following table
Act. ID Act. Name Dur. (day) MH Act. ID Act. Name Dur.(day) MH Act. ID Act. Name Dur. (day) MH
10 A 1 48 80 H 3 100 150 O 3 27
20 B 3 105 90 I 1 40 160 P 1 16
30 C 3 96 100 J 5 200 170 Q 3 72
40 D 4 100 110 K 3 100 180 R 1 8
50 E 2 36 120 L 4 64 190 S 3 50
60 F 6 96 130 M 5 200 200 T 2 48
70 G 2 48 140 N 10 400
Primavera Lab Manual - Version 4 Spring 1999
T
52
Remember that you MUST copy your original schedule to a target file
before leveling. This baseline schedule (target) will give you a point of
comparison for future schedules. The target file must have a different
name than your original schedule. To create a Target File, select
TOOLS from the upper menu, then select PROJECT UTILITIES, and
lastly, select TARGETS. Enter a new name for your target file, 4
characters - make it unique. Click on OK. The computer will grind and
finally leave you in the project. Now you have a target schedule –
Let’s move on to leveling.
Practice 3.2
1. Determine an appropriate level to begin leveling (show your calculations on
the Histogram). Make your normal limit slightly higher than the average
(Total MH/Project duration and the maximum higher than the highest peak
also from Practice 3.1.
2. Level the network using the procedure described on pages 45 to 47. Review
the leveling report. If some activities have moved, print the leveling report
and move to 3. If not, establish a new normal limit and try again.
3. Run an Early Start Report that compares the leveled dates with the original
dates in the Target. See the screen shown below
.
Primavera Lab Manual - Version 4 Spring 1999
53
4. Run a leveled, detailed relationship report. Explain how this report is
different than the one run in LAB 2.
5. Run a daily MH histogram of the leveled project. Label the peaks and
histogram appropriately. Name the current histogram “Level Daily MH
Histogram.”
6. Run an S-curve with early, late, and target early and target late lines. Be
sure that the lines are distinguishable by using different patterns, weights,
colors, etc. Annotate the S-curve with words and arrows so that everything
can easily be understood.
Turn in the following at the end of LAB 3:
1. List of activities which have been affected by leveling 3.1
2. Original daily MH histogram 3.2
3. Early start report comparing leveled and target 3.3
4. Leveled detailed relationship report 3.3
5. Leveled daily MH histogram 3.3
6. S-curve, leveled and target 3.3
Primavera Lab Manual - Version 4 Spring 1999
54