antigen processing and presentation protocols
Bạn đang xem bản rút gọn của tài liệu. Xem và tải ngay bản đầy đủ của tài liệu tại đây (1.15 MB, 262 trang )
Methods in Molecular Biology
TM
HUMANA PRESS
HUMANA PRESS
Methods in Molecular Biology
TM
Edited by
Joyce C. Solheim
Antigen
Processing
and Presentation
Protocols
VOLUME 156
Antigen
Processing
and Presentation
Protocols
Edited by
Joyce C. Solheim
Proteasome Purification 1
1
Purification of 20S Proteasomes
Jill R. Beyette, Timothy Hubbell, and John J. Monaco
1. Introduction
Proteasomes are large multicatalytic proteinases located in the nuclei and
cytoplasm of all eukaryotic cells. Proteasomes are composed of four heptameric
rings stacked to form a hollow cylinder (length 16–20 nm, diameter 11–12
nm). The outer two rings are composed of α-subunits, while β-subunits, which
contain the active sites, comprise the inner two rings. Proteasomes from
archaebacteria contain only one type each of α- and β-subunits. Eukaryotic
proteasomes are more divergent; yeast proteasomes have seven different α-
and seven different β-subunits, each occupying a unique position in the ring.
Only three of the seven yeast β-subunits contain the N-terminal threonine nec-
essary for activity (1–2).
Mammalian 20S proteasomes have seven different α- and ten different
β-subunits, and have been classified into two groups. The so-called “constitu-
tive” proteasomes contain three catalytic β-subunits: PSMB5 (X or MB1),
PSMB6 (Y or δ), and PSMB7 (Z). These subunits can be replaced in “immu-
noproteasomes” by the IFN-γ-inducible catalytic β-subunits PSMB8 (LMP7),
PSMB9 (LMP2), and PSMB10 (MECL-1), respectively (1–3). Although there
are eight possible combinations of catalytic subunits in the β rings, proteasomes
with mixtures of constitutive and immune subunits are not favored (4). Replace-
ment of constitutive catalytic subunits with the IFN-γ-inducible subunits has
been shown to change the proteasome activities against fluorogenic peptide
and protein substrates (2,5). It has been shown that proteasomes are respon-
sible for generation of cytosolic peptides 7–13 amino acids in length, which
are presented on cell surfaces in association with major histocompatibility com-
plex class I (MHC-I) molecules (1,3). The IFN-γ-inducible subunits are not
essential for MHC-I antigen presentation, but it is thought that the additional
1
From:
Methods in Molecular Biology, vol. 156: Antigen Processing and Presentation Protocols
Edited by: J. C. Solheim © Humana Press Inc., Totowa, NJ
2 Beyette, Hubbell, and Monaco
peptide diversity resulting from the presence of immunoproteasomes increases
antigen presentation efficiency and/or repertoire, thus enhancing the immune
response. Not only do proteasomes produce peptides for MHC-I presentation,
but they are the primary nonlysosomal protein degradation machinery in
eukaryotic cells, and are important in cell cycle regulation and transcription
factor activation as well.
Although both types of proteasomes are present to some degree in almost
every tissue (6), mouse livers are highly enriched in constitutive proteasomes,
and bovine pituitary proteasomes have almost no inducible subunits (5). In
addition, a homogeneous population of constitutive proteasomes can be puri-
fied from mouse H6 cells grown in the absence of IFN-γ (7). On the other hand,
preparations from spleens are highly enriched in immunoproteasomes (5). Fur-
ther enrichment can be obtained by hydrophobic interaction column (HIC)
chromatography (8).
Proteasomes are easy to purify, because they are relatively stable, they are
present in large quantities in most tissues, and, since they are much larger (750
kDa) than most other cellular proteins, they can be separated from the bulk of
cellular constituents early in the purification. Many different protocols are
available for proteasome purification (8–19); among these, three different pro-
tein purification strategies are common: separation based on size (such as gel
filtration chromatography or ultracentrifugation), anion exchange chromatog-
raphy, and hydrophobic interaction chromatography. Based on these three strat-
egies, the method described here has been used to generate proteasomes that
are 95–99% pure, from mouse livers, spleens, and muscles. Generally, 3 mg
proteasomes can be purified from 20 g mouse spleens, a yield consistent with
other reports (8–19). Moreover, because proteasome structure is highly con-
served from yeast to human, the following method should be easily adaptable
to proteasome purification from other tissues and species.
The first day of purification involves collection of the tissues, homogeniza-
tion, and centrifugation. The homogenization buffer includes 150 mM NaCl to
reduce nonspecific interactions, and to help dissociate 20S proteasomes from
the PA28 proteasome activator (20). Two successive centrifugations yield cell
lysates cleared of cellular debris, mitochondria and other organelles. A final
5-h ultracentrifugation step pellets the 20S proteasomes, while leaving smaller
cell matrix proteins in the supernatant. The pellet is then suspended in buffer,
and proteasomes are fractionated from contaminants through successive anion-
exchange and HIC chromatography steps.
The anion-exchange column chromatography step is accomplished using a
diethylaminoethyl (DEAE)-Sepharose matrix. In buffer B at pH 7.7 (see Sub-
heading 2.1., step 5), proteasomes have a net negative charge, and bind the
column matrix. More positively charged proteins pass through. As the salt con-
Proteasome Purification 3
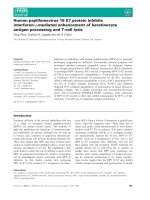
Fig. 1. SDS-PAGE of samples from each step of proteasome purification. The fol-
lowing samples were separated by standard SDS-PAGE on a 12% polyacrylamide
gel, and stained with 0.1% Coomassie Brilliant Blue R250. (A) Benchmark Prestained
Protein Ladder (Gibco-BRL, Rockville, MD, 10 µL); (B) homogenate (50 µg); (C)
10,000g supernatant (50 µg); (D) 1-h 100,000g supernatant (50 µg); (E) 5-h 100,000g
pellet (35 µg); (F) DEAE active fractions (15 µg); (G) HIC active fractions (5 µg).
The bracket indicates the position of proteasome bands in the gel. Molecular masses of
the ladder proteins are indicated at left.
centration of the buffer increases during the gradient elution step, proteins of
increasingly negative charge are eluted from the column, providing the basis
for purification. It is evident from Coomassie-stained sodium dodecyl sulfate-
polyacrylamide gel electrophoresis (SDS-PAGE) of the pooled fractions
(Fig. 1, lane F) that most of the contaminants are removed by DEAE-Sepharose
chromatography (Fig. 2). The remaining contaminants are removed from the
proteasomes by HIC chromatography (Fig. 3). Hydrophobic proteins bind to
the matrix when in contact with a high-salt buffer; less hydrophobic proteins
pass through. As the salt concentration (and thus polar quality) of the buffer on
the column is decreased with a reverse salt gradient, proteins of an increasingly
hydrophobic nature are able to pass into the buffer and elute from the column.
Proteasome activity elutes from the HIC column coinciding with a single, iso-
lated peak of protein (Fig. 3), which contains only proteasome proteins (Fig. 1,
lane G). When the purified 700 kDa enzyme is separated on a denaturing
SDS-PAGE gel stained with Coomassie Brilliant Blue, multiple protein bands
4 Beyette, Hubbell, and Monaco
are visible in the range of 22–35 kDa. Although preparations of pure eukary-
otic proteasomes contain at least 14 different subunits, not all of these may be
visible as distinct protein bands on Coomassie-stained SDS-PAGE gels,
because of their similarity in molecular weight.
Several things are apparent when examining the proteasome purification
table (Table 1) and the SDS-PAGE gel (Fig. 1). The initial centrifugation steps
are required to remove insoluble material, and to concentrate the material for
subsequent purification. However, these steps do not result in a great overall
enrichment for proteasomes. After the 5-h centrifugation step, there is a great
reduction in the amount of protein present, as well as in total proteasome activ-
Fig. 2. DEAE column chromatography. The 5-h pellet was dissolved in buffer, cen-
trifuged, and loaded onto the DEAE-Sepharose column. Bound proteins were eluted
with a NaCl gradient (—). Samples (35 µL of each 4.5 mL fraction) were tested for
LLVY-AMC hydrolysis (o o). A small amount of activity in the void peak may indi-
cate the presence of proteasomes, possibly because the amount of protein in the start-
ing material exceeded the binding capacity of the column. The proteasome eluted at
250–350 mM NaCl. Relative protein content (—) showed that the major protein con-
taminants were excluded from the pooled active fractions (fractions 97–110). Note
that some active fractions on either side of the peak were not pooled, in favor of reduc-
ing contaminating proteins. We have shown with SDS-PAGE that, if DEAE-Sepharose
proteasomes fractions are pooled too widely, the purified mouse liver and spleen
proteasomes contain contaminants between 60 and 80 kD.
Proteasome Purification 5
ity. The yields in the first three steps are elevated by the presence of activators
relative to the yields in the final three steps, because of the separation of
proteasomes from PA28 and other lower-mol-wt activators after step 3.
Although most activity remained in the 5-h supernatant, quantitative Western
blotting indicates that approx 60% of the proteasomes from the 1-h supernatant
are recovered in the 5-h pellet (data not shown). As evidenced by both the
purification table and the gel, the greatest improvements in purification occur
during the chromatography steps, resulting in a 54-fold final purification.
At each purification step, the fraction containing proteasomes is determined
by an assay for hydrolysis of fluorogenic peptides. Three proteasome activities,
corresponding to the three active β-subunits, are commonly assayed. Subunits Z
or MECL-1 are responsible for the trypsin-like activity, which cleaves peptides
on the carboxyl side of a basic residue (lysine or arginine). Subunits X or LMP 7
are responsible for the chymotrypsin-like activity, which cleaves after a hydro-
Fig. 3. HIC column chromatography of proteasomes from DEAE-Sepharose. Pooled
DEAE-Sepharose fractions were brought to 1.7 M (NH
4
)
2
SO
4
and loaded onto an HIC
column equilibrated with 1.2 M (NH
2
)
2
SO
4
. Bound proteins were eluted with an
(NH
2
)
2
SO
4
gradient (—). Each fraction (4.5 mL) was buffer exchanged, and 35 µL
were tested for LLVY-AMC hydrolysis (o o). The major activity eluted between 0.9
and 0.6 M (NH
2
)
2
SO
4
coincident with a single peak of protein (—). Nearly the entire
proteasome activity peak was pooled (fractions 60–75).
6 Beyette, Hubbell, and Monaco
phobic residue (e.g., tyrosine, phenylalanine, leucine, or tryptophan). Subunits δ
or LMP 2 are responsible for the peptidyl-glutamyl-peptide bond-hydrolyzing
(PGPH) activity, which cleaves after acidic residues (glutamate or aspartate). Com-
mon substrates used for these activities are, respectively, N-t-BOC-Leu-Arg-Arg-
7-amido-4-methylcoumarin (LRR-AMC), N-succinyl-Leu-Leu-Val-Tyr-7-amido-
4-methylcoumarin (LLVY-AMC), and N-CBZ-Leu-Leu-Glu-β-naphthylamide
(LLE-βNA). The fluorogenic groups of these substrates, 7-amino-4-methyl-
coumarin or β-naphthylamide, increase in fluorescence when released from the
peptide by proteolysis. Bulky groups (N-tert-butoxy-carbonyl [N-t-BOC], N-suc-
cinyl, or benzyloxycarbonyl [N-CBZ]) which block the peptide substrates at the
amino terminus, render them indigestible by aminopeptidases, and help to identify
proteasome activity in impure fractions.
Proteasomes are often referred to as “latent” or “active” (21). Upon activa-
tion, one or more of the activities of latent proteasomes, especially a protein-
Table 1.
Purification of Proteasomes from 220 B6 Mouse Spleens (19.0 g)
Purification step Protein Specific Purification Total Yield
(mg) activity
a
factor (X) activity
b
(%)
Homogenate 2860 4.0 1.0 11440 100
10,000g supernatant 1739 4.8 1.2 8365 73
1-h 100,000g supernatant 1490 5.3 1.3 7942 69
5-h 100,000g supernatant
c
1280 3.7 0.9 4672 41
5-h 100,000g pellet 145 12.6 3.2 1828 16
d
DEAE active fractions 18 36.4 9.1 675 5.9
HIC active fractions 2.1 217 54.2 383 3.3
a
nmol LLVY-AMC hydrolyzed/mg protein/h.
b
nmol LLVY-AMC hydrolyzed/h.
c
The 5-h 100,000g supernatant was not used for proteasome purification. The data for this
fraction was included only to enable comparison of the 1-h supernatant and the 5-h supernatant
and pellet.
d
20S proteasome protein recovery from the 1-h 100,000g supernatant (assayed by quantita-
tive Western blotting) during this step is approx 60%. The recovery of activity is artificially
depressed by loss of the proteasome activator, PA28, during this step.
Proteasome Purification 7
degrading activity, may dramatically increase. Activation can be caused by a
variety of treatments (i.e., incubation with KCl, low concentrations of SDS or
lipids, dialysis against water, or heat treatment) and the activities that are
affected seem to differ, depending on starting material and purification proce-
dure. The mechanism of proteasome activation is unknown, but evidence sug-
gests that proteasome activation is accompanied by conformational changes or
by proteolytic cleavage. Including 15–20% glycerol in all buffers during
proteasome purification helps to maintain proteasomes in a latent state (6).
Because glycerol also increases proteasome stability and yield, we have
included 15–20% glycerol in all purification steps after homogenization. This
must be diluted or removed in order to measure proteasome activity.
Using the following method, proteasomes can easily be purified with stan-
dard chromatography equipment in 5 working days, or considerably less time
if fast protein liquid chromatography (FPLC) or high performance liquid
chromatography (HPLC) is used. The method has been organized into 1-d
steps, although it is not difficult to find alternate stopping points, if neces-
sary. Equivalent column chromatography methods for FPLC or HPLC are
included in Notes 2 and 6.
2. Materials
2.1. Homogenization and Centrifugation
1. Stainless steel scissors and other tools necessary for dissection and tissue
collection.
2. Buffer A (250 mL): 50 mM Tris-HCl, pH 7.5, 250 mM sucrose, 150 mM NaCl.
Make fresh, keep chilled on ice.
3. Tissue homogenizer with a saw-tooth generator appropriate for homogenizing
tissue and fibrous materials (e.g., PowerGen Model 125, Fisher Scientific,
Pittsburgh, PA).
4. Ultracentrifuge capable of centrifugation at 100,000g, and ultracentrifuge tubes.
5. Buffer B (20 mL): 20 mM triethanolamine (TEA) (Sigma, St. Louis, MO), pH 7.7,
150 mM NaCl, 15% glycerol. Make 2 L; the remainder will be used in Subheading
3.2, step 1.
2.2. DEAE-Sepharose Column Preparation and Chromatography
1. Buffer B (2 L, see above).
2. Buffer C (1 L): 20 mM TEA, pH 7.7, 500 mM NaCl, 15% glycerol.
3. Buffer D (200 mL): 20 mM TEA pH 7.7, 1 M NaCl.
4. DEAE-Sepharose Fast Flow anion-exchange column chromatography matrix
(Pharmacia), approximately 65 mL.
5. Chromatography column: 35 cm length × 1.6 cm inner diameter, volume = 70 mL.
6. Peristaltic pump.
8 Beyette, Hubbell, and Monaco
7. UV monitor, chart recorder, and fraction collector.
8. Gradient maker.
2.3. Assay for Peptidase Activity
1. N-succinyl-Leu-Leu-Val-Tyr-7-amido-4-methylcoumarin (Sigma): Make 3 mM
solution in dimethylsulfoxide (DMSO), and store at –20°C.
2. N-t-BOC-Leu-Arg-Arg-7-amido-4-methylcoumarin (Sigma): Make 4 mM solu-
tion in DMSO, and store at –20°C.
3. N-CBZ-Leu-Leu-Glu-β-naphthylamide (Sigma): Make 5 mM solution in DMSO
and store at –20°C.
4. 7-amino-4-methylcoumarin (Sigma).
5. Apyrase (Sigma): Make 50 U/mL solution in 1X assay buffer (see step 6) and
store at –20°C.
6. 5X assay buffer: 250 mM Tris-HCl, pH 8.3 at 25°C, 50 mM MgCl
2
. Store at 4°C
for up to 3 mo.
7. 96-well microtiter plates.
8. Fluorescent plate reader (e.g., CytoFluor 4000, PE Biosystems, Framingham,
MA). Excitation and emission filters are required: 370 and 430 nm, respectively,
for measurement of AMC-containing substrates, or 333 and 450 nm, respectively,
for measurement of βNA-containing substrates.
2.4. HIC Chromatography
1. Buffer E: 20 mM Tris-HCl, pH 7.0, 1.2 M ammonium sulfate (NH
4
)
2
SO
4
.
2. Buffer F: 20 mM Tris-HCl, pH 7.0, 0.2 M (NH
4
)
2
SO
4.
3. Buffer G: 20 mM Tris-HCl, pH 7.0.
4. HIC matrix: phenyl-650M (Toyopearl, Montgomeryville, PA), approx 20 mL.
5. Column: 12 cm length × 1.6 cm id, volume = 24 mL.
6. (NH
4
)
2
SO
4.
7. Glycerol.
8. Gradient maker.
2.5. Buffer Exchange of HIC Fractions for Assay
1. Buffer-exchange spin columns (e.g., Bio-Spin Chromatography Columns, Bio-
Rad, Hercules, CA).
2. Buffer B.
2.6. Protein Concentration, Determination, and Storage
1. Enzyme dilution buffer: 50 mM Tris-HCl pH 7.5, 20% glycerol, 5 mM MgCl
2
.
2. Protein determination reagent (e.g., Bio-Rad Protein Assay, Bio-Rad).
3. Bovine serum albumin (0.5 mg/mL), or other suitable protein standard for pro-
tein determination.
4. Protein concentration devices (e.g., Centriplus 50 concentration devices, Amicon,
Beverly, MA).
Proteasome Purification 9
3. Method
3.1. Day 1: Homogenization and Centrifugation
For the highest possible yield of proteasomes, all purification steps should
be performed as rapidly as possible at 4°C, and chill all buffers and equipment
that will contact proteasome preparation. The following method assumes 30 g
of mouse livers as a starting material. The process can be easily scaled for
much larger or smaller amounts of starting material by adjusting buffer amounts
and column sizes proportionally. Step 1 requires 8–10 h to complete, and can
be finished in 1 d.
1. Obtain the starting material from freshly collected and euthanized animals, plants,
or cell cultures; rinse in three changes of ice-cold buffer A, and store in ice-cold
buffer A for a few minutes, until homogenization. Alternatively, tissues may be
frozen until use (see Note 1).
2. Weigh the tissue to be homogenized. Add ice-cold buffer A in a ratio of 10 mL/g
of tissue, and mince tissues with scissors in the buffer.
3. Separate mixture into 100-mL batches in beakers. Homogenize tissues with a
tissue homogenizer at medium speed for 30 s, then place beaker on ice for 30 s.
Repeat 3X; avoid foaming or warming the mixture. For larger volumes or tougher
tissues, perform the same procedure in a Waring blender (four 1-min bursts with
30-s extraction intervals on ice.)
4. To clear the cell lysate of nuclei and other debris, centrifuge the homogenate at
10,000g (20 min).
5. Centrifuge the homogenate supernatant in an ultracentrifuge at 100,000g (1 h) to
remove organelles.
6. Centrifuge the 100,000g supernatant in an ultracentrifuge at 100,000g (5 h). Dur-
ing this step, the proteasomes are pelleted. When starting with mouse livers or
spleens, the pellet is a clear, reddish gel.
7. Remove the supernatant with a pipet, and gently suspend the pellet into 15 mL
buffer B with an ice-cold Dounce homogenizer. Avoid introducing bubbles or
foam, which will denature proteins in the suspension. Keep the suspension on ice
overnight.
3.2. Day 1: DEAE-Sepharose Column Preparation
and Equilibration
Column preparation is most efficiently accomplished during the long cen-
trifugation steps of the first day. The second day can then be devoted to DEAE-
Sepharose chromatography and peptidase assays.
1. Assemble the following apparatus at 4°C in a walk-in or chromatography refrigerator.
2. Standardize the peristaltic pump so that flow can be accurately measured between
0.1 and 2 mL/min. Select a tubing setup that can easily be attached and removed
from the column without introducing air bubbles into the column matrix.
10 Beyette, Hubbell, and Monaco
3. Set up the pump, column, UV monitor, fraction collector, and chart recorder.
4. Pack and prepare the column according to the manufacturer’s instructions. Matrix
capacity depends on the amount of proteins in the sample that bind at the buffer pH
(7.7 in this case), therefore determination of necessary column size is empirical.
However, the column capacity for thyroglobulin, which has a comparable molecu-
lar mass to proteasomes, is 3.1 mg protein/mL of matrix. We find 65 mL of matrix
is sufficient when purifying proteasomes from 30 g of mouse livers.
5. Equilibrate the column with buffer B at approx 1 mL/min. Alternatively, the col-
umn can be equilibrated overnight at a very slow flow rate (0.l mL/min). Be sure
to have sufficient buffer in the reservoir, so that the column will not run dry, in
which case it will need to be repacked. The column is equilibrated when the
effluent pH is equal to the pH of buffer B entering the column, and the baseline
of the chart recorder becomes flat. Five column vol are usually sufficient.
3.3. Day 2: DEAE-Sepharose column chromatography
Alternative method for FPLC/HPLC users (see Note 2):
1. We find that, as the proteasome suspension sits on ice overnight, a white precipi-
tate forms that contains very little proteasome activity. Remove the precipitate
by centrifugation at 10,000g (20 min).
2. Set the UV monitor sensitivity at full-scale (absorbance unit range = 2.0). Using
the chart recorder at 1 mm/min, record the UV absorbance while the column is
equilibrating.
3. When the column is equilibrated, load the proteasome suspension from step 1
onto the column at a relatively slow flow rate (0.5 mL/min). If the column size
has been scaled up or down, adjust the flow rate accordingly. In general, larger
diameter columns can sustain a greater flow rate.
4. Once the sample is loaded, wash the column in buffer B at a flow of 1.5 mL/min.
5. An increase in the absorbance units at 280 nm, seen as a peak on the chart re-
corder trace, indicates unbound protein flowing through the column. Collect this
void peak in a beaker on ice until the chart recorder trace returns to baseline.
Save the void peak to assay for proteasome activity.
6. While collecting the void peak, prepare 0–500 mM NaCl gradient (see Note 3).
7. Once the trace returns to baseline, start the gradient, and collect 7-mL fractions
in 13 × 100 mm test tubes. The proteasomes elute from the column after one-
third of the gradient has entered the column. Keep the fractions covered at 4°C.
8. After completing the gradient, wash the column with buffer C until the chart
recorder trace returns to baseline.
9. Wash the column with buffer D to elute any tightly bound proteins, and store the
column in 20% EtOH at 4°C.
3.4. Day 2: Assay for Peptidase Activity
1. Every second fraction should be tested for LLVY-AMC-hydrolyzing activity.
Assign each fraction to be tested to a well of a 96-well microtiter plate. Addition-
ally, include two wells for a negative control.
Proteasome Purification 11
2. Into each well, add 5X assay buffer (10 µL), 3 mM LLVY-AMC substrate (5
µL), and, last, DEAE fraction (35 µL). The negative control receives 35 µL of
buffer B instead of sample.
3. Cover microtiter plate and incubate at 37°C for 30 min.
4. If the plate will not be read immediately on a fluorescence plate reader, then stop
hydrolysis with 150 µL cold EtOH (95%).
5. Read the plate with a fluorescence plate reader (370 nm excitation filter, 430 nm
emission filter for LLVY-AMC and LRR-AMC; 333 nm excitation filter,
450 nm emission filter for LLE-βNA). At the time the assays are performed, a
standard curve for the instrument (AMC concentration [nm] vs fluorescence
units) should be prepared with several concentrations of 7-amino-4-methyl-
coumarin (AMC) (i.e., in a range of 0–1.0 nmol/well). Because the fluorescence
readings are dependent on the UV source intensity, which deteriorates with time,
these standard curves should be prepared frequently.
6. Subtract the background fluorescence (negative control values) from each well.
7. To ensure that the substrate is present in saturating quantities, the fluorescence
values of active fractions should increase proportionally with the amount of sample.
8. Pool the fractions containing proteasome activity. If there is more than one peak,
it may be worth assaying the fractions for LLE-AMC and LRR-AMC hydrolysis
to determine which is the proteasome peak (see Note 4). For details on deciding
which fractions to pool, refer to Note 5 and Fig. 2.
9. Store the pooled fractions overnight on ice.
3.5. Day 3: HIC Chromatography
Alternative method for FPLC/HPLC users (see Note 6):
This is the final step in the proteasome purification. In liver, spleen, and
muscle, if column fractions have been pooled conservatively, no contaminants
are visible on one-dimensional (see Fig. 1) and two-dimensional Coomassie-
stained SDS-PAGE gels. The HIC column chromatography step takes 6–8 h.
1. Prepare and equilibrate the HIC column (see Note 7).
2. Slowly add (NH
4
)
2
SO
4
directly to pooled DEAE fractions to a final concentra-
tion of 1.7 M (add 0.225 g [NH
4
]
2
SO
4
), mixing continuously at 4°C, until
(NH
4
)
2
SO
4
is dissolved.
3. When UV trace has flattened into a baseline, the pooled fractions may be loaded
onto the HIC column at a flow of 0.5 mL/min. Collect the void peak into a beaker
on ice.
4. Wash the column with buffer E at a flow of 1.0 mL/min until trace returns to
baseline. Meanwhile, set up a 1.2–0.2 M (NH
4
)
2
SO
4
gradient according to Note
3, using 50 mL of buffer E as the starting buffer, and 50 mL of buffer F as the
ending buffer.
5. Start the gradient, and collect 5-mL fractions in 13 × 100 mm tubes. Proteasomes
elute just after the midpoint of the gradient, and quickly lose activity without
glycerol in the buffer. Add 1.25 mL glycerol (final concentration 20%) to each
12 Beyette, Hubbell, and Monaco
tube, and mix thoroughly with collected fractions as soon as possible.
6. After completing the gradient, wash with buffer F until the chart recorder trace
returns to baseline.
7. Store tubes covered at 4°C overnight.
8. To elute tightly bound proteins, wash column with buffer G. Store column in
buffer E at 4°C.
3.6. Day 4: Buffer Exchange and Assay of HIC Fractions
1. Proteasome activity is inhibited by (NH
4
)
2
SO
4
, so fractions need to be buffer-
exchanged before the proteasome assay. Choose the middle one-third of the frac-
tions; from this set, buffer exchange 100 µL of every other fraction into buffer B
using spin columns according to the manufacturer’s instructions (spin columns
can be re-used if stored in water at 4°C). Alternatively, overnight dialysis can be
used to achieve a buffer exchange (see Note 8).
2. Test the buffer-exchanged fractions for LLVY-AMC-hydrolyzing activity as
described in Subheading 3.4., steps 1–4, 6. If the proteasomes are pure, and
fractions have been pooled conservatively at each step, the LLVY-AMC-hydro-
lyzing activity should elute from the HIC column simultaneously with a single
peak of protein (see Fig. 3).
3. In order to determine which fractions to pool, it may be helpful to run a
SDS-PAGE gel of each fraction containing proteasome activity, as well as adja-
cent fractions, to check for contaminants. Use fractions that have been
buffer-exchanged; otherwise, the high (NH
4
)
2
SO
4
content in the samples will
disrupt the electrophoresis.
4. Pool fractions that contain highest levels of proteasome activity and no contami-
nants. If proteasomes still contain impurities, consider running a smaller DEAE
column or a gel-filtration column (see Note 9).
3.7. Day 5: Proteasome Concentration, Protein Determination,
and Storage
1. Buffer-exchange and concentrate the pooled fractions using Centriplus 50 devices
or another comparable device. After at least a 10-fold concentration according to
the manufacturer’s instructions, dilute the sample to original volume with enzyme
dilution buffer and reconcentrate. After three iterations of concentration and di-
lution, the (NH
4
)
2
SO
4
concentration will be 5 mM or less.
2. Measure the protein concentration of the concentrate using Bio-Rad Protein
Assay kit according to the manufacturer’s instructions. A proteasome concentra-
tion of 1–2 mg/mL makes a convenient working stock for running electrophore-
sis gels or enzyme assays.
3. Store proteasomes in 100-µL aliquots in 1.5-mL screw-cap micro-centrifuge
tubes at –80°C. Under these conditions, purified proteasomes will retain activity
for many months. It is best not to thaw and refreeze proteasomes more than 2–3 ×
because of changes (including loss of activity) that may occur to the enzyme.
Proteasome Purification 13
4. Notes
1. It is possible, and convenient, to collect the starting material (e.g., mouse livers)
1 d or more prior to beginning the homogenization step of the purification. This
reduces the time required to complete the first day of proteasome purification.
Tissues can be stored at –80°C for many months without loss of proteasome
activity. For long-term tissue storage, rinse starting material in three changes of
Buffer A, blot away excess buffer with filter paper, and store at –80°C or below
in a suitable container (a 50-mL conical screw-cap tube works well).
2. For FPLC users, the Bio-Rad UnoQ6 column is a good alternative to DEAE-
Sepharose open-column anion-exchange chromatography. A comparable FPLC
anion-exchange column is the MonoQ (Amersham Pharmacia). Two buffers (pre-
pared with HPLC-grade water, filtered through 0.22-µm filters, and degassed
before use) are required: buffer 1 (1 L): 20 mM TEA pH7.7, 15% glycerol; and
Buffer 2 (1L): 20 mM TEA, pH 7.7, 15% glycerol, 1 M NaCl. The 6 mL UnoQ6
column has a high binding capacity and will accommodate at least 60 mg protein,
while retaining maximal resolution. Equilibrate the column in 15% Buffer 2 for 5
column vol before loading sample. Because the buffers contain glycerol, run the
pumps at a much slower flow rate than maximum, in order to avoid high back
pressures and column compaction (i.e., 3 instead of 8 mL/min for the UnoQ6
column). After loading the protein, wash the column with 5 vol of 15% buffer 2,
or until UV trace returns to baseline. Collect the void to test for possible
flowthrough proteasome activity. Elute proteins from the column with a gradient of
15–50% Buffer 2 over 10 column volumes, and 50–100% Buffer 2 over 5 column
vol, collecting 2-mL fractions. Wash column with 100% Buffer 2 until trace returns
to baseline. Test every second fraction for LLVY-AMC-hydrolyzing activity, as
described in Subheading 3.4. Mouse liver proteasome activity elutes between
250–300 mM NaCl from the UnoQ6 column.
3. Gradient makers can be purchased, but an inexpensive and effective alternative
merely requires two identical 100-mL bottles and a piece of tubing. Tape the
bottles together, and label one bottle “starting buffer” and the other “ending
buffer.” Fill the starting buffer bottle with exactly 75 mL Buffer B, and the
ending buffer bottle with exactly 75 mL Buffer C. Put a small stir-bar in the
starting buffer. Using a syringe, fill the tubing with ending buffer (do not draw
the buffer from the 75 mL; use a different source). With the tubing clamped off
so that no buffer escapes, put the ends of the tubing in the bottles, making sure
that they reach the bottoms of each bottle. Unclamp the tubing. Connect a second
piece of tubing from the starting buffer to the column, and set the gradient maker
to stir gently on a stir plate. As the starting buffer is depleted, the resulting siphon
from the ending buffer creates a salt gradient. The buffer levels in both bottles
should be equal throughout the gradient.
4. When testing chromatography fractions for proteasome activity, it is convenient
to assay only the chymotrypsin-like activity (LLVY-AMC-hydrolyzing activity),
because it is usually high, and therefore easily detectable in dilute solutions. How-
14 Beyette, Hubbell, and Monaco
ever, it may be desirable to test fractions for trypsin-like (LRR-AMC-hydrolyz-
ing) and PGPH (LLE-βNA-hydrolyzing) activities during early stages of purifi-
cation, if contaminating proteases capable of LLVY-AMC hydrolysis are present.
Fractions containing proteasomes will show increased fluorescence for all three
substrates. For mouse liver proteasomes, LLVY-AMC should be assayed at a
final concentration of 300 µM, LRR-AMC at 400 µM, and LLE-βNA at 500 µM.
The 26S proteasome, which contains the 20S proteasome as its catalytic core,
also can hydrolyze all three substrates. Although it rapidly loses activity in the
absence of adenosine triphosphate, and is therefore an unlikely contaminant, apy-
rase (5 µL/well of a 50 U/mL stock) can be included in the assay to inhibit the
26S proteasome.
5. It is best to pool fractions very conservatively, taking only the fractions with
highest activity and excluding any shoulders of the proteasome peak, which usu-
ally indicate contaminants. It is helpful to determine the precise location of
contaminants by analyzing proteolytically active and adjacent fractions with
Coomassie- or silver-stained SDS-PAGE. Generally, it is wiser to cut away as
many contaminants as possible and lose some activity earlier in the purification.
This ensures that subsequent purification steps will result in better separation of
proteins, thus producing higher final yields of pure proteasomes.
6. The Alkyl Superose HR 5/5 (Pharmacia, 1 mL column vol) is a good choice for
an FPLC hydrophobic interaction column. Prepare two buffers with HPLC-grade
water, filter through 0.22-µm filters, and degas before use: Buffer 3 (20 mM Tris-
HCl, pH 8.0, 2.0 M (NH
4
)
2
SO
4
); Buffer 4 (20 mM Tris-HCl, pH 8.0). Bring
sample to 2 M (NH
4
)
2
SO
4
by slowly adding (NH
4
)
2
SO
4
directly to pooled anion
exchange fractions (add 0.225 g [NH
4
]
2
SO
4
) per ml, mixing continuously at 4°C
until (NH
4
)
2
SO
4
is dissolved. With mouse livers, many of the remaining proteins
precipitate at 2 M (NH
4
)
2
SO
4
; remove these by centrifugation at 10,000g for 20 min.
In mouse livers, this precipitate contained less than 3% of the remaining
proteasome activity. Load the sample onto the column, and wash with 5 mL
Buffer 3, collecting the void peak. Run the gradient from 0–50% Buffer 4 over 15 mL
(15 column vol), collecting 1 mL fractions. Run a gradient from 50–100% Buffer
4 over 5 mL. Wash the column with 20 vol of 100% Buffer 4. The proteasome
activity elutes between 1.6 and 1.4 M (NH
4
)
2
SO
4
; immediately add 0.2 mL glyc-
erol to each fraction between 1.2 and 1.8 M (NH
4
)
2
SO
4
and mix well, to preserve
proteasome activity. Proceed with buffer exchange and activity assay as described
in Subheading 3.6.
7. HIC open-column equilibration essentially follows method steps in Subheading
3.2. Pack and prepare a chromatography column (12 × 1.6 cm) with 20 mL
Toyopearl 650M matrix, according to the manufacturer’s instructions. Set the
UV detector to 280 nm, with an absorbance unit range of 0.2, and the chart recor-
der speed at 1 mm/min. Equilibrate with Buffer E (at 0.1–0.2 mL/min overnight,
or up to 1 mL/min) until chart recorder trace has returned to baseline, and buffer
has stabilized at pH 7.0.
Proteasome Purification 15
8. Dialysis can be used for buffer exchange instead of the spin columns. Split 4 L
enzyme dilution buffer into two 2-L flasks, and chill to 4°C. Clip each fraction
into dialysis tubing, and dialyze while stirring at 4°C against 2 L enzyme dilution
buffer (4 h); dialyze against the second change of buffer overnight.
9. In our experience, mouse liver, spleen, and muscle proteasomes are very pure
after HIC chromatography (see Fig. 1, lane G), if chromatography fractions have
been pooled conservatively. If proteasomes are not pure enough, try running a
second anion-exchange column of smaller dimensions. Another possibility is gel
filtration chromatography, which has the advantages of buffer-exchanging the
proteasomes into enzyme dilution buffer while retaining higher enzyme yields.
Some proteasome purification protocols use gel filtration chromatography as a size-
based separation step rather than the differential ultracentrifugation steps described
in this protocol (e.g., see refs. 12, 15, and 19). Pharmacia makes a gel filtration
column suitable for purification of large proteins at low pressures (Sephacryl
S-300 HR, HiPrep 16/60), as well as FPLC gel filtration columns (Superose 6 HR
10/30). Set the UV monitor to an absorbance unit range of 0.1, equilibrate, and run
the column in enzyme dilution buffer + 100 mM NaCl (salt may be included to
minimize interactions between proteins and column matrix). After proteasome
purity has been established through SDS-PAGE analysis and proteasome activity
assays, concentrate and store proteasomes according to Subheading 3.7.
References
1. Monaco, J. J. and Nandi, D. (1995) Genetics of proteasomes and antigen process-
ing. Annu. Rev. Genetics. 29, 729–754.
2. Coux, O., Tanaka, K., and Goldberg, A. L. (1996) Structure and functions of the
20S and 26S proteasomes. Annu. Rev. Biochem. 65, 801–847.
3. Nandi, D., Marusina, K., and Monaco, J. J. (1998) How do endogenous proteins
become peptides and reach the endoplasmic reticulum? Curr. Top. Microbiol.
Immunol. 232, 15–47.
4. Griffin, T.A., Nandi, D., Cruz, M., Fehling, H. J., Van Kaer, L., Monaco, J. J., and
Colbert, R.A. (1998) Immunoproteasome assembly: cooperative incorporation
of interferon γ (IFN-γ)-inducible subunits. J. Exp. Med. 187, 97–104.
5. Eleuteri, A. M., Kohanski, R. A., Cardozo, C., and Orlowski, M. (1997) Bovine
spleen multicatalytic proteinase complex (proteasome): replacement of X, Y,
and Z subunits by LMP7, LPM2, and MECL1 and changes in properties and speci-
ficity. J. Biol. Chem. 272, 11,824–11,831.
6. Tanaka, K., Ii, K., Ichihara, A., Waxman, L., and Goldberg, A. L. (1986) A high
molecular weight protease in the cytosol of rat liver: purification, enzymological
properties, and tissue distribution. J. Biol. Chem. 261, 15,197–15,203.
7. Salter, R. D., Howell, D. N., and Cresswell, P. (1985) Genes regulating HLA class
I antigen expression in T-B lymphoblastoid hybrids. Immunogenetics 21, 235–246.
8. Brown, M. G. and Monaco, J. J. (1993) Biochemical purification of distinct
proteasome subsets. Enzyme Protein 47, 343–353.
16 Beyette, Hubbell, and Monaco
9. Grainger, J. L. and Winkler, M. M. (1989) The sea urchin multicatalytic protease:
purification, biochemical analysis, subcellular distribution, and relationship to
snRNPs. J. Cell Biol. 109, 675–683.
10. Hua, S b., To, W Y., Nguyen, T. T., Wong, M L., and Wang, C. C. (1996)
Purification and characterization of proteasomes from Trypanosoma brucei. Mol.
Biochem. Parasitol. 78, 33–46.
11. Inaba, K., Akazome, Y., and Morisawa, M. (1993) Purification of proteasomes
from salmonid fish sperm and their localization along sperm flagella. J. Cell Sci.
104, 907–915.
12. Klinkradt, S., Naude, R. J., Muramoto, K., and Oelofsen, W. (1997) Purification
and characterization of proteasome from ostrich liver. Int. J. Biochem. Cell Biol.
29, 611–622.
13. Koohmaraie, M. (1992) Ovine skeletal muscle multicatalytic proteinase complex
(proteasome): purification, characterization, and comparison of its effects on
myofibrils with µ-calpains. J. Anim. Sci. 70, 3697–3708.
14. Mykles, D. L. (1989) Purification and characterization of a multicatalytic pro-
teinase from crustacean muscle: comparison of latent and heat-activated forms.
Arch. Biochem. Biophys. 274, 216–228.
15. Ozaki, M., Fujinami, K., Tanaka, K., Amemiya, Y., Sato, T., Ogura, N., and
Nakagawa, H. (1992) Purification and initial characterization of the proteasome
from the higher plant Spinacia oleracea. J. Biol. Chem. 27, 21,678–21,684.
16. Rivett, A.J., Savory, P.J., and Djaballah, H. (1994) Multicatalytic endopeptidase
complex: proteasome. Meth. Enzymol. 244, 331–350.
17. Sacchetta, P., Battista, P., Santarone, S., and Di Cola, D. (1990) Purification of
human erythrocyte proteolytic enzyme responsible for degradation of oxidant-
damaged hemoglobin. Evidence for identifying as a member of the multicatalytic
proteinase family. Biochim. Biophys. Acta. 1037, 337–343.
18. Saitoh, Y., Yokosawa, H., Takahashi, K., and Ishii, S i. (1989) Purification and
characterization of multicatalytic proteinase from eggs of the ascidian Halocynthia
roretzi. J. Biochem. 105, 254–260.
19. Suga, Y., Takamori, K., and Ogawa, H. (1993) Skin proteasomes (high-molecu-
lar-weight protease): purification, enzymologic properties, gross structure, and
tissue distribution. J. Invest. Dermatol. 101, 346–351.
20. Ma, C P., Slaughter, C. A., and DeMartino, G. N. (1992) Identification, purifica-
tion, and characterization of a protein activator (PA28) of the 20S proteasome
(macropain). J. Biol. Chem. 267, 10,515–10,523.
21. Rivett, A. J. (1993) Proteasomes: multicatalytic proteinase complexes. Biochem.
J. 291, 1–10.
Proteasome Inhibitors 17
2
Use of Proteasome Inhibitors to Examine
Processing of Antigens for Major Histocompatibility
Complex Class I Presentation
Luis C. Antón, Jack R. Bennink, and Jonathan W. Yewdell
1. Introduction
Proteasomes are multicatalytic proteases present in the nucleus and cytosol
of eukaryotic cells. The central catalytic core, the 20S proteasome, consists of
four heptameric rings, the central two of which contain the catalytic β-sub-
units, members of a new family of threonine (Thr)-proteases. The outer rings,
made of α-subunits, bind the regulators that control the substrate specificity of
the proteasome. The binding of a 19S regulator to each end of the 20S core
creates the 26S proteasome, which degrades ubiquitinated substrates in an
adenosine triphosphate-dependent manner (1,2).
Proteolytic degradation of cytosolic substrates is the chief source of anti-
genic peptides that are presented by major histocompatibility complex class I
(MHC-I) molecules. The involvement of proteasomes in the generation of
class I ligands was suggested by their intracellular distribution and multiple
proteolytic activities and by the fact that genes encoding two of the β-subunits
are located in the MHC, and are controlled by cytokines in parallel with class I
molecules and other proteins associated with antigen (Ag) processing and pre-
sentation (3–5). The introduction of proteasome inhibitors to cellular studies
enabled the demonstration of the dominant role of this protease in cellular pro-
tein turnover and its involvement in the generation of class I ligands (6).
Currently, there are four kinds of commonly used proteasome inhibitors, all of
which, through different mechanisms, base their activity on the modification of
the gamma oxygen (Oγ) on the N-terminal, active residue of Thr in one or more
of the catalytic β-subunits (for a review on the mechanisms of the inhibitors, see
ref. 7). These are:
17
From:
Methods in Molecular Biology, vol. 156: Antigen Processing and Presentation Protocols
Edited by: J. C. Solheim © Humana Press Inc., Totowa, NJ
18 Antón, Bennink, and Yewdell
1. Tripeptide aldehydes. Used in initial studies, they are not specific for protea-
somes, but affect other proteases, particularly calpains (8). They form a revers-
ible hemiacetal covalent bond with N-terminal Thr (9).
2. Lactacystin (10), and its active form, clasto-lactacystin β-lactone CLβL (11), a
Streptomyces sp. natural product, which covalently and irreversibly blocks
proteasome activity; this is, so far, the most specific inhibitor of the proteasome,
but some inhibitory effects on other proteases have been reported (12).
3. Peptidyl-vinylsulfones, which form a covalent bond with the active group, and
are also irreversible (13).
4. Boronic salts, a group of potent inhibitors that only recently has started to be
thoroughly studied (14). Their binding to the active site is reversible.
An important limitation to the use of proteasome inhibitors is that none of
the inhibitors exclusively affects the proteasome. To ascertain that proteasome
inhibition is the cause (but not necessarily the proximal cause, see below) of
the effect observed, appropriate controls must be performed. For the peptide
aldehydes, there are several related compounds that block a similar spectrum
of cellular proteases without affecting the proteasome (one of them, N-acetyl-
leucyl-leucyl-methioninal [Ac-LLM], is included in Table 1). Also, at least
two mechanistically different kinds of proteasome inhibitors should yield com-
parable results.
The first step in using proteasome inhibitors should be to assess the optimal
inhibitor concentration, defined as the minimal concentration that completely
blocks the cellular degradation of a proteasome substrate. Chimeric proteins,
Table 1
Molecular Weights, and Concentrations and Solvents used for Stock
Solutions of the Inhibitors and the Negative Control AcLLM
Inhibitor Mol wt Solvent Concentration
zLLL 475.6 DMSO 40 mM
Ethanol
AcLLnL 383.5 DMSO 40 mM
Ethanol
zLLnV 461.61 DMSO 10 mM
Ethanol
AcLLM 401.6 DMSO 25 mM
Ethanol
Lactacystin 376.4 DMSO 40 mM
H
2
O
CLβL 213.2 DMSO
Acetonitrile
NLVS 722.6 DMSO 10 mM
Proteasome Inhibitors 19
composed of an N-terminal moiety of ubiquitin, followed by a destabilizing
amino acid, according to the N-end rule (15,16), and a target protein, are com-
monly used substrates. The method detailed here uses one of these proteins,
UbRNP, in which the nucleoprotein (NP) from influenza virus A/NT/60/68 is
preceded by ubiquitin and a destabilizing residue of arginine Arg (17). The
protein is expressed as a recombinant vaccinia virus (rVV), and pulse-labeling
of the infected cells, followed by chases at different times, provides a good
estimate of proteasome activity. The same principle could be used with other
metabolically unstable proteins expressed in different ways (endogenously
expressed, transfected, and so on).
Predominantly there are two different methods of investigating the role of
proteasomes in MHC-I presentation (see Fig. 1). One way is to examine the
effects of proteasome inhibitors on the maturation and cell surface expression
of newly synthesized MHC-I molecules, which are peptide binding-dependent.
One approach to accomplish this is to pulse-label the cells, in the absence or
Fig. 1. Scheme of the different methods described to study the effect of proteasome
inhibitors on Ag processing for MHC-I presentation.
20 Antón, Bennink, and Yewdell
presence of inhibitors, and to lyse them after different times of chase. The lysates
are then incubated at 37ºC, a treatment that renders peptide-receptive (or empty)
molecules unable to bind antibodies (Abs) that recognize only folded class I mol-
ecules. As a control, synthetic peptides, which bind to the class I allele studied,
are added to the lysates before the 37°C incubation. Cells with a compromised
peptide delivery to class I molecules in the endoplasmic reticulum (ER) will
have fewer molecules recognized by the Ab in the absence of exogenous peptide.
Another approach is to estimate by flow cytometry the cell surface expression of
newly synthesized class I molecules. This is done either by destroying cell sur-
face molecules by acid treatment, then allowing for new ones to be expressed in
the presence or absence of the inhibitors, or by infection with rVV-expressing
MHC-I Ags different from those endogenously expressed by the infected cell,
and, as before, following their cell surface expression.
The second method is to examine the effects of proteasome inhibitors on the
generation of particular class I-peptide complexes, using either peptide–MHC-
specific cytotoxic T-lymphocytes (CTL) or monoclonal antibodies (mAbs) spe-
cific for these particular complexes (18,19). This requires that the class
I–peptide complexes studied are not expressed before proteasome inhibition.
There are two chief methods of accomplishing this. The most widely used strat-
egy entails transient expression of the substrate, which is achieved by either
viral infection of the target cells or by loading of the purified protein into the
cytosol; alternatively, cells constitutively expressing a target Ag are
acid-stripped to remove existing complexes, and the effect of proteasome
inhibitors on regeneration of peptide–class I complexes is determined.
As alluded to above, one must exercise caution when interpreting results
from any experiment using proteasome inhibitors. Even brief inhibition of
proteasomes has protean effect on cells, including reduction of ubiquitin pools
(20), induction of a stress response (21–23), interference with cell cycle pro-
gression (24), and either enhancement or prevention of apoptosis, depending
on the cell type (25,26). Cytosolic proteases different from the proteasome
may contribute to Ag presentation (27–32). A candidate protease, as well as an
inhibitor that blocks this protease (but not proteasomes) have been described,
and may prove of great relevance to the field (33,34).
2. Materials
2.1. Inhibitor Stocks
Table 1 shows a list of commercially available proteasome inhibitors com-
monly used in studies of Ag presentation, solvents, and concentrations of stock
solutions. These are carbobenzoxy-leucyl-leucyl-leucinal (zLLL, also known
as MG132); N-acetyl-leucyl-leucyl-norleucinal (AcLLnL, calpain inhibitor I);
carbobenzoxy-leucyl-leucyl-norvalinal (zLLnV, MG115); AcLLM, calpain
Proteasome Inhibitors 21
inhibitor II, a control inhibitor which does not affect the proteasome;
lactacystin; CLβL, the active component of lactacystin; and 4-hydroxy-5-iodo-
3-nitrophenylacetyl-leucyl-leucyl-leucyl-vinylsulfone (NLVS). Stocks should
be stored at –20°C or below, and are stable for at least a few months. Aqueous
solutions are not recommended for storage, because the half life of the inhibitor
is reduced, most dramatically in the case of CLβL. Some useful information
about the inhibitors can be obtained on-line from some of the manufactur-
er’s Websites, particularly Calbiochem-Novabiochem (La Jolla, CA [www.
calbiochem.com]) or Affinity Research (Exeter, UK [www.affinity-res.com]).
2.2. Cell Lines
There is no cell line specifically recommended for any of the methods
described. The choice of cell line will depend mostly on the class I molecule,
the determinant studied, and susceptibility to virus infection. Cells commonly
used in this kind of studies include P815 (mastocytoma, H-2
d
), L929 (fibro-
blast, H-2
k
), EL4 (thymoma, H-2
b
), LB27.4 (lymphoblastoid, H-2
d/b
), or
transfectants of the class I-deficient human cell line, H2MY2.C1R. Some of
these cells are also available as transfectants expressing other class I molecules.
Alternatively, class I molecules can be expressed using rVVs. Most mouse
lymphocyte cell lines are resistant to VV infection.
2.3. Determination of the Effective Inhibitor Concentration
All solutions for tissue culture should be sterile.
1.
35
S-L-methionine (Met) (10 mCi/mL).
2. Phosphate-buffered saline (PBS) containing 0.2% bovine serum albumin (BSA)
(PBS/BSA).
3. Methionine (Met) starving medium: Met-free, serum-free medium (RPMI or
Dulbecco’s modified Eagle’s medium [DMEM]), containing 20mM HEPES.
4. PBS containing 10 mM L-Met (PBS–Met).
5. Iscove’s modified DMEM containing 7.5% fetal calf serum (FCS) and L-Met (I/Met).
6. rVV expressing the chimeric protein UbRNP.
7. Laemmli´s sodium dodecyl sulfate-polyacrylamide gel electrophoresis SDS/
PAGE sample buffer, 2X solution, containing 0.5% (v/v) 2-mercaptoethanol.
8. Protease inhibitor cocktail. Boehringer Mannheim’s (Indianapolis, IN) Complete
inhibitors work well for this purpose. The cocktail is usually prepared as a 25X
stock solution in water.
9. PhosphorImager (Molecular Dynamics, Sunnyvale, CA, or Fuji, Medical Sys-
tems, Stamford, CT), with software for quantitation of protein bands.
2.4. Conformational Stability of Newly Synthesized Class I Molecules
1. Same reagents needed for metabolic labeling as indicated in Subheading 2.3.
2. Lysis buffer: 50 mM Tris-HCl, pH 7.3, 100 mM NaCl, 1 mM EDTA, and 2%
Triton X-100.
22 Antón, Bennink, and Yewdell
3. Protease inhibitors (see Subheading 2.3.).
4. Glass fiber filters (Whatman, Clifton, NJ).
5. Trichloroacetic acid (TCA), 10% (w/v).
6. Synthetic peptides with sequences known to bind class I. Prepare a 10 mg/mL
stock solution in DMSO, and store at less than –20°C.
7. Protein A- or protein G-agarose (50% suspension). Use 30–40 µL of the 50%
suspension per sample.
8. Abs specific for conformationally sensitive epitopes in MHC-I molecules. These
Abs fail to recognize class I molecules unfolded after incubation at 37°C. Some
Abs that share this characteristic include MA2.1 (ATCC clone no. HB54, spe-
cific for HLA-A2 and -B17), B22 (H2-D
b
), Y-3 (HB176, H2-K
b
), 30–5–7 (HB31,
H2-L
d
), and 34-5-8S (HB102, H2-D
d
).
9. Wash buffers for the immunoprecipitations (35):
a. 10 mM Tris-HCl, pH 7.4, 1 mM EDTA and 0.5% Nonidet P-40 (NTE).
b. NTE containing 0.5 M NaCl.
c. NTE containing 0.15 M NaCl and 0.1% SDS.
d. 10 mM Tris-HCl, pH 7.4, and 0.1% Nonidet P-40.
10. PhosphorImager with analysis software.
2.5. Acid Stripping of Class I Molecules
and Cytofluorographic Analysis
1. 300 mM Glycine, pH 2.5, containing 1% BSA.
2. Brefeldin A (BFA) stock, 25 mg/mL in methanol (BFA may be purchased least
expensively from Sigma, St. Louis, MO).
3. Anticlass I mAbs for use in cytofluorographic analysis. They are available from
different manufacturers, unlabeled or conjugated to fluorescein isothiocyanate
(FITC), as well as other fluorophores.
4. If the anticlass I Ab is not directly labeled, a FITC-conjugated anti-immunoglo-
bulin Ab, specific for the anticlass I Ab.
5. Ethidium homodimer (Molecular Probes, Eugene, OR). Stock solution in
PBS–BSA (100 µg/mL).
6. Flow cytometer.
7. The materials shown would be the same in the case of rVV-expressed class I Ags, but
adding those needed for VV infection, and that are included in Subheading 2.3.
2.6. Effect of Inhibitors on Presentation of Defined Determinants
2.6.1. Infection of Target Cells with VV
1. All reagents needed for vaccinia virus infection, as described in Subheading 2.3.
2. rVV viruses expressing the proteins of interest. Controls, including a wild type
VV, or an irrelevant rVV, would be included as well.
3. BFA stock (25 mg/mL) in methanol.
4. Iscove’s modified DMEM containing FCS (7.5%).
5. Na
51
CrO
4
, 10 mCi/mL.
Proteasome Inhibitors 23
6. Peptide-specific CTLs.
7. γ-counter.
2.6.2. Osmotic Loading of Substrates
1. Hypertonic medium: RPMI containing 0.5 M sucrose, 10% polyethylene glycol
1000 and 10 mM HEPES, pH 7.2. Prepare fresh, and warm to 37°C before adding
to the cells. The medium should also contain the substrate protein at high concen-
tration (on the order of 20 mg/mL).
2. Hypotonic medium: 60% RPMI in water. As before, warm it to 37°C before adding.
3. Other reagents as in Subheading 2.6.1.
3. Methods
3.1. Determination of Effective Inhibitor Concentration
The method given is based on the reduced half life of the chimeric protein,
UbRNP, with an Arg residue between ubiquitin and the NP from influenza
virus. The protein, however, is completely stable in the presence of proteasome
inhibitors. As a control, the full-length NP or the stable UbMNP, with a stabi-
lizing Met, instead of Arg, can be used. All forms are expressed as rVV (see
Note 1).
1. Wash the cells with PBS–BSA (318g in a benchtop centrifuge), and resuspend
them at 10
7
cells/mL in the same buffer now containing the rVV-expressing
UbRNP, at a multiplicity of infection (MOI) of 10 PFU/cell. The high cell con-
centration enables efficient virus adsorption.
2. After 1 h at 37°C, mixing every 10–15 min, add medium to reach a final cell
density of 10
6
cells/mL. Incubate at 37°C for another 30 min.
3. Wash the cells with warm PBS buffer, and resuspend them in Met-free medium,
containing the desired concentration of the inhibitor (see Note 2), at a density of
5 x 10
6
cells/mL. Incubate 20 min at 37°C (see Note 3).
4. Wash the cells, and resuspend them again in Met-free medium, containing the
appropriate amount of inhibitor (final cell density of 10
7
cells/mL). Add 10–20
µCi of
35
S-Met per 2 x 10
6
cells. Incubate for 1 min at 37°C (see Note 4).
5. Add ice-cold PBS–Met. Wash the cells, and make aliquots of 2 × 10
6
each.
6. Separate one aliquot for time 0, and lyse, as described in step 7, or freeze imme-
diately on dry ice. The remaining aliquots are resuspended in 1 mL of I/Met,
containing the corresponding inhibitors, and incubated for different times before
being lysed. For UbRNP, chase times of 10, 30, 60, and 120 min are sufficient to
estimate the half-life of the protein.
7. Lyse the cells with 100 µL boiling sample buffer of SDS-PAGE, containing pro-
tease inhibitors, and boil for 5 min (see Note 5).
8. Separate the proteins in a 9% SDS-PAGE gel. Fixed and dried gels are exposed
to a PhosphorImager screen for an appropriate time, and imaged using the
PhosphorImager. For normalization of samples, one of the metabolically stable
24 Antón, Bennink, and Yewdell
VV proteins, which may be seen in the scanned image, can be used as an internal
standard in the different chase times.
3.2. Effect of Proteasome Inhibitors on MHC-I Ag Presentation
3.2.1. Conformational Stability of Newly Synthesized Class I Molecules
The method described takes advantage of the conformational instability,
detected by mAbs, of empty class I molecules. An alternative method is the
analysis of the transport of newly synthesized class I molecules from the ER to
the Golgi, which takes place only after peptide binding. It can be detected by
resistance of the carbohydrate groups in the class I molecules to digestion by
endoglycosydase H, which is acquired in the Golgi.
1. Incubate the cells for 30 min at 37°C in Met-free medium, with the appropriate
concentration(s) of inhibitors (see Note 6). Use 2 × 10
6
cells/immunoprecipitation.
2. Pellet the cells, and resuspend them at 10
7
cells/mL in the Met-free medium. Add
200 µCi of
35
S-Met/2 × 10
6
cells, and incubate for 15 min at 37°C.
3. Add an excess of ice-cold PBS–Met, wash the cells once, and make the appropri-
ate number of 2 × 10
6
cell aliquots.
4. Save one aliquot for time = 0, and resuspend the rest in 1 mL I/Met, containing
the corresponding inhibitor. Incubate them at 37°C for the desired intervals.
5. Pellet the cells, and lyse them on ice in 100 µL of lysis buffer, for 30 min at
0°C.
6. Pellet the nuclei by spinning the cells at 15,000g at 4°C for 15 min. Harvest the
supernatant.
7. Estimate the amount of radioactivity incorporated in the different samples by
spotting 5 µL of each sample, in triplicate, on glass-fiber filters. Wash filters
with 10% TFA (w/v), dry, and place in appropriate vials with biodegradable scin-
tillation fluid, and count the filters in a β-counter.
8. Adjust the volumes of each sample used for immunoprecipitation, so that each
sample contains the same amount of incorporated
35
S-Met. Prepare two aliquots
with each sample.
9. To one of the aliquots, add a class I-binding synthetic peptide (final concentra-
tion 5 µg/mL). Incubate all the samples, with or without peptide, at 37°C for 2 h,
then incubate the extracts on ice.
10. Load control and class I-specific Abs to protein A/G-agarose by rotating the beads
(30–40 µL/sample) with the Ab preparations (~20 µg Ab/sample) for 1 h at 4°C.
Wash the beads with PBS. Resuspend in PBS containing 10% lysis buffer (to
make approx a 50% slurry).
11. First incubate extracts with beads coupled to the irrelevant Ab, in a shaker, for
2h at 4°C. This step will clear the lysates from proteins that bind nonspecifically
to the Ab-coupled beads. After pelleting, transfer the supernatant to a new tube
containing the beads coupled to the conformation-sensitive anti-class I Ab. Incu-
bate for 2 h in a shaker at 4°C.