clinical applications of pcr
Bạn đang xem bản rút gọn của tài liệu. Xem và tải ngay bản đầy đủ của tài liệu tại đây (20.22 MB, 326 trang )
1
Introduction to the Polymerase Chain Reaction
Y. M. Dennis Lo
1. Introduction
The polymerase chain reaction (PCR) is an in vitro method for the amplifi-
cation of DNA that was mtroduced in 1985 (I). The principle of the PCR is
elegantly simple but the resulting method is extremely powerful. The adoption
of the thermostable
Taq
polymerase in 1988 greatly simplifies the process and
enables the automatron of PCR (2). Since then a large number of apphcatrons
have been developed that are based on the basic PCR theme. The versatility
and speed of PCR have revolutionized molecular diagnostics, allowmg the
realization of a number of applications that were impossible in the pre-PCR
era. This chapter offers an mtroductory guide to the process.
2. Principle of the PCR
PCR may be regarded as a simplified version of the DNA rephcation pro-
cess that occurs during cell division. Basic PCR consrsts of three steps: thermal
denaturation of the target DNA, primer annealing of synthetic oligonucleotide
primers, and extension of the annealed primers by a DNA polymerase
(Fig. 1).
This three step cycle is then repeated a number of times, each time approxi-
mately doubling the number of product molecules. The amplification factor is
given by the equation n( 1 + E)X where n = initial amount of target, E = effi-
ciency of amplification, and x = number of PCR cycles. After a few cycles, the
resulting product is of the size determined by the distance between the 5’-ends
of the two primers. With the performance of a previous reverse transcription
step, PCR can also be applied to RNA (see Chapter 14).
From Mefhods in Molecular Medmne, Vol 16 Chnrcal Apphtrons of PCR
Ed&d by Y M D Lo 0 Humana Press Inc , Totowa, NJ
3
Lo
Double
strand 5’
DNA 3’ 4
) 3’
5’
Denature
CYCLE 1 1 Anneal
Extend
CYCLE 2
b
4
m
b
CYCLE 3
1
MILLION FOLD AMPLIFICATION
AFTER 20-25 CYCLES OF PCR
Fig. 1. Schematic representation of the polymerase chain reaction. The newly syn-
thesized DNA is indicated by dotted lines in each cycle. Oligonucleotide primers are
indicated by solid rectangles.
Each DNA strand is marked with an arrow indicating the
5’ to 3’ orientation.
3. Composition of the PCR
PCR is usually performed in a volume of 25-l 00 pL. Deoxynucleoside triph-
osphates (dATP, dCTP, dGTP, and dTTP) at a concentration of 200 pM each, 10
to 100 pmol of each primer, the appropriate salts, buffers, and DNA polymerase
are included. Many manufacturers have included reaction buffer with then DNA
polymerase and this practice IS convenient to newcomers to the PCR process.
Introduction to PCR
5
4. Primers
Primers are designed to flank the sequence of interest. Oligonucleotide prim-
ers are usually between 18 and 30 bases long, with a GC content of about 50%.
Complementarity at the 3’-ends of the primers should be avoided to decrease
the likelihood of forming the primer-dimer artifact. Runs of three or more C’s
or G’s at the 3’-ends of the primers should be avoided to decrease the probabil-
ity of primmg GC-rich sequences nonspecifically. A number of computer
programs are available to assist primer design. However, for most applications
PCR is sufficiently forgiving in that most primer pairs seem to work. The prim-
ers are generally positioned between 100 to 1000 bp apart. It should be noted,
however, that for high sensitivity applications, shorter PCR products are pre-
ferred. For most applications, purification of the PCR primers are not neces-
sary. To simplify subsequent operations, it is recommended that all primers are
diluted to the same concentration (e.g., 50 pmol/p.L) such that the same volume
of each primer is required for each reaction. Some primer pairs seem to fail
without any obvious reason, and when difficulty arises, one simple solution is
to change one or both of the primers.
The use of primers for allelic discrinnnation (Chapters 7 and 8) and the apphca-
tion of labeled primers (Chapters 6,20, and 23) are described later on in the book.
5. Steps of the PCR
5.1. Thermal Dena tura tion
A common cause of failed PCR is inadequate denaturation of the DNA tar-
get. We typically use an imtial denaturation temperature of 94°C for 8 min. For
subsequent cycles, 94°C for l-2 min is usually adequate. As the targets of later
PCR cycles are mainly PCR products rather than genomic DNA, it has been
suggested that the denaturation temperature may be lowered after the first
10 cycles so as to avoid excessive thermal denaturation of the
Taq
polymerase
(3). The half-life of
Taq
DNA polymerase activity is more than 2 hat 92.5OC,
40 min at 95°C and 5 min at 97.5”C.
5.2. Primer Annealing
The temperature and length of time required for primer annealing depends
on the base composition and the length and concentration of the primers. Using
primers of 18-30 bases long with approx 50% GC content, and an annealing
step of 55°C for l-2 mm is a good start. In certain primer-template pairs, a
small difference in the annealing temperature of 1-2OC will make the differ-
ence between specific and nonspecific amplification. If the annealing tempera-
ture is >6O”C, it is possible to combine the annealing and extension step
together into a two step PCR cycle.
6
LO
5.3. Primer Extension
Primer extension is typically carried out at 72OC, which is close to the tempera-
ture optimum of the
Taq
polymerase. An extension time of 1 min is generally
enough for products up to 2 kb in length. Longer extension times (e.g., 3 min)
may be helpful m the first few cycles for amplifying a low copy number target
or at later cycles, when product concentration exceeds enzyme concentration.
6. Cycle Number
The number of cycles needed is dependent upon the copy number of the
target. As a rule of thumb, to amplify lo5 template molecules to a signal visible
on an ethidium bromide stained agarose gel, requires 25 cycles. Assuming that
we use 1 min each for.denaturation, annealing and extension, the whole pro-
cess can be completed in approx 2-3 h (with extra time allowed for the lag
phase taken by the heat block to reach a certain temperature). Similarly, 104,
103, and lo2 target molecules will require 30, 35, and 40 cycles, respectively.
Careful optimization of the cycle number is necessary for quantitative applica-
tions of PCR (see Chapter 4).
7. PCR Plateau
There is a limit to how many product molecules a given PCR can produce.
For a 100 pL PCR, the plateau is about 3-5 pmol (4). The plateau effect is
caused by the accumulation of product molecules that result in a significant
degree of annealing between complementary product strands, rather than
between the primers and template. Furthermore, the finite amount of enzyme
molecules present will be unable to extend all the primer-template complex m
the given extension time.
8. Sensitivity
The sensitivity of PCR is related to the number of target molecules, the com-
plexity of nontarget molecules, and the number of PCR cycles. Since the intro-
duction of the
Tag
polymerase, it has been known that PCR is capable of
amplification from a single target molecule (2,s). This single-molecule capa-
bility has allowed the development of smgle sperm typing (5,6) and preim-
plantation diagnosis (7-9) (see Chapters 20 and 22). In these applications, the
smgle target molecule is bathed, essentially, in PCR buffer-m other words, m
a low complexity environment. In situations where the complexity of the envi-
ronment is high, the reliability of single molecule PCR decreases and strate-
gies such as nesting and Hot Start PCR (10,11) are necessary for achieving
maximum sensitivity (see Chapters 11, 15, 18, 19, and 21). The sensitivity of
PCR has also allowed it to be used in situations where the starting materials
have been partially degraded (see Chapter 3).
Introduction to PCR
7
9. PCR Fidelity
The fidelity of amplification by PCR is dependent upon several factors:
annealing/extension time, annealing temperature, dNTP concentration, MgCl*
concentration, and the type of DNA polymerase used. In general, the rate of
misincorporation may be reduced by mmimizmg the annealing/extension time,
maximizmg the annealing temperature, and minimizing the dNTP and MgC&
concentration (12). Eckert and Kunkel reported an error rate per nucleotide
polymerized at 70°C of 1 Om5 for base substitution and 1 OV6 for frameshift errors
under optimized conditions (12). The use of a DNA polymerase with proof-
reading activity reduces the rate of misincorporation. For example, the DNA
polymerase from Thermococcus Zitorcdis, which has proofreading activity,
misincorporates at 25% of the rate of the Taq polymerase, which lacks such
activity (13). Interestmgly, the combination of enzymes with and without
proofreading activity has enabled the amplification of extremely long PCR
products (see Chapter 9).
For most applications, product molecules from individual PCR are analyzed
as a whole population and rare mismcorporated nucleotides m a small propor-
tion of molecules pose little danger to the interpretation of data. However, for
sequence analysis of cloned PCR products, errors due to misincorporation may
sometimes complicate data interpretation. Thus, it is advisable to analyze mul-
tiple clones from a single PCR or to clone PCR products from several indepen-
dent amplifications. Another application where misincorporation may result m
error in Interpretation is m the amplification of low copy number targets (e.g.,
single molecule PCR). In these situations, if a misincorporation happens in an
early PCR cycle (the extreme case being in cycle l), the error will be passed
onto a significant proportion of the final PCR products. Hence, in these appli-
cations, the amplification conditions should be carefully optimized.
10. PCR Thermocyclers
One of the main attractions of PCR is its ability to be automated. A number
of thermocyclers are available from different manufacturers. These thermo-
cyclers differ in the design of the cooling systems, tube capacity, number of
heating blocks, program memory, and thermal uniformity. In our opinion, units
using the Peltier system are fast and have a uniform thermal profile across the
block. Units with multiple heating blocks are very valuable for arriving at
the optimal cycling profile for a new set of primers, as multiple conditions can
be tested simultaneously. Tube capacity generally ranges from 48 to 96 wells
and should be chosen with the throughput of the laboratory m mind. Some
thermocyclers have heated covers and, thus, allow the omission of mineral oil
from the reaction tubes. Specially designed thermal cyclers are required for
in situ amplification (see Chapter 12) that accommodate glass slides.
8 Lo
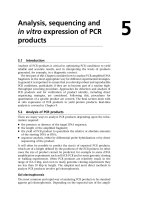
11. Analysis and Processing of PCR Product
The amplification factor produced by PCR simplifies the analysis and
detection of the amplificatton products. In general, analytical methods for con-
ventional DNA sources are also applicable to PCR products. Some of these
methods for studying sequence variation are covered in this volume (see Chap-
ters 5,6, and 13)
7 7.7.
Agerose Gel Electrophoresis
Agarose gel electrophorests followed by ethidium bromide staining repre-
sents the most common way to analyze PCR products. A 1.5% agarose gel is
adequate for the analysis of PCR products from 150 to 1000 bp. A convenient
molecular weight marker for this size range is @Xl 74 DNA digested by HaeIII.
7 7.2. Restriction of PCR Products
Restriction mapping is a commonly used way of verifying the identity of a
PCR product. It is also a simple method of detecting restriction site polymor-
phisms and for detecting mutations that are assoctated with the creation or
destruction of restrtctton sites. There is no need to purify the PCR product
prior to restriction and most restriction enzymes are functtonal in a restrtction
mix in which the PCR product constitutes up to half the total volume.
17.3. Sequence-Specific Oligonucleotide Hybridization
This is a powerful method for detecting the presence of sequence poly-
morphisms in a region amplified by PCR. Short oligonucleotides are synthe-
sized and labeled (either radioactively or nonradtoactively), allowed to
hybridize to dot blots of the PCR products (51, and washed under conditions
that allow the discrimination of a single nucleotide mismatch between the probe
and the target PCR product.
For the detection of a range of DNA polymorphisms at a given locus, the
hybridization can be performed “in reverse,” that is, with the oligonucle-
otides immobilized onto the filter. Labeled amplified products from target
DNA are then hybridized to the filters and washed under appropriate condl-
ttons (14). The reverse dot-blot format is now available for many multi-allelic
systems (15,16).
11.4. Cloning of PCR Product
PCR products may be cloned easily using conventional recombinant DNA
technology. To facilitate cloning of PCR products into vectors, restriction sites
may be incorporated into the primer sequences. Digestion of the PCR products
with the appropriate restriction enzymes will then allow “sticky end” ligation
into similarly restricted vector DNA.
Introduction to PCR
9
12. Conclusion
The versatility of PCR has made it one of the most widely used methods in
molecular diagnosis. The number of PCR-based applications have continued
to increase rapidly and have impacted in oncology (see Chapters 15 and 17-l 9),
genetics (see Chapters 16 and 20-23), and microbiology (see Chapters 24 and 25).
In this book we attempt to present some of the most important clinical
applications of PCR.
References
1. Sah, R. K., Scharf, S., Faloona, F., Mullis, K. B., Horn, G. T., Erlich, H. A., and
Arnheim, N. (1985) Enzymatic amplification of P-globin genomic sequences and
restriction site analysis for diagnosis of sickle cell anemia. Science 230, 1350-1354
2. Saiki, R. K., Gelfand, D. H., Stoffel, S., Scharf, S. J., Higuchi, R., Horn, G. T.,
Mullis, K. B., and Erlich, H. A. (1988) Primer-directed enzymatic amphtication
of DNA with a thermostable DNA polymerase. Sczence 239,487-491
3. Yap, E. P. H. and McGee, J. 0. (1991) Short PCR product yields improved by
lower denaturation temperatures. Nucleic Acids Res 19, 17 13.
4. Higuchi, R., Krummel, B., and Saiki, R. K. (1988) A general method of m vitro
preparation and specific mutagenesis of DNA fragments: study of protein and
DNA interactions. Nucleic Acids Res 16,735 l-7367.
5. Li, H., Gyllensten, U. B., Cm, X., Saiki, R. K., Erlich, H. A., and Amheim, N.
(1988) Amplification and analysis of DNA sequences in single human sperm and
diploid cells. Nature 335,414-417.
6. Hubert, R., MacDonald, M., Gusella, J., and Amheim, N. (1994) High resolution
localization of recombination hot spots using sperm typing. Nut Genet 7,420-424.
7. Handyside, A. H., Lesko, J. G., Tarin, J. J., Winston, R. M., and Hughes, M R.
(1992) Birth of a normal girl after m vitro fertilization and preimplantation diag-
nostic testing for cystic fibrosis N. Engl. J Med. 327,905-909.
8. Kristjansson, K., Chong, S S., Vandenveyver, I. B., Subramanian, S., Snabes, M.
C., and Hughes, M. R. (1994) Preimplantation single cell analyses of dystrophin
gene deletions using whole genome amplification. Nat Genet. 6, 19-23.
9. Vandenveyver, I. B., Chong, S. S., Cota, J., Bennett, P. R., Fisk, N. M., Handyside,
A. H., Cartron, J. P., Le Van Kim, C., Colin, Y., Snabes, M. C., Moise, K. J., and
Hughes, M. R. (1995) Single cell analysis of the RhD blood type for use m preim-
plantation diagnosis m the prevention of severe hemolytic disease of the newborn.
Am J Obstet. Gynecol. 172,533-540.
10. Chou, Q., Russell, M , Birch, D. E., Raymond, J., and Bloch, W (1992) Preven-
tion of pre-PCR mis-priming and primer dimerization improves low-copy-num-
ber amplifications. Nucleic Acids Res. 20, 1717-1723.
11. Birch, D E., Kolmodm, L., Laird, W. J., McKinney, N., Wong, J., and Young, K.
K. Y. (1996) Simplified Hot Start PCR. Nature 381,445,446.
12. Eckert, K. A. and Kunkel, T. A. DNA polymerase
fidelity and the polymerase
chain reaction. (199 1) PCR Methods Appl. 1, 17-24.
10 Lo
13. Cariello, N. F., Swenberg, J. A., and Skopek, T R. (1991) Fidelity of Thermo-
coccus litorahs DNA polymerase (Vent) m PCR determined by denaturing gradi-
ent gel-electrophoresis. Nucleic Acids Res. 19,4 193-4 198.
14 Saiki, R. K., Walsh, P. S., Levenson, C. H., and Erlich, H. A. (1989) Genetic
analysis of amplified DNA with immobilized sequence-specific ohgonucleotide
probes Proc. Nat1 Acad Sci. USA 86,6230-6234.
15. Sutcharitchan, P., Saiki, R , Huisman, T., Kutlar, A., Mckie, V., and Erlich, H
(1995) Reverse dot-blot detection of the African-American beta-thalassemia
mutations. Blood 86, 1580-l 585
16. Rady, M., Dalcamo, E., Seia, M., Iapichino, L., Ferari, M., Russo, S., Romeo, G.,
and Maggie, A (1995) Simultaneous detection of 14 Italian cystic-fibrosis muta-
tions m 7 exons by reverse dot-blot analysis. A401 Cell. Probes 9,357-360.
3
Amplification from Archival Materials
Y. M. Dennis Lo
1. Introduction
The ability of the polymerase chain reaction (PCR) to amplify from partially
degraded and relatively impure preparations has allowed the technique to
amplify nucleic acid sequences from archival materials, which in many
institutions consist of paraffin-embedded tissue samples (1,Z). This ability has
allowed the carrying out of large scale retrospective studies of archival
materials and has facilitated the use of materials from multiple institutions from
different countries (3).
The preparation of paraffin embedded tissues for PCR analysis involves a
number of steps. The first is the dewaxing of paraffin from the tissue samples.
This is then followed by procedures designed to liberate the DNA from the
samples. A variety of techniques have been used that include boiling (4),
proteinase K digestion (5) and treatment with Chelex 100 (6,7). In many
situations, complete nucleic acid purification is unnecessary and indeed
undesirable because the additional steps involved may increase the risk of
contamination, The dewaxing and DNA liberation steps are then followed by
PCR amplification.
The success of PCR from paraffin-embedded materials depends, to a large
extent, on the fixation of the samples (8,9). Fixation parameters that have been
found to be important include:
1. The type of fixative: the best fixatives for preserving materials for subsequent
PCR are ethanol, acetone, Omnifix, and 10% neutral buffered formalin (NBF) (9)
2. Duration of fixation: generally extended fixation time is detrimental
to
PCR
analysis of the materials (8). Furthermore, longer PCR targets appear to be more
sensitive to the effect of prolonged fixation than shorter PCR targets.
From Methods m Molecular Medme, Vol. 16 Clrn~~a/ Apphcabons of PCR
Edlted by Y M D Lo 0 Humana Press Inc , Totowa, NJ
21
22 Lo
3. Specimen age: generally, the older the specimen age, the less amenable it is for PCR
amplification. This is especially the case for long amphcons. Thus, it is recommended
that shorter length amplicons be used for old paraffin-embedded samples
2. Materials
2.1. Sample Processing
1. Paraffin-embedded tissue sections
2. Xylene (HPLC grade) (Aldrich, Milwaukee, WI)
3. 95% Ethanol.
4. Protemase K (20 mg/mL stock solution) (Boehringer Mannheim, Sussex, UK).
5. Protemase K digestton buffer: 50 mM Tris-HCl, pH 8 5, 1 mA4 EDTA, 0 5%
Tween-20 (Sigma, Poole, UK).
6. 10% bleach solution (freshly made daily)
7. Eppendorf tubes.
8 Disposable microtome blades (see Note 1).
9. Mwrotome.
10. Oven
11. Vortex mixer.
12. Sterile Pasteur pipets
13. Microcentrifuge.
2.2. PCR
1. Thermal cycler.
2. PCR buffer II and magnesium chlortde solution (Perkm Elmer, Norwalk, CT).
3. dNTPs (Perkin Elmer)
4. Taq DNA polymerase (Perkin Elmer).
5. Primers (Genosys) typically 10-100 pmol per 100 ul reaction.
3. Methods
3.1. Cutting of Paraffin-Embedded Sections
1. Use a microtome to cut paraffin embedded sections from &sue samples. Push
the cut sections into a recipient Eppendorf tube usmg a sterile Pasteur ptpet.
2. Employ a new disposable blade with each sample. Clean the microtome carefully
with 10% bleach followmg each specimen (see Notes 1-I)
3.2. Preparation of Cut Sections
1. Deparaffinize sections by adding 400 pL xylene, vortexmg for 1 mm, and
spinning for 5 min in a mtcrocentrifuge.
2. Ptpet off the xylene carefully.
3. Add 400 pL of 95% ethanol. Vortex for 1 min and spm for 5 mm.
4. Pipet off most of the ethanol.
5. Repeat steps 3 and 4.
6. Remove most of the ethanol.
Amplification from Archival Materials
23
7. Incubate the tube with their caps open in an 80°C oven for 10 min (see Note 5).
8. Add 100 PL of protemase K digestion buffer with 200 mg/mL proteinase K to
each tube.
9 Digest from 3 h to overnight at 37°C.
10. Followmg dlgestion, spin the tube briefly and heat at 94’C for 20 mm to mactl-
vate the proteinase K (see Notes 6 and 7).
11. Use 10 pL for PCR (see Notes 8 and 9).
4. Notes
1. Obsessive care should be taken to prevent cross contamination between samples. As it
is difficult to completely clean cutting surfaces, disposable blades are the ideal option.
Guidelines on mininuzmg the nsk of contamination are described m Chapter 2.
2 Always discard the first slice from a paraffin wax embedded block. Subsequent slices
can be regarded as “clean,” being “protected” from the environment by the first slice.
3. The thickness and the number of slices taken for preparation depends on the
specimen size. As a guideline, l-10, 5 pm sections are cut from liver reseation
specimens averaging 2 cm2 in surface area.
4. If the area of interest IS small, tt may be advisable to use the first and last slices
for hematoxylin and eosin (H&E) staining to ascertain that the area of Interest
has indeed been cut.
5. The open tubes are especially prone to contamination at this point.
6. Note that the protocol described here does not mvolve further DNA purification
using phenol/chloroform extraction. Thts is to minimize the number of steps
necessary and reduce the risk of contammation.
7. The inactivation step of proteinase K is important, as any residual proteinase K
activity will digest the Tag polymerase, resulting in no or suboptimal amph-
fication. The spinning step will ensure that all proteinase K solution will stay at
the bottom of the Eppendorf tube.
8. Appropriate posltlve and negative controls are crucial. Apart from the usual
reagent blank PCR control, known negative samples should be subjected to all
the sample processing steps in order to control for possible contamination during
these stages. Positive controls should include known specimens with the target of
interest. In addition, each sample should be subjected to a control amplification,
using a sequence which is present in all samples, e.g. the beta-globin gene, to test
for
the
quality of the samples It should be noted that the control and test targets
should be of similar lengths, so that they will be affected similarly by fixation
parameters and the age of the specimen. Provided that the target is of similar
copy number to the control, the two targets (test and control sequences) can be
coamplified. In situations where the two are of significantly different copy
numbers, e.g., certain viral targets, it 1s advisable to carry out the control and test
amplifications separately
9. If there is no PCR signal, the following measures may be taken:
a Adjust the amount of specimen extract used for PCR. Suboptimal amount of
specimen extract will obviously give rise to less than ideal amplification.
24 Lo
However, too much specimen can also inhibit PCR due to the presence of
inhibitors m tissue samples (J&11) , It is advisable, therefore, to use a range
of sample volumes, e.g., from 1 to 20 PL per 100 PL PCR.
b. Increase the sensittvtty of PCR: this can be achieved by increasing the number
of cycles and/or by using the Hot Start technique (12)
c. Reassess the proteinase K inactivation steps: incomplete mactivation of
proteinase K will result in the digestion of the Tuq polymerase.
d. If the sample is still refractory to amplification, further DNA purification steps
e.g., using phenol/chloroform extraction, will help in a significant proportion
of cases (11).
e. Even with the measures hsted in (a) to (d), a proportion of archival specimens
will remam refractory to amplrfication. The exact proportion will depend on
the type of specimen, fixation method, and the age of the specimen.
References
1. Shibata, D. (1994) Extraction of DNA from paraffin-embedded tissue for analysis
by polymerase chain reaction-new tricks from an old friend. Hum Pathol 25,
561-563.
2. Mies, C. (1994) Molecular biological analysis of paraffin-embedded tissues. Hum
Path01 25,555-560.
3. Lo, Y. M. D., Lo, E. S. F., Mehal, W. Z., Sampietro, M , Fiorelli, G., Ronchi, G ,
Tse, C. H., and Fleming, K. A. (1993) Geographical variation in prevalence of
hepatitis B virus DNA in HBsAg negative patients. J Clin Pathol 46,304-308
4. Kalho, P., Syrjanen, S., Tervahauta, A., and SyrJanen, K. (1991) A simple method
for isolation of DNA from formalin-fixed paraffin-embedded samples for PCR. J
Vi’irol. Methods X,39-47
5. Frank, T. S., Svobodanewman, S. M., and Hsi, E D. (1996) Comparison of
methods for extracting DNA from formalin-fixed paraffin sections for nomsotopic
PCR. Diagn. Mol. Pathol. 5,22&224.
6. Chen, M. L., Shieh, Y., Shim, K. S., and Gerber, M. A. (1991) Comparative studies
on the detection of hepatitis B virus DNA in frozen and paraffin sections by the
polymerase chain reaction. Mod. Pathol. 4,555-558.
7. Sepp, R., Szabo, I., Uda, H., and Sakamoto, H. (1994) Rapid techniques for DNA
extraction from routinely processed archival tissue for use m PCR. J Clin Pathol
47,3 18-323.
8. Greer, C. E., Lund, J. K., and Manos, M. M. (1991) PCR amplification from
paraffin-embedded tissues: recommendations on fixatives for long-term storage
and prospective studies. PCR Methods Appl. 1,46-50.
9. Greer, C. E., Peterson, S. L., Kwiat, N. B., and Manos, M. M. (199 1) PCR amph-
fication from paraffin-embedded tissues effects of fixative and fixation time,
Am J. Clin Pathol. 95,117-124.
10. Lo, Y. M. D., Mehal, W. Z., and Fleming, K. A. (1989) In vitro amplification of
hepatitis B virus sequences from liver tumour DNA and from paraffin wax embedded
tissues using the polymerase chain reaction. J. Clan Puthol. 42,840-846.
Amplification from Archival Materials
25
11. An, S. F. and Fleming, K A. (1991) Removal of inhibitor(s) of the polymerase
chain reaction from formalin fixed, paraffin wax embedded tissues. J, Clm. Pathol.
h-4,924-927.
12. Chou, Q., Russell, M , Btrch, D. E., Raymond, J., and Bloch, W. (1992) Preven-
tion of pre-PCR mis-priming and primer dimerizatron improves low-copy-num-
ber amplifications. Nucleic Acids Res 20, 17 17-1723.
Luc Raeymaekers
1. Introduction
Quantitative PCR recently has become a powerful tool in clinical investiga-
tions. Its main areas of applicatton have been the assessment of residual disease
after treatment of leukemia and lymphoma, the detection of viral nucleic acids,
and the detection of gene amplification or deletion and of aneuploidy (I).
The application of PCR as a quantitatrve tool requrres the solution of the
problem of how to reliably determine the initial amount of target template (To)
from the amount of PCR product (r,) that has accumulated after some number
(n) of cycles. The relation between To and T,, in most instances strongly depends
on the PCR conditions. This difficult situation is caused by two mam properttes
of PCR: first, the huge over-all amplification factor makes PCR very sensitive
to small variations of the experimental conditions; the second problem is caused
by the saturation phenomenon, i.e., the gradual decrease of the amphfication
efficiency that starts in the later stages of PCR, usually followmg the
accumulation of some threshold amount of product.
In order to exploit the potential of PCR for high sensitivity, a typical PCR
consists of many cycles. As a consequence, if there is a difference in the
efficiency of amphfication between separate PCR tubes or between different
templates, the difference in the amount of product will be amplified as well.
The error increases exponentially with )z and with the magnitude of the
difference between the amplification factors. For example, a DNA sequence
amplified m one conditton with an efficiency of 1 (i.e., the amplification factor
in each cycle is 2, the maximum value theoretically possible) will generate,
after 30 cycles, an amount of product that is 23.6-fold higher than in another
condition in which the efficiency is 0.8 (i.e., the amplification factor in each
cycle equals 1 .S). After 40 cycles, the difference is a factor of 67.7.
From Methods m Molecular Medrcme, Vol 16 Cl/ma/ Appbcatrons of PCR
E&ted by Y M. D. Lo 0 Humana Press Inc , Totowa, NJ
27
28
Raeymaekers
The other important variable is the effect of saturation of the PCR on the
relation between To and T,,. The amplification factor in each cycle remains constant
up to some threshold value of T,,, which is reached after 15 to 30 cycles,
depending on the amount of starting material. Thereafter, the amplification
factor gradually decreases with IZ. Let us call this point the transition point,
or
tr
point, and let us indicate the amount of product reached at
tr
as Ttr.
The graph relating the logarithm of T,, to n is linear for values of T,, lower than
T,, For values of T,, higher than T,, the curve gradually flattens until its slope
is zero, corresponding to full saturation of the PCR. A consequence of this
phenomenon is that if several reactions are run starting from different values of
To, the initial differences will be preserved till T,, is reached, but the differ-
ence will decrease from Tt,. onward. Any difference in T,, will disappear com-
pletely if the PCR is run up to complete saturation. In other words, at a
sufficiently large number of cycles, one will end up with always the same
amount of product (we will indicate this amount by T,), irrespective of the
starting value To.
It is important to note that it has been observed that T,, is sometimes much
lower than T,, up to a factor of lo3 to lo4 (2). The amount of PCR product that
is high enough to allow accurate quantification on ethidium bromide-stained
gels, is, m these cases, greater than T, and should, therefore, not be used for
absolute quantitative purposes without coamplification of a standard sequence.
It can only be used for comparative purposes-for example to find out
whether To has increased or decreased. It is not sufficiently reliable to deter-
mine exactly by which factor this change has occurred. For all these reasons,
much of the problem of quantitative PCR concerns the question of how
adequate standardization can be achieved. The review of Ferre (3) is recom-
mended reading for its extensive reflections on the factors that affect the
quantitative power of PCR.
2. Materials
The only step in quantitative PCR requiring expensive equipment is the
quantification of the PCR products. The widest dynamic range is obtained by
direct imaging of gel bands using radioactively labeled deoxynucleotides (e.g.,
32P-adCTP). There is a choice of apparatus on the market, in combination with
the appropriate software, for quantification of the radioactive bands on poly-
acrylamide gels. The Packard InstantImager (Packard Instrument Company,
Meriden, CT) measures the radiation directly, permitting readings within a few
minutes. Others make use of the indirect method via exposure of the dried gel
to a storage phosphor screen that is afterwards scanned by a laser, e.g., the
PhosphorImager (Molecular Dynamics, Sunnyvale, CA) and the Molecular
Imager (Bio-Rad, Hercules, CA) apparatus (see Note 1). If such instruments
Quantitative PCR
29
are not available, bands can be cut out from the gel and counted in a scintilla-
tion counter, although this 1s a tedious and less accurate procedure.
Fluorescence using classical fluorescent dyes such as ethidium bromide
combined with densitometry is a cheaper and more convenient alternative-
with a much more restricted dynamic range, however. Gel bands (preferably
on polyacrylamide instead of agarose gels, see Subheading 3.2.2.1.) can be
made fluorescent by using an intercalating dye (see Note 2) or by using a
fluorescent primer for the PCR. The fluorescent bands are quantified by digi-
tizing the image using a system equipped with a CCD video camera, such as
the Eagle Eye apparatus (Stratagene, La Jolla, CA), and analysis with a suit-
able image analysis program, or by using a laser scanner designed for fluores-
cence imaging, such as the FluorImager from Molecular Dynamics. This
apparatus, in combination with newly developed dyes, extends the dynamic
range of the technique close to that of radioisotopes.
PCR in general, and quantitative PCR especially, require meticulous labora-
tory technique (4). It is strongly recommended to use pipet tips with protective
filters m order to avoid product carryover via the pipets (see Note 3). The PCR
mixtures should be prepared in a room separate from that where amphtied DNA
is being handled and a separate set of pipets and pipet tips should be used. It is
evident also that the accuracy of quantification depends on the accuracy of the
volume of sample added. Therefore, small-volume, high-accuracy pipets
should be available.
3. Methods
3.1. Quantification Without Coamplification of a Standard Sequence
This method of quantification requires the measurement in each PCR of the
increase of
T,
with IZ in order to check the duration of the exponential phase and
to determine the amplification factor (A) during the exponential phase. The value
of the logarithm of A is determmed from the slope of the curve obtained by a
linear regression analysis on the points relating the logarithm of
T,
to ~1, accord-
ing to the formula: log
T,,
= II * log A + log
To,
from which
To
is calculated (5).
The advantage of this method is that there is no need to construct and test a
standard sequence. The main disadvantage is that several samples have to be
taken from the PCR mixture during the run. The method is therefore more suitable
for one-time experiments than for the quantification of large series of samples.
Since there are a large number of cycles between the sampling of the data points
and the extrapolated value
To,
the accuracy of the result is strongly dependent on
the statistical characteristics and accuracy of the regression analysis, It, therefore,
requires very accurate quantification of the samples collected at the different
time points. Care has to be taken not to include any data obtained beyond the tr
point, as may occur in assays of samples in which
To
is high.
30
Raeymaekers
3.2. Quantification Using a Coamplified Standard Sequence
Quantification by coamplification with a standard sequence is the most
widely used method. This method allows to compensate for tube to tube
variation in amplification efficiency. The amount of PCR product obtained
from a specific template species (Z’,) is compared to that amplified from a
reference sequence or “standard” (S,) in the same PCR tube. The standard is
either an internal standard, i.e., a sequence that is constitutively present and the
amount of which IS considered to be invariant, or an exogenously added
standard sequence (competitive PCR).
3.2. I. Internal Standards:
Coamplification of the Target with a Control Gene
This method involves the coamplificatton of the target sequence with an
unrelated sequence such as a single-copy gene or the transcripts of a house-
keeping gene. The coamplification of unrelated sequences imposes strict
constraints on the PCR condittons that allow reliable quantification, which may
have not all been fulfilled in several published data. First, it requires the use of
two primer pans m one reaction. These four primers have to be checked for
compatibility, i.e., for similar melting temperature and for absence of primer-
primer binding. Second, the difference between the initial amount of target
(7’,> and standard (SO) should not be too excessrve. The difference must be
sufficiently small so that the amount of product of both templates ~111 exceed
the detection limit before the end of the exponential phase IS reached, i.e., the
difference between
T,,
and S, should be wtthm reasonable hmrts. Furthermore,
the mRNA levels of the housekeeping genes may not remain constant in all
conditions. Finally and foremost, both templates should amplify with the same
efficiency, the most difficult requirement to be met.
In order to determine the copy number of amplified genes or the number of
infecting virus particles, a sequence belonging to a single-copy gene is
often coamplified as an internal standard. Two of the many examples from
the literature are the analysis of the copy number of the dihydrofolate reductase
(DHFR) gene in drug-resistant tumor cells (6) and of the N-myc gene
amplification m neuroblastoma (7).
For me analysts of the relative quantny of gene expression at the mRNA level by
RT-PCR, many authors have coamplified as an internal standard a fragment of a
gene transcript that IS considered to be invariant in the condttions considered. Genes
that have often been coamplified are @actin (8,9), glyceraldehyde phosphate dehy-
drogenase (IO), and /32-microglobulin (8). This method has been applied m a clinical
context for example to the quantification of drug resistance-related gene expression
in tumor cells (8) and for the assessment of viral activity (II).
Quantitative PCR
31
3.2.2. Coamplification of the Target
with an Exogenously Added Sequence: Competitive PCR
3.2.2.1. THE PRINCIPLE OF THE METHOD
The conditions for reliable quantification are much less stringent if the
standard sequence is very similar to the target sequence. A minimum prerequisite
is that the sequences for primer binding are identical in Tand S. Equal amplifica-
tion efficiency of T and S is further favored by similarity in length and m base
composition, The method (12-14) has been called “competitive PCR” (14)
because it allows, at least in principle but not always in practice, to extend the
PCR beyond the exponential phase into the saturation phase, resulting in compe-
tition between both templates for amplification while preserving their initial ratio.
The possibility to extend the PCR into the nonexponenttal phase is very useful in
practice since it avoids the need of additional controls and allows the accumula-
tion of sufficient PCR product for accurate quantification. It is the best method
available. However, before embarking on the technique, it should be realized
that the procedure is usually labor intensive and costly because many reactions
have to be run and analyzed for one quantification.
The method of competitive PCR is shown schematically in Fig. 1. In theory,
To can be determined from the data obtained from only one PCR tube. If T and
S are amplified with the same efficiency, the ratio of their products TJS,, will
remam constant throughout the PCR and the value of TJS,, will remain identi-
cal to the imtial ratio TdS,. Since S, is added as a known quantity and T,, and S,,
are measured, To can be calculated from the equation To = (T, * S,)/S,. In
practice, however, the ratio T&S,, can be most accurately determined when its
value does not differ greatly from 1. Therefore, as described by Gilhland et al.
(14), the usual practice is to construct a standard curve from a dilution series of
the standard. A PCR mixture is made containing all components (including the
target sequence (To) to be quantified) except the standard template, and divided
over several PCR tubes. To these tubes a 2- to IO-fold dilution series of the
standard sequence (S,) is added. Following amplification, both T,, and S,, are
quantified. The standard curve is constructed by plotting the logarithm of
the ratio T,/S,, as a function of the logarithm of S0 (Fig. 1). The value of S0 is read
at the point of equivalence, i.e., the point corresponding to T,&S,, = 1 or log( TJSJ =
0. The quantity To is equal to this value of S,.
Since the sequences of T and S are very similar, the occurrence of the
tr
point will be determined by the sum T,, + S tr . Before the
tr
point is reached, the
value of T,, in each PCR tube of the dilution series will be the same (assuming
equal amplification efficiencies in all tubes), whereas the value of S,, will
change in each adjacent tube according to the dilution factor of S,. This
situation is depicted in Fig. 1, gel bands labeled T,, and S,. When the PCR is
32
Raeymaekers
TARGET(&)
001 0.1 1 10 100
-2 -1 0 1 2
.STANDAAD(S,)
log so
2 1 0 -1 -2 log CroGJ 1
_
Ttf
-a-
%
Fig. 1. Schematic representation of the method of competitive PCR. A series of
PCR tubes containing an unknown amount of template (TO), in the example tentatively
set at 1, 1s spiked with a dilution series of a known amount of standard (SO) (the
respective values and the required logarithmic values are shown below each tube).
The middle part of the figure schematically shows the gel bands obtained after
amplification.
T,
and S, indicate the products obtained when the number of cycles is
restricted to the purely exponential phase.
T,
is the same in each tube and S, differs m
adjacent tubes by the same factor as does S,,*
T,
and S, represent the gel pattern obtained
if the PCR IS run up to saturation. In the latter case
T,
and S, change in opposite
dtrections while still preserving their initial ratio. The graph at the bottom shows the
standard curve constructed from log(T,/S,,) and log SO. The value of
T,,
is equal to
the value of SO read at the point of equivalence.
run up to saturation, competition occurs between Tand S. As a result, the values
of T,, will not be equal in each PCR tube but will be smaller in tubes spiked
with more SO. A further consequence is that the values of S, in each tube will
differ by a factor which is smaller than the dilution factor (Fig. 1, bands labeled
T, and S,). This saturation phenomenon does not affect the standard curve
because this curve is based on the ratio T,,/S,, in each tube, which in prm-
ciple remains constant, whether or not competition occurs. For the same reason,
the effects of tube to tube variation m amplification efficiency are eliminated.
As is clear from the example shown in Fig. 1, theory predicts that the stan-
dard curve of competitive PCR is a straight line with a slope of-l (or a slope of
+l when plotting the inverse ratio S,,/T,J. This property has not been noticed by
many authors. As a consequence, many published standard curves present a
slope that is not equal to 1, There are two possible explanations for a deviating
slope: First, there is a difference in the amplification efficiency of T and S.
This difference is not of equal magnitude in all the PCR tubes of the dilution
series (if the difference in amplification factor is the same in all the tubes, it
can be easily seen from Fig. 1 that the standard curve shifts in parallel without
change of the slope). It has been suggested previously that such a situation may
arise because the PCR tubes containing a higher quantity of S0 sooner reach the
tr point, and thus have spent a greater number of cycles in the saturation phase.
Differences in amphficatton efficiency are more hkely to occur m these later
stages of the amplification process than in the beginning when the amount of
product is small (15). Second, a systematic error in the quantification of faint
bands induces a tilting of the standard curve without altering the position of the
point of equivalence. In this case, the quantification is still correct if the point
of equivalence, but no other point of the curve, is used for quantification. It has
been observed that faint ethidium bromide-stained bands are underestimated
when analyzed on agarose gels, resulting in a tilting of the standard curve (16).
The analysis of the same samples on a polyacrylamide gel resulted in an
orthodox standard curve of slope = 1.
It is clear, therefore, that polyacrylamide gels are better suited for the
quantitative analysis of PCR products than agarose gels. Radioactive labeling
is a better method than fluorescence for quantification over a broad range.
3.2.2.2
CONSTRUCTION OF STANDARD TEMPLATES
The more the standard sequence resembles the target sequence, the greater the
chances that both templates will amplify with the same efficiency in a variety of
conditions, eventually including the saturation phase of PCR. A minimum
requirement is that T and S possess the same sequences for primer binding. On
the other hand, both sequences should differ in such a way that both products can
easily be discriminated. The difference can be either a difference in length or the
presence or absence of a specific restriction site (see Note 4).
The closest resemblance is evidently obtained by engineering a specific
restriction site by mutation of one nucleotide. However, the presence of
specific restriction sites in the target as well as in the standard, is preferable to
34
Raeymaekers
a specific restriction site in only one of both sequences because it allows to
control for complete dlgestlon and for heterodimer formation. This control is
done by a double digest with both restriction enzymes (see Note 5).
A somewhat more divergent standard can be easily prepared if the sequence
of interest is known in more than one animal species. In most cases it 1s possible
to find conserved sequences suitable for primer binding sites and encompasstng
a stretch of nucleottdes in which specific restriction sites are present. If the
cDNA clone is not available, a fragment contammg such a sequence can be
amplified by PCR from material of the other species. Preferably a larger
fragment is amplified by using primers located outside the region amplified in
the competitive PCR.
The minimum resemblance is presented by standard sequences that have
only the primer binding sites in common. The preparation of so called PCR
MIMICS by ligation of primers and their complementary sequences to a
restriction fragment of an unrelated sequence has been described by Siebert
and Larrick (17). PCR MIMICS for a whole range of mterleukms and
growth factors are available from Clontech (Palo Alto, CA). Constructs have
also been made that contam a multitude of pairs of primer binding sites suit-
able for the amplification of a range of standards (12,16,18). Thus one con-
struct can be used as standard template for the quantification of a range of
sequences.
When quantifying gene expression at the mRNA level by RT-PCR, an
additional factor has to be taken into account. The reverse transcription step 1s a
potential source of error because of variability in the efficiency of synthesis of
the first strand cDNA. Therefore, several authors have added an exogenous
cRNA standard to the RT reaction Instead of a cDNA standard to the PCR
mix. However, the use of RNA introduces other difficulties because of its
susceptibility to degradation. Furthermore, one has to face the possibility
that a RNA construct that is much shorter than the natural mRNA could be
transcribed with a different efficiency because of, for example, a difference
m secondary structure.
Whatever type of standard is used, the accuracy and reproducibility of the
quantification is appreciably improved by always using the same batch of stan-
dard and by running all samples in the same PCR.
3.2.3. Other Strategies for Quantitative PCR
3.2 3.1. LIMITING DILUTION
Limiting dilution assays are used to determine the frequency of rare positive
entitles among a majority of negative entities. It has been applied m combma-
tion with PCR to quantify a particular DNA sequence relative to the number of
Quantitative PCR
35
starting cells (191, or in combination with RT-PCR to estimate the fraction of
cells expressing a particular gene (20,21). For the latter method to work it is
necessary to isolate RNA after dilution of the cells (21) or to skip the mRNA
isolation step and to perform the reverse transcription reaction directly on the
diluted cells, e.g., as described by Molesh and Hall (20).
A dilution series is made of the sample in PCR tubes, extending up to a
dilution in which the probability of finding a positive cell is very small. At
each dilution, multiple @) replicate samples are run. The results can be
analyzed according to the single-hit Poisson model if the presence of one
positive cell is sufficient to give a positive signal in a reproducible way. There-
fore, many PCR cycles may be required, preferably divided over two steps in a
nested PCR. In addition, great care is needed to avoid false positives.
Several methods have been described to calculate J; the estimate of the
fraction of positive cells in the parent population. Since the description of
these methods is beyond the scope of this chapter, only the simplest of these
procedures are explained, although they are the least accurate (22,23j.
The expected fraction of negative tubes at dilution z (F,) is given by
F, = exp (-f* c,). This expression is the zero term/of the Poisson equation, in
which c, = the number of cells per tube at dilution i. Since f. c, = - In
F,,
the
value offcorresponds to the slope of the regresston lme of a plot of In
F,
as a
function of the number of cells per tube (c,), fitted through the origin.
A first approximation offcan also be derived in a convenient way from the
equation (20):
f = Ck,I[N- C(k, *
c,D)l
(1)
in which N = the total number of cells in all the tubes at all dilutions (N =p * Cc,).
k, = the number of positive tubes at the ith dilution
To use this approximation, only the dilutions that produce mixed positive
and negative tubes should be used along with, at most, one neighboring higher
and lower dilution.
3.2.3.2.
RATIO
PCR
Ratio PCR is a simple method to analyze the relative expression level of
mRNA transcribed from members of a gene family (24). Primers are selected
in perfectly conserved regions in order to amplify all members expressed in
the sample of Interest. In order to allow the discrimination of each sequence
in the PCR product, a further requirement is that the region encompassed by
the primer binding sites contains a specific restriction site in each sequence. It
proved possible to meet these conditions in all seven gene families examined
up till now. Since this method is a kind of competitive PCR, all precautions
required for the latter also apply to ratio PCR.
36
Raeymaekers
3.3. Remarks on the Measurement
of the Total Amount
of Starting Material
Besides the problem of the quantification by PCR of a specific target
sequence in a complex sample, one has to deal with the additional problem of
the measurement of the total amount of this starting material. This character-
lzation implies as well the quantification of the amount of DNA or RNA, which
may pose a problem especially in the case of small amounts of tissue as the
quality control of the startmg material. Quality control 1s particularly important
for clinical samples since they are often obtained under less stringently
controlled conditions than those prevailing in the research laboratory.
If the starting material consists of isolated cells, cell counting is a convenient
way
of
quantification. For small amounts of tissue, the yield of DNA or RNA
may be too low for spectrophotometric quantification. Low amounts of double-
stranded DNA can be estimated by spotting and comparing the intensity of
staining with ethidium bromide to that of a standard series (25). Alternatively,
the content of a single-copy gene or the expression of a housekeeping gene can
be quantified by PCR.
4. Notes
1. It is not necessary to add the radioactive isotope at the start of PCR. It can be
added at a later stage. PCR is then continued for a few but even number of cycles
in order to reach an even distribution of the marker. The molar ratio of the
indlvldual bands is calculated from the sum of the content of the nucleotlde that
was spiked with the tracer and its complementary base, e.g., the CG content if
32P-adCTP has been added.
2. Evidently, to obtain molar ratios for products of different length, the measured
values have to be corrected for the length-dependent incorporatlon of the mterca-
lating dye.
3. Filter-containing pipet tips from some manufacturers cannot be tilled to the
normal maximal volume as their equivalents without filter. The use of such tips
makes life unnecessarily difficult.
4. In addition, PCR products have been quantified by hybridization with specific
probes. This method appears rather cumbersome and will not be farther
considered here.
5. When digesting with both restriction enzymes m combmation, the amount of
PCR fragment remaining at the position m the gel correspondmg to Its original
length should be neghglble. Incomplete digestlon by one of the restriction
enzymes would result in erroneous results. Keep in mind that PCR mixtures are
strongly buffered at a pH that is not optimal for most restriction enzymes The
PCR sample should therefore be sufficiently diluted in the restriction buffer in
order not to affect the pH too much, The dilution factor can be minimized by
selecting restrictlon enzymes that are compatible with a high buffer concentration
Quantitative PC R
37
Since the restriction enzymes are selected for selectively cutting one of the
templates and not the other, the corresponding recognmon sites will not be present
m heterodimers. Thus, a double digest m the presence of heterodtmers will be
incomplete. Heterodimer formation is induced by high product concentration and,
hence, by saturation of the PCR. In principle, the problem of heterodimer forma-
tion can be solved by diluting a sample in fresh PCR mixture and running one or
a few more cycles
References
1. Cross, N. C. P. (1995) Quantitative PCR technique and applications. Br. J.
Haematol. 89,693-697.
2. Sardelh, A. D. (1993) Plateau effect Understandmg PCR limttations. Amplzjkations
A forum for PCR Users Issue 9,2-5.
3 Ferre, F. (1992) Quantitative or semi-quantitative PCR: reality versus myth. PCR
Methods Appl. 2, l-9
4 Kwok, S and Higuchi, R. (1989) Avoiding false positives with PCR. Nature
339, 237,238.
5. Wiesner, R. J. (1992) Dtrect quantitation of picomolar concentrations of mRNAs
by mathematical analysts of a reverse transcription/exponential polymerase chain
reaction assay. Nucleic Acids Res 20,5863,5864.
6 Volkenandt, M., Dicker, A. P , Banerjee, D., Fanin, R., Schweitzer, B., Hortkosht,
T., Danenberg, K , Danenberg, P , and Bertmo, J. R. (1992) Quantttation of gene
copy number and mRNA using the polymerase chain reactton. Proc Sot. Exp.
Blol. Med. 20, l-6.
7 Gilbert, J , Norris, M D., Haber, M., Kavallaris, M., Marshall, G. M., and Stewart,
B. W. (1993) Determination of N-myc gene amplification in neuroblastoma by
differenttal polymerase reactton. Mol. Cell. Pro&es 7,227-234.
8. Hortkosht, T., Danenberg, K. D., Stadlbauer, T. H. W., Volkenandt, M., Shea, L.
C. C , Aigner, K , Gustavsson, B., Leichman, L., Frdsing, R., Ray, M., Gibson, N.
W , Spears, C P., and Danenberg, P. V. (1992) Quantitation of thymtdylate
synthase, dihydrofolate reductase, and DT-diaphorase gene expression m human
tumors using the polymerase chain reaction. Cancer Res 52, 108-l 16.
9. Sugtmoto, T., FuJita, M , Taguchi, T., and Morita, T (1993). Quantttattve determination
of DNA by coamplificatton polymerase chain reaction: a wide detectable range
controlled by the thermodynamic stability of primer template duplexes. Anal.
Bzochem. 211, 170-l 72.
10. Luqmani, Y. A., Graham, M., and Coombes, R. C. (1992) Expression of basic
fibroblast growth factor, FGFRl and FGFR2 in normal and mahgnant human
breast, and comparison with other normal tissues Br. J Cancer 66,273-280.
11. Clementt, M., Menzo, S., Bagnarelh, P., Manzm, A., Valenza A., and Varaldo,
P. E. (1993) Quantitative PCR and RT-PCR in virology PCR Methods AppZ 2,
191-196.
12 Wang, A M., Doyle, M V., and Mark, D. F. (1989) Quantitation of mRNA by the
polymerase chain reaction. Proc. Natl. Acad Sci USA 86,97 17-972 1.