Analysis, sequencing and in vitro expression of PCR products
Bạn đang xem bản rút gọn của tài liệu. Xem và tải ngay bản đầy đủ của tài liệu tại đây (381.86 KB, 24 trang )
Analysis, sequencing and
in vitro expression of PCR
products
5.1 Introduction
Analysis of PCR products is critical in optimizing PCR conditions to yield
reliable and accurate results, and in interpreting the levels of products
generated, for example, in a diagnostic context.
The first part of this Chapter considers how to analyze PCR-amplified DNA
fragments in the most appropriate way for different experimental strategies.
In general it is important to ensure that you develop robust and reproducible
PCR conditions, particularly if they are to become part of a routine high-
throughput screening procedure. Approaches for detection and analysis of
PCR products and for verification of product identity, including direct
sequencing strategies, are considered. Following this, procedures for
quantitation of a specific product are covered. The final section deals with
in vitro expression of PCR products to yield protein products. Real-time
analysis is covered in Chapter 9.
5.2 Analysis of PCR products
There are many ways to analyze PCR products depending upon the infor-
mation required:
● the presence or absence of the target DNA sequence;
● the length of the amplified fragment;
● the yield of PCR product to quantitate the relative or absolute amounts
of the starting DNA or RNA;
● sequence analysis, either by differential probe hybridization or by direct
sequencing of the product.
It will often be possible to predict the size(s) of expected PCR products,
which are of a length defined by the positions of the PCR primers. In other
cases the size of product cannot be predicted, for example in some cDNA
amplification experiments such as RACE-PCR and in some genomic cloning
or walking experiments. Often PCR products are relatively small, in the
range of 0.2–3 kbp, and even in many genomic cloning experiments they
are less than 10 kbp in length. The simplest and most direct methods to
analyze PCR products involve gel electrophoresis.
Gel electrophoresis
The most common and rapid way of analyzing PCR products is by standard
agarose gel electrophoresis. Depending on the expected size of the ampli-
5
fied fragment, a fraction of your PCR reaction should be loaded onto a
0.8–3% agarose gel containing 1 µg ml
–1
ethidium bromide. Usually one-
tenth or one-fifth of the reaction volume is loaded and the remainder is
stored at 4°C or –20°C for subsequent use. An aliquot of loading dye
containing glycerol and a marker such as bromophenol blue should be
added to the sample to assist both loading on the gel and visualization of
the sample migration through the gel. If you have used a reaction mix
already containing a dye, such as described in Chaper 3, then the sample
can be loaded directly.
Appropriate molecular size markers such as a 100 bp or 1 kbp DNA ladder
or bacteriophage lambda or φX174 restriction enzyme digests, available
from a range of manufacturers, or previously characterized PCR products,
should be loaded in adjacent lanes of the gel. The amplified fragment(s)
should be readily visible under ultraviolet transillumination (always use
protective eye-wear and minimize time of exposure) and the gel can be
photographed using a camera or digital imaging system to record the
results. In most cases a 1% agarose gel gives sufficient resolution for DNA
fragments between 500 and 4000 bp. If you are expecting very small
fragments then it is probably better to use a specialized agarose such as
Metaphor® at 3.5% which has very high resolution (10–1000 bp), or
NuSeive® GTG at 4% (50–2000 bp), both from Cambrex Bioproducts. The
latter allows efficient DNA recovery. Other specialty agarose preparations
are also available such as Agarose 1000 (Life Technologies), which provides
resolution of up to 10 bp for PCR products up to 350 bp in length when
used at a concentration of 4.5%. Such gels can be useful for analysis of
multiplex PCRs that contain several PCR products. For very small products,
or for identifying small size differences between products, such as in
microsatellite repeats or single-strand conformational polymorphisms,
nondenaturing or denaturing polyacrylamide gels provide the most
appropriate resolution system (Chapter 11).
If your PCR conditions are optimal and your PCR has worked well you
should be able to visualize an intense sharp band of the expected size.
Sometimes you may also observe small primer-dimer products at the lead-
ing end of the gel (Chapter 3). Frequently these products are most
pronounced in the absence of a specific PCR product. If the PCR conditions
were not optimal or the reaction used degenerate primers (Chapter 3) and
a complex source of template DNA (such as human genomic DNA) you may
see additional bands that are most probably due to nonspecific priming
events. Common reasons for the occurrence of such products include low
annealing temperatures, high Mg
2+
concentrations and/or the occurrence
of similar priming sequences in the complex template source. Usually it is
fairly straightforward to determine which ‘band’ contains the correct DNA
fragment based on its expected size, if known, and its sharper appearance
and higher intensity compared to the lower intensity of nonspecific ampli-
fication products. However, sometimes it is difficult to distinguish between
nonspecific and specific amplification products either due to similar band
intensities or due to the presence of a smear of DNA amplification products.
Smearing of DNA amplification products is most often associated with
nonspecific primer annealing conditions, poor quality DNA or low copy
number template, or a combination of such factors (Chapter 4). In such
88 PCR
cases it is often possible to increase the sensitivity of the analysis in order
to identify the amplified target DNA by, for example, nested PCR or
Southern or dot/slot hybridization (Section 5.3). Such methods can assist
in the optimization of PCR conditions so that you are able to amplify the
desired product routinely and reproducibly, allowing the use of homo-
genous detection methods that do not rely on gel fractionation.
5.3 Verification of initial amplification product
Often a PCR product will be used for subsequent experiments and so it is
important to ensure that the amplified DNA fragment really represents the
DNA sequence of interest. This Section covers hybridization analysis, nested
PCR and restriction analysis, which are all approaches to verify product
identity that can be more rapid for processing a number of samples than
the most direct approach; direct DNA sequence analysis of the PCR product
(Section 5.4)
Southern and dot blot analysis
Southern blot analysis involves the transfer of DNA fragments from an
agarose gel to a nylon membrane by capillary transfer, followed by DNA
hybridization with a specific probe to detect the presence of the target DNA
fragment (1). It offers a sensitive approach for the detection of the target
sequence using probes that are either radiolabeled or nonisotopically labeled,
including enzyme-linked detection systems. DNA hybridization conditions
can be controlled at both the hybridization and post-hybridization stages by
altering the temperature and salt concentration. The use of a probe is more
sensitive than ethidium bromide detection methods and can reveal a target
fragment that was not visible on the original ethidium bromide-stained gel.
In addition when the probe hybridizes it confirms the identity of the
fragment. Although homologous probes from the target gene are preferred,
heterologous probes obtained from a similar gene from another organism also
work well, but may require more optimization and less stringent hybridiza-
tion and post-hybridization conditions.
An alternative and more rapid technique than Southern blot analysis is
dot or slot blotting. Here a sample of the amplification reaction is trans-
ferred directly to a membrane followed by DNA hybridization to a specific
probe. It does not involve agarose gel electrophoresis or capillary transfer
and so is more rapid. Although dot or slot blotting identifies the presence
of the correct amplification product this technique does not determine its
size or the presence of other PCR products. Dot or slot blot analysis is often
used when there are large numbers of PCR samples to be analyzed.
For Southern and dot blot hybridization a range of probe-labeling
strategies are available. Oligonucleotide probes are generally 5′-end labeled
with
32
P by T4 polynucleotide kinase-catalyzed transfer of terminal labeled
phosphate from [λ–
32
P]ATP to the 5′-end of the oligonucleotide. Larger DNA
fragments are often labeled by nick translation or random hexamer-primed
labeling with the incorporation of
32
P from [α
32
P] dCTP or dATP during DNA
synthesis by a suitable DNA polymerase such as T7 DNA polymerase. Probes
may also be labeled nonisotopically with a range of fluorescent dyes, with
Analysis, sequencing and in vitro expression of PCR products 89
crosslinked enzymes such as horseradish peroxidase (HRP) or alkaline
phosphatase (AP), with digoxygenin (DIG), which is detected by a specific
anti-DIG antibody coupled to HRP or AP, with acridinium esters or with
other tags.
Nested PCR
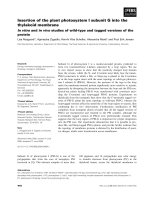
Nested PCR offers a quick and reliable way of verifying a PCR product. It
generally uses two primers that are internal to the product of the first PCR.
The PCR product from the first PCR is used as template DNA for a second
round of PCR with the internal primers. This should yield a smaller PCR
product compared with the original product (Figure 5.1). It is estimated that
nested PCR leads to a 10
4
-fold increase in sensitivity of detection of the
correct product. Even if the first round PCR product is poorly represented
90 PCR
MABC
1.6 kbp
1.0 kbp
0.6 kbp
1
2
Template
13
1.6 kbp
Product A
42
Nested PCR using
primers 1 and 4
Nested PCR using
primers 3 and 4
1.0 kbp 0.6 kbp
Product B Product C
(A)
(B) (C)
Initial PCR amplification
Figure 5.1
Diagrammatic representation of nested PCR and analysis by agarose gel
electrophoresis. (A) Initial PCR amplification product using two original flanking
primers (primers 1 and 2); (B) nested PCR from the primary PCR amplification
product using one original flanking primer (primer 1) and one internal nested
primer (primer 4); (C) nested PCR from the primary PCR amplification product
using two internal nested primers (primers 3 and 4). M denotes molecular size
markers.
within a background of nonspecific products it will be enriched for the
specific template allowing efficient amplification by the nested PCR
primers. By contrast the nonspecific products of the first PCR are unlikely
to have sequences that are complementary to the nested primers and so
there should be no nonspecific amplification after the nested PCR.
Even if it is not possible to design two internal primers because of lack
of sequence information, for example when only limited peptide sequence
data are available, it is usually still possible to perform a nested PCR. One
new internal primer could be used together with one of the original
primers. Alternatively, extending one or both of the original primers by
even two or three nucleotides at their 3′-ends should be sufficient to impose
increased specificity on the nested PCR. As discussed in Chapter 3 it is the
3′-end of the PCR primer that is most critical for determining specificity of
PCR amplification. If the 3′-nucleotide is not complementary to the
template then no amplification should occur. So extending a nested PCR
primer by two or three nucleotides should allow the specific target to be
amplified but not the nonspecific products even though the nested primers
overlap significantly with the original primers. Of course in this case the
use of an enzyme with 3′-exonuclease proofreading activity should be
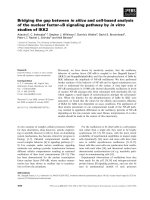
avoided to protect the differentiating 3′-end. An example of the design of
original and nested PCR primers by back-translation of a limited region of
amino acid sequence information is shown in Figure 5.2.
To reduce manipulations and avoid any contamination problems both
the initial and nested PCR reactions can be performed in a single tube. Both
primer pairs are included at the start of the PCR but the nested primers are
designed to have a lower T
m
than the initial primer pair. This allows ampli-
fication of the primary target at an annealing temperature above that of
the nested primers. Then, a second PCR program is performed but at a lower
annealing temperature, allowing the nested primer pair to amplify the
specific PCR product from the initial PCR product. The PCR products can
then be analyzed by agarose gel electrophoresis and should reveal both the
primary amplification product and the smaller nested amplification
product. However, if the primary amplification resulted in multiple bands
or a smear the nested amplification product may be harder to identify. It
is best not to use the initial PCR product for further experiments since the
extended number of PCR cycles increases the chances of PCR-generated
mutations.
An obvious potential problem when verifying the identity of the initial
PCR products by nested PCR is the presence of the original template DNA.
If the initial product is nonspecific, but sufficient original template is
present to allow amplification by the nested primers, a positive result may
lead to the erroneous assumption that the initial PCR product represents
the correct target product. To avoid any amplification from the original
template the first PCR can be diluted so that the absolute amount of original
template is negligible. In a case where there is a defined initial PCR product
then a more reliable approach is to physically purify the PCR product from
the original template DNA, for example by agarose gel electrophoresis and
gel purification (Chapter 6).
In any PCR experiment it is important to perform suitable controls to
ensure specificity of the PCR. In nested PCR the increased sensitivity of the
Analysis, sequencing and in vitro expression of PCR products 91
method makes this much more critical as any contamination will be
enhanced. It is essential to include single primer control reactions to ensure
primer specificity as described in Chapter 4, as well as no DNA and no
primer controls.
Restriction analysis of a PCR product
Restriction digest analysis of PCR products is not commonly used to verify
identity. However, the approach can be efficient giving a clear result and
is relatively rapid and simple requiring mixing of an aliquot of PCR product,
10× restriction buffer and restriction enzyme, incubation to allow digestion
and then agarose gel electrophoresis to visualize the restriction fragments.
Of course it is only useful if a restriction map of the amplified DNA
fragment is available. Not all restriction enzymes are active in the presence
of various PCR components so an additional purification step may be
required. Direct restriction analysis can be useful for verifying site-specific
mutations that introduce or remove a restriction site from a PCR product.
The approach can be coupled with Southern blot hybridization methods
for product identification and can be used to analyze nested PCR products.
In summary, nested PCR offers a rapid and sensitive approach for verify-
ing PCR amplification profiles. However, Southern blot data obtained under
high stringency conditions offer more definitive verification of product
identity. Some combination of approaches may be required in difficult
cases. Of course the most definitive confirmation of identity of a PCR
product is determination of its DNA sequence, a process that can be more
rapid than Southern blot analysis if small numbers of samples are involved
(Section 5.4).
92 PCR
Amino acid sequence
DNA sequence
A D T E W D K G E H G
NNNGCAGACACAGAATGGGACCAAGGAGAACACGGANNNN
G T G G T G G G T G
C C C C
T T T T
Primer for PCR 1
(256)
GCAGACACAGAATGGGACAAAGG
5’ G T G G T G 3’
C C
T T
Primer for nested PCR
(128)
GAATGGGACAAAGGAGAACACG
5’ G T G G G T 3’
C
T
Figure 5.2
Design of degenerate primers from amino acid sequence data. The primer mix for
initial PCR represents a combination of 256 different sequences and is used
together with an appropriate downstream primer in PCR 1. Due to the limited
amount of amino acid sequence data available the nested primer (128 different
sequences) overlaps with part of the PCR 1 primer, but has been extended so that
the 3′-end is different.
5.4 Direct DNA sequencing of PCR products
Once a PCR product has been cloned into a suitable vector the recombinant
molecule can be used for DNA sequence analysis of the PCR insert. However,
during product verification, particularly where there are multiple samples to
screen, it is not always efficient to clone each fragment. A more direct
approach is to perform direct sequence analysis of the PCR product (2,3). It
might be argued that this approach should be routinely used as the only
method of PCR product verification, however, it is not always straight-
forward and can involve greater time and effort than less direct methods
such as nested PCR, in particular when processing large numbers of samples.
Nonetheless, with improvements in automation and sequencing tech-
nologies (see below) and the ever-decreasing cost it seems reasonable to
assume that sequencing will eventually become the preferred approach to
product verification.
It is also important to remember that direct sequencing provides an
additional benefit in that you are sequencing a population of PCR
molecules. Since errors can occur randomly during PCR any single clone is
derived from only one PCR product that may or may not represent the true
natural sequence. It is therefore usually necessary to sequence several
independent clones to ensure a correct consensus sequence is obtained. In
direct sequencing one is determining such a consensus sequence directly.
Only if the PCR is performed on a very small amount of template is there
likely to be a risk that an early PCR error will be detected in the final product
population. However, the reproducibility of direct DNA sequence data will
also depend upon the source of template DNA. In most cases of DNA
isolation from fresh samples there will be no difficulties, but for old samples
in which the DNA may be damaged, more care may be required. A study
of old forensic samples indicated that the level of errors was 30-fold higher
than in control samples, effectively leading to an error rate as high as 1 in
20 nucleotides (4). It was demonstrated by HPLC and ionization mass
spectrometry that there was a decrease in the concentrations of the four
normal bases, and an increase in oxidation products within the old DNA
samples. It was found that both strands of DNA should be sequenced, and
replicate PCRs should be performed and sequenced from the same DNA
samples. Similar arguments would apply to other aged samples, such as
those used for PCR archaeology (Chapter 3).
DNA sequencing chemistry and automation
Dideoxy terminator DNA sequencing (5) involves the incorporation of 2′,3′-
dideoxynucleotide ‘terminators’ into nascent DNA chains (5; Figure 5.3).
Basically, a DNA sequencing reaction results in DNA polymerase-directed
synthesis of new DNA from a primer annealed to a single-strand template
DNA molecule. In general for PCR products the template will be double-
stranded and is heat denatured and rapidly frozen by placing in dry ice or
liquid nitrogen to prevent reannealing of the separated strands. Various
DNA polymerases can be used for sequencing reactions including T7 DNA
polymerase (6) and thermostable enzymes such as Taq (7) or Amplitaq™
(PE Biosystems), Vent® exo
–
(New England Biolabs), Pfu exo
–
(Stratagene)
Analysis, sequencing and in vitro expression of PCR products 93
and Bst DNA polymerase I (8) (BioRad). The DNA polymerase uses the four
dNTPs (dATP, dCTP, dGTP and dTTP) to synthesize DNA by extending the
3′-end of the primer. In each of four reactions, one per nucleotide, the corre-
sponding dideoxynucleoside triphosphate (ddNTP) is also present.
Incorporation of a ddNTP, rather than the corresponding dNTP, results in
chain termination because the absence of a 3′-OH group prevents the
formation of the next phosphodiester bond. So, for example in Figure 5.3,
the A reaction contains the four dNTPs plus ddATP which acts as a termi-
nator during DNA synthesis. As there is no 3′-OH group on the ddNTP it
is not possible to form a phosphodiester bond so DNA synthesis of the
growing DNA strand stops upon addition of ddATP. At each T position in
94 PCR
Template DNA
Primer
AGCGCGGGTTAGCAGTTG
T
ddA termination
products
TCGCGCCCddA
TCGCGCCAAddA
TCGCGCCCAATCGTCddA
TCGCGCCCAATCGTCAddA
ddG termination
products
TCddG
TCGCddG
TCGCGCCCAATCddG
ddC termination
products
TddC
TCGddC
TCGCGddC
TCGCGCddC
TCGCGCCddC
TCGCGCCCAATddC
TCGCGCCCAATCGTddC
TCGCGCCCAATCGTCddC
TCGCGCCCAATCGTCAAddC
TCGCGCCCAAddT
TCGCGCCCAATCGddT
ddT termination
products
AGCT
DNA sequencing gel
Figure 5.3
Dideoxynucleotide chain termination approach for DNA sequencing. An
oligonucleotide primer is extended by DNA polymerase that incorporates the
appropriate dNTPs. Occasionally the polymerase incorporates a dideoxy NTP that
lacks a 3′-OH group and therefore cannot support further nucleotide addition.
This chain is therefore terminated by the ddNTP. Within the population of
molecules will be chains terminated at each position. A high-resolution system
based on polyacrylamide gel or capillary electrophoresis separates the products
and allows the DNA sequence to be read. Either primers or ddNTPs can be
fluorescently labeled allowing detection in an automated DNA sequencer.
the template there is a possibility that either dATP or ddATP will be added
to the extending DNA chain. A small proportion of strands will terminate
while the majority will continue being synthesized until the next T posi-
tion where again a proportion will terminate by ddATP incorporation. Thus
a series of fragments are generated that all start at the 5′-end of the primer
and extend to one of the A positions in the growing chain, and thereby
correspond to each T in the template strand. When these fragments are
separated through a high-resolution denaturing polyacrylamide gel or capil-
lary system they will migrate according to their length with the shortest
fragments migrating fastest. This will create a ladder of fragments that
represent the positions of each A in the synthesized DNA fragment. When
the other reactions, C, G and T, are similarly performed using the same
primer, template and the appropriate ddNTP, they also will produce a series
of fragments terminating at the appropriate ddNTP. Comparing the migra-
tion rates of the fragments from the different reactions allows the sequence
of the DNA to be read starting with the fastest migrating fragments that are
closest to the primer.
In order to be able to read the reaction products they must be labeled in
some way, usually by a radiolabel or a fluorescent label. Radiolabels are
usually used for manual sequencing but the most common method for
today involves the use of fluorescent dyes and automated detection
systems. Two approaches are available; either primer-labelling or more
commonly ddNTP labelling.
A variety of fluorescent dyes are available (e.g. JOE, ROX, FAM and
TAMRA; Chapter 9) and can be linked to primers synthesized with a 5′-
amino group, so that each fragment can be assigned to the corresponding
nucleotide reaction by detection of a characteristic fluorescence wavelength.
Primer labeling provides the highest quality and most uniform sequence
data, however the dyes are commonly incorporated as ddNTPs (such as
BigDye terminators™, Applied Biosystems). This allows any unlabelled
primer to be used for sequencing, a particular advantage when using target
sequence-specific primers rather than generic vector-specific primers.
However, many universal, vector-specific fluorescently labeled primers are
available commercially from several companies (Fluorescein labeled primers,
Takara Mirus Bio; TAMRA labeled primers, USB Corp.).
Fluorescence detection systems include DNA sequencers based on slab
gels (for example, ABI Prism™ 377 from PE Biosystems, ALF DNA
Sequencer™ from Amersham/Pharmacia or the IR
2
from Li-Cor) or capillary
electrophoresis systems (ABI Prism™ 3100 Genetic Analyzer or 3700 series
from Applied Biosystems, Megabase from Molecular Dynamics or CEQ 2000
from Beckman-Coulter). These latter systems are based on DNA separation
in thin-coated capillaries containing nonpolymerized gel matrices and laser
detection systems. The introduction and removal of polymer from the
capillaries, plus loading and running samples and fragment detection, are
automated processes. Automated detection systems allow longer read
lengths (800–1100 nts) than traditional radiolabeled approaches since the
sample can be allowed to run for longer with real-time detection of frag-
ments as they pass a laser and then continue to migrate into the lower
buffer chamber (see below). In radiolabeled approaches the gel must be
stopped and exposed to reveal the band pattern by autoradiography,
Analysis, sequencing and in vitro expression of PCR products 95