hematologic malignancies, methods and techniques
Bạn đang xem bản rút gọn của tài liệu. Xem và tải ngay bản đầy đủ của tài liệu tại đây (3.05 MB, 337 trang )
M E T H O D S I N M O L E C U L A R M E D I C I N E
TM
Edited by
Guy B. Faguet, MD
Hematologic
Malignancies
Methods and Techniques
Edited by
Guy B. Faguet, MD
Hematologic
Malignancies
Methods and Techniques
Humana Press
Humana Press
Cytogenetics Analysis 3
3
From:
Methods in Molecular Medicine, vol. 55: Hematologic Malignancies: Methods and Techniques
Edited by: G. B. Faguet © Humana Press Inc., Totowa, NJ
1
Cytogenetics Analysis
Avery A. Sandberg and Zhong Chen
1. Introduction
1.1. Principles
The establishment of reliable and meaningful chromosomal (cytogenetic,
karyotypic) changes in hematological disorders, primarily the leukemias and
lymphomas, must be based on the examination of the involved cells or tissues.
Thus, in the case of the leukemias bone marrow (BM) aspirations yield optimal
results in the preponderant number of patients, whereas in the lymphomas
affected tissues, usually lymph nodes, are the best source of cells carrying
cytogenetic anomalies. Generally, BM is not a good source of cells for cytoge-
netic analysis in lymphoma. Not only is the marrow often not affected by the
lymphoma, but also when it is, the number of abnormal cells is relatively small
and/or the abnormal cells are not in division and, hence, do not yield a suffi-
cient number of metaphases for cytogenetic analysis. In some situations, blood
cells can be utilized as a source of metaphases affected by karyotypic changes,
e.g., in cases with about 10% immature cells in the peripheral blood (PB), in
chronic lymphocytic leukemia (CLL), in cases where the marrow is fibrotic or
extremely hypocellular, or in determining the presence of Ph+ cells in estab-
lished cases of chronic myelocytic leukemia (CML) (1,2).
Paramount for a successful cytogenetic study is the presence of metaphases
suitable for analysis. In the normal BM, a significant number of dividing cells,
and hence metaphases, are usually present in sufficient number for cytogenetic
analysis without having to resort to culture or lengthy incubation. However, in
some leukemias the number of dividing cells (especially the leukemic ones) is
very low and, hence, incubation of the marrow specimen for a number of days
(2–5 d) may be necessary to generate a significant number of metaphases for
4 Sandberg and Chen
cytogenetic study. The statements just made apply in particular to acute
promyelocytic leukemia (APL) and following chemotherapy and/or radiation
therapy for the leukemia (1,2).
In cases where cytogenetic analysis reveals only abnormal metaphases,
especially those with a balanced translocation, it may be necessary to rule out
a constitutional chromosomal anomaly. This is best established through the
cytogenetic examination of phytohemagglutinin (PHA) stimulated lympho-
cytes of the PB.
A number of mitogenic agents capable of stimulating lymphoid or, less fre-
quently, myeloid cells have been introduced over the years. Outstanding among
these has been PHA capable of stimulating the growth and division of lympho-
cytes of T-cell origin. However, PHA is not routinely added to BM or PB cul-
tures in acute leukemias because PHA may interfere with the evaluation of
spontaneously dividing malignant cells.
The quality of chromosome preparations has been significantly improved
with some new techniques, such as the use of amethopterin for cell synchroni-
zation, the use of short exposures to mitosis-arresting agents, the use of DNA-
binding agents to elongate chromosome (3,4), improved staining procedures,
and the use of conditioned culture medium containing hematopoietic growth
factors [e.g., GCT (giant cell tumor)-conditioned medium primarily for
myeloid disorders (4,5) and PHA/IL-2 (interleukin-2) for both B- or T-cell
lymphoid diseases (6,7)].
The rate of successful cytogenetic analysis varies with the specific type of
disease, and is also related to the adjustment of variables in each laboratory,
such as serum concentration, medium pH, and cell concentration.
1.2. Clinical Applications
The common and recurrent chromosome changes seen in the leukemias and
lymphomas are shown in Tables 1–3 and Figs. 1 and 2.
CML is a pluripotent stem cell disorder characterized cytogenetically by the
Philadelphia chromosome (Ph), the first consistent abnormality observed in a
human cancer. The Ph arises from a reciprocal translocation, t(9;22)(q34;q11)
(8). It is characterized molecularly by the fusion of parts of the C-ABL gene (at
9q34) and the BCR gene (at 22q11), generating an abnormal BCR/ABL fusion
gene (9). Cytogenetically, more than 85% of patients with CML are found to
have the Ph in the CML cells, even during remission, unlike the Ph in acute
leukemia, which is not seen during complete remission. When CML progresses,
additional changes, such as +8, +Ph, i(17q), +19, and +21 are noted in 75–80%
of cases. These changes may precede hematologic progression by 2–6 mo or
occur at the blast phase; therefore, they are valuable prognostic indices. How-
ever, there is no evidence that these additional changes correlate with response
Cytogenetics Analysis 5
to presently used therapy during the acute phase of CML. Clinically, treatment
strategies for CML should include, in addition to the hematologic criteria, the cyto-
genetic findings and the molecular genetic criteria of the BCR/ABL fusion gene
obtained using Southern blotting or polymerase chain reaction (PCR) techniques.
Myelodysplastic syndromes (MDS) are a heterogeneous group of clonal
hematopoietic stem cell disorders characterized by dysplastic and ineffective
hematopoiesis and a high risk of transformation to ANLL. Clonal chromo-
somal abnormalities can be detected in 40–70% of MDS patients at presenta-
tion (see Table 4). Additional aberrations may evolve during the course of
MDS and appear to portend its transformation to leukemia. To confirm the
diagnosis of MDS, morphologic examination of BM aspirate and cytogenetic
analysis should be performed. Moreover, the chromosomal findings have been
shown to be an independent prognostic indicator second only to the French-
American-British (FAB) classification subtype as a predictor of progression to
leukemia and survival (see Table 5).
Table 1
Common Chromosome Changes in Acute Nonlymphocytic Leukemia
(ANLL)
(1
,
12)
der(1;7)(q10;p10)
a
t(9;22)(q34;q11) M1(M2)
t(1;22)(p13;q13) M7 t(11;V)(q23;V)
b
M5(M4)
ins(3;3)(q26;q21q26)
a,d
M1(M7) del(11)(q23) M5(M4)
inv(3)(q21q26)
a,d
M1(M7) +11
t(3;3)(q21;q26)
a,d
M1(M7) del(12)(p11p13)
a
t(3;21)(q26;q22)
a
+13
a
+4 M2, M4 +14
a
–5 or del(5)(q12–13 or q31–35)
a
M1–M4 t(15;17)(q22;q11–21) M3
+6 del(16)(q22)
c
M4EO
t(6;9)(p23;q34)
a
M2(M4) (basophilia) inv(16)(p13q22)
c
M4EO
–7 or del(7)(q22)
a
M1–M5 t(10;16)(p13;q22)
c
M4EO
+8
a
t(16;21)(p11;q22)
t(8;16)(p11;p13) M5b (erythrophagocytosis) i(17)(q10)
a
t(8;21)(q22;q22) M2 (Auer rods+) +19
+9 del(20)(q11–13)
a
del(9)(q22) +21
idic(X)(q13)
a
a
Change also seen in myelodysplastic syndromes.
b
V = chromosomes 6, 9, 17, and 19.
c
Associated with marrow eosinophilia.
d
Associated with platelet and/or megakaryocytic anomalies.
Where appropriate, the type of ANLL or other information associated with a particular chro-
mosome change is also shown.
6 Sandberg and Chen
The acute leukemias, which are classified either as lymphoblastic (ALL) or
nonlymphocytic (ANLL), result from neoplastic transformation of uncommit-
ted or partially committed hematopoietic stem cells. About two thirds of ANLL
and ALL patients have recognizable clonal chromosomal anomalies. These
Table 2
Common Chromosome Changes in B-Lineage
Acute Lymphocytic Leukemia (ALL)
(1,12)
t(1;9)(q23;p13) Pre-B-cell
t(2;8)(p12;q24) L3 (B-cell)
t(4;11)(q21;q23) Biphenotypic, early
B-precursor
t(5;14)(q31;q32)
del(6)(q13–14 or q21–27)
t(8;14)(q24;q32) L3 (B-cell)
t(8;22)(q24;q11) L3 (B-cell)
del(9)(p13–22)
t(9;22)(q34;q11) B-lineage
del(11)(q14–23)
t(11;19)(q23;p13) Mixed, biphenotypic
t(12;V)(p12;V)
a
B-lineage
t(14;19)(q32;q13)
t(14;22)(q32;q11)
a
V = Chromosomes 7, 9, and 17.
Table 3
Common Chromosome Changes in B-Cell
Non-Hodgkin Lymphoma (NHL)
(1,12)
Chromosome changes Histology
t(2;3)(p12;q27) Diffuse large cell
t(2;8)(p12;q24) (Burkitt) small noncleaved cell
t(3;14)(q27;q32) Diffuse large cell
t(3;22)(q27;q11) Diffuse large cell
+3 Follicular large cell, immunoblastic
del(6q) Follicular small cleaved cell
t(8;14)(q24;q32) (Burkitt) small noncleaved
t(8;22)(q24;q11) (Burkitt) small noncleaved
t(11;14)(q13;q32) Centrocytic (variable zone) with CD5
+
cells
+12 Diffuse small cell
t(14;18)(q32;q21) Mixed, small cleaved, and large cell follicular
t(18;22)(q21;q11) Follicular
Cytogenetics Analysis 7
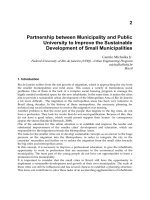
Fig. 1. G-banded karyotype of a marrow cell showing the Philadelphia (Ph) translo-
cation, t(9;22)(q34;q11) (arrows point to breakpoints). This was the only change
present in the affected cells of this case with CML.
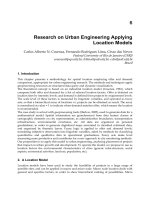
Fig. 2. G-banded karyotype showing trisomy 12 (+12) as the only change in a case
of CLL. This change (+12) is seen in a significant number of CLL cases and is usually
associated with a poor prognosis.
8 Sandberg and Chen
may fall into a specific category that characterizes unique clinical and cytoge-
netic entities. Survival, as a function of cytogenetic findings in ANLL and
ALL, is shown in Table 6. The determination of the chromosomal changes in
acute leukemia serves a number of practical purposes, for example, the estab-
lishment of the exact diagnosis, prediction of prognosis, and as a guide to the
treatment and monitoring phases of therapy or BM transplantation, as well as
some basic purposes, such as supplying the molecular biologist with possible
information on the location or nature of the genes affected by translocations, dele-
tions, and inversions. A case in point is the t(15;17)(q22;q21), seen in APL, which
has been shown to affect a gene related to the α-retinoic acid receptor. This has
led to the use of retinoic acid in the therapy of APL with remarkable results.
More than 90% of non-Hodgkin lymphomas (NHL) have clonal chromo-
somal changes; t(8;14)(q24;q32), t(8;22)(q24;q11) and t(2;8)(p12;q24) have
Table 4
Frequency of Chromosomal Changes and Evolution to ANLL
in Myelodysplasia
Evolution to Chromosomal
FAB subtypes and distribution ANLL changes mo
Refractory anemia (30%) 11% 48% 37
Refractory anemia
With ring sideroblasts (18%) 15% 12% 49
With excess blasts (25%) 25% 57% 19
With excess blasts & transformation (12%) 50% 93% 16
Chronic myelomonocytic leukemia (15%) 15% 29% 22
Table 5
Prognosis in Myelodysplastic Syndromes According
to Cytogenetic Findings
Prognostic category Karyotype Median survival (mo)
Good Normal >24
Deletion 5q
Intermediate Trisomy 8 >18
Poor Monosomy 7
Deletion 7q
Isochromosome 17q <12
Deletion 20q
Complex changes
Cytogenetics Analysis 9
been found in 75–80%, 10–17%, and 5–8% of Burkitt lymphomas (BL) of
both African and non-African origin, respectively (10). Molecularly, fusion of
the MYC gene to immunoglobulin genes has been identified in all BL cases. In
non-Burkitt NHL, a 14q+ marker characterizes about 50% of the cases. Many
of the nonrandom anomalies correlate with histology and immunologic pheno-
type, such as t(14;18)(q32;q21) with follicular (nodular) B-cell lymphomas,
del(6q) with large-cell lymphomas, and t(8;14)(q24;q32) with either small,
noncleaved cell or diffuse large-cell lymphomas.
Approximately 50% of CLL patients have chromosomal abnormalities, the
most common of which are trisomy 12, 14q+, 13q, and 11q abnormalities. An
abnormal karyotype is a poor prognostic sign in CLL, and trisomy 12 and pos-
sibly 14q+ are the least favorable abnormalities. Three factors are of impor-
tance in CLL: lymphocyte doubling time, diffuse lymphocyte infiltration of
BM and lymph nodes, and the chromosomal pattern. Combining these
three factors with the current clinical staging of CLL may optimize therapeutic
decisions.
Table 6
Chromosomal Abnormalities and Survival in ANLL and ALL
Chromosomal abnormality Median survival (mo)
ANLL
Rearrangements of 16q22 18
Translocation (8;21)(q22;q22) (see Fig. 3)14
Normal karyotype 10
Abnormal 11q 18
Abnormal 5 and/or 7 13
Translocation (15;17)(q22;q21)
a
(see Fig. 4) a
ALL
More than 50 chromosomes 58
Deletion 6 (q15q21) 30
Normal karyotype 29
Translocation (9;22)(q34;q11) 12
Less than 46 chromosomes 12
Rearrangements of 14q32 18
Translocation (4;11)(q21;q23) 17
Rearrangements 15
a
Survival for patients with a 15;17 translocation is markedly improved with aggressive treat-
ment and trans-alpha retinoic acid therapy compared with the median survival previously
reported (2 mo)
10 Sandberg and Chen
2. Materials
2.1. Specimens
1. BM aspirate or bone core biopsy: One to 3 mL of BM should be aseptically aspi-
rated into a sodium-heparinized syringe and transferred to a sterile sodium
vacutainer tube. The specimen can be transported with or without culture
medium (RPMI 1640 + 5–10% fetal calf serum [FCS] + 1% penicillin[pen]/
streptomycin[strep]). If the specimen cannot be delivered immediately, it may
be stored at room temperature or in a refrigerator overnight. Do not freeze the
specimen. Cell viability drops off sharply by 72 h after collection. If a marrow
aspirate cannot be achieved, a BM biopsy may be accepted for cytogenetic
analysis.
2. Peripheral blood: Five to 10 mL of PB should be aseptically collected and trans-
ferred, transported, and preserved in the same way as for a BM specimen.
3. Lymph node and spleen: Lymph node and spleen biopsies or samples should be
collected aseptically and transferred to a sterile sodium vacutainer tube contain-
ing culture medium (RPMI 1640 + 5–10% FCS + 1% penicillin/streptomycin).
The specimen should be transported and preserved in the same manner as for BM
specimen.
Fig. 3. G-banded karyotype with the translocation (8;21)(q22;q22) as the only
anomaly. This change is seen almost exclusively in M2 type of ANLL associated with
a relatively good prognosis, Auer bodies in the cells, and a high remission rate.
Cytogenetics Analysis 11
2.2.Reagents and Instruments
1. RPMI 1640/MEM Alpha/FBS complete media: 100 mL RPMI 1640, 70 mL
MEM alpha, 30 mL fetal bovine serum (15%), 2 mL 3% L-glutamine (1%), 2 mL
penicillin/streptomycin (1%) (10,000 units pen/mL; 10,000 µg strep/mL).
2. Colcemid (Gibco Karyomax colcemid solution—10 µg/mL):
a. 1/20 Solution: Dilute 10 mL of the stock solution with 10 mL of sterile deion-
ized water to a final concentration of 5 µg/mL). Store at 4°C.
b. 1/200 Colcemid solution: Dilute 5 mL of 1/20 colcemid with 45 mL of sterile
deionized water to a final concentration of 0.5 µg/mL). Store at 4°C.
3. Potassium chloride—0.068 M:
a. Stock solution: 5.6 g KCl in 100 mL of deionized water.
b. Working solution: 10 mL KCl of stock solution in 100 mL of deionized water.
Prewarm to 37°C before use.
Fig. 4. R-banded karyotype of a cell from a patient with APL (M3) containing the
translocation (15;17)(q22;q11–21) as the only chromosome change. This transloca-
tion is characteristic of APL (M3).
12 Sandberg and Chen
4. Fixative: Freshly prepared 3 parts of absolute methanol to 1 part of glacial acetic
acid, then chill in freezer.
5. Giant cell tumor cell line: Available from the American Type Culture Collection
(ATCC). Maintain cell line in culture and collect supernatant, filter and freeze
at –10°C to –20°C. Bring up new vial after current cells have been passaged
20 times.
6. PHA (Gibco): 5 ml added to the lyophilized reagent. Store at –10°C to –20°C.
7. Interleukin-2 (Il-2) (Boehringer): 200 µL (working solution). Store at –10°C
to –20°C.
8. Ethidium bromide (EB): 10X stock solution (10 mg/mL) diluted with deionized
water to 1X working solution (1 mg/mL).
9. pH 6.8 buffer: Dissolve one Gurr’s pH 6.8 buffer tablet in 1000 mL of distilled
water. Store at room temperature.
10. pH 7.0 buffer: Use one Gurr’s 7.2 buffer tablet and 9 g of NaCl. Make up to 1000 mL
with distilled water and store at room temperature.
11. Giemsa stain (Harleco or Gurr’s): Mix 2.5 mL of Harleco Giemsa and 0.5 mL of
acetone with 40.0 mL of pH 6.8 buffer. Make up new after 2–4 h of previous stain
solution.
12. Stock trypsin solution (Difco): Dissolve 1.25 g of trypsin 1Ϻ250 in 200 mL of
distilled water. Dispense 4 mL into 12 × 75 mm tubes and store frozen.
13. Working trypsin solution: 0.025%. Mix 2.0 mL of stock trypsin solution with
40.0 mL of pH 7.0 buffer solution. Make up just before use in the morning (which
is satisfactory for rest of the day).
14. T-25 flasks.
15. 15 ml centrifuge tubes.
16. CO2 incubator.
17. Disposable pipets.
18. Oven.
19. Slides.
20. Biohazard hood.
21. Coulter counter.
22. Conventional light microscope with phase.
23. 150 ml sterile orange-top bottles.
24. Centrifuge.
25. Large bottle repeat pipettor for fix.
26. Incubator.
27. Slide warmer.
28. Pro-Texx mounting medium.
29. Waterbath.
30. Isopettes.
31. Serological pipets: 5 mL and 10 mL.
Cytogenetics Analysis 13
3. Methods
3.1 BM and PB specimens
3.1.1. Enumeration of Cells—Coulter Counter
Using Isopette vials, make a dilution of each specimen and establish white
cell count (WCC) using the Coulter counter (see Note 1). Determine the amount
of sample per culture. Optimum concentration is 10 × 10
6
cells/10 mL culture.
3.1.2. Quick Differentials
Quick differentials are used when the WCC is suspicious or when the Coulter
counter is not working (see Note 2). The following protocol is for use with the
Hemacolor stain set (EM Diagnostic Systems).
1. Working under the biohazard hood, place 1 drop of BM of PB onto a slide. Using
another slide, spread the sample evenly across the slide. Allow to dry.
2. Immerse the slide in solution 1 (fixative solution) five times, 1 s each time.
Allow to drain.
3. Immerse the slide in solution 2 (phosphate-buffered eosin solution) for 1 s,
remove and hold in air for 1 s. Repeat three times, drain.
4. Immerse the slide in solution 3 (phosphate-buffered thiazine solution) four to
five times, holding in the air for 1 s between immersions.
5. Rinse with distilled water. Allow to dry.
3.1.3. Checking Specimen Adequacy
Specimen cellular adequacy should be made on the culture sheet (see Note 3).
To get an estimate of hypo, hyper or average cellularity using the thin side
of the smear, a low, average, increased, and high WCC would expect approx
40, approx 100, approx 200, and approx 400 white cells/field. Based on these
estimates, the amount of sample to be added to each slide can be derived, as
follows:
WCC (K) Quick differential Amount (mL)
<2 Low 1.00
4–10 Average 0.50
20 Increased 0.25
>40 High 0.10
14 Sandberg and Chen
3.1.4. Culture
Set up the specimen, according to the amount available, with specimen vol-
ume adjusted so that the final concentration of white cells is approximately
1 × 10
6
mL. In specimens with a cell count falling within the normal range,
0.5–0.75 mL of the sample will yield the correct cell concentration. All cul-
tures should be set up in T-25 flasks. Culture priority (see Note 4), based on the
clinical information provided for each patient, is described as follows:
1. For myeloid disorders in patients >2 yr old
a. 24 h overnight with 1/200 colcemid: 10 mL GCT media + BM specimen. Add
0.1 mL of colcemid (1/200) to culture at 5 p.m. on day culture is set up. The
next morning, begin harvest immediately.
b. 48 h culture: 10 mL of GCT media + BM specimen. Harvest at 48 h.
c. Backup culture: 10 mL of GCT media + double amount of BM specimen.
Harvest at 4–5 d, if needed.
2. For lymphoid disorders, anemia of unknown causes, unclassified leukemia, and
leukemias in patients <2 yr old:
a. 24 h overnight with 1/200 colcemid: 10 mL of GCT media + BM specimen.
Add 0.1 mL of colcemid (1/200) to culture at 5 p.m. on day culture is set up.
The next morning, begin harvest immediately.
b. 72 h PHA/IL2: 10 ml of GCT media + marrow specimen + 0.1 ml PHA + 0.1 mL
IL-2. Add 0.1 mL of 1/200 colcemid at 5 p.m. the day before harvest.
c. 48 h culture: 10 mL of GCT media + BM specimen. Harvest at 48 h.
d. Backup culture: 10 mL of GCT media + double amount of BM specimen.
Harvest at 4–5 d, if needed.
3.1.5. Harvest
1. For all cultures, be sure that 0.1 mL of 1/200 colcemid is added at 5 p.m. the day
before harvest.
2. On the morning of harvest, add 0.1 mL of 1 mg/mL EB to all cultures being
harvested. Incubate for 60 min.
3. Empty flasks contents into 15 mL conical centrifuge tubes (one tube for each
culture), transferring label from each flask to its tube, and spin down at 1200 rpm
in a tabletop centrifuge for 8 min.
4. Aspirate off supernatant; gently resuspend pellet by tapping.
5. Add 10 mL of prewarmed 0.068 M KCl to pellet and gently mix with a Pasteur
pipet (see Note 5). Add 0.125 mL of 1/20 colcemid. Gently mix. Colcemid on the
backup culture may be increased five times if no metaphases were seen on the
two previous cultures.
6. Allow to stand at 37°C for 30 min. Add 1.0 mL of 3Ϻ1 prefix. Gently mix with
Pasteur pipet.
7. Spin down for 8 min at 1200 rpm in a tabletop centrifuge. Aspirate off supernatant.
Add 10 mL of 3Ϻ1 fix with a 10-mL pipet. Mix with a Pasteur pipet thoroughly
Cytogenetics Analysis 15
(break up clumps if possible, see Note 6). Allow to stand at 0°C (i.e., in ice or in
freezer) for a minimum of 10 min. The specimen can be stored in the refrigerator
at this point, or after the following two fixes, if more time is needed for specimens, or
if the harvest cannot be completed on the same day. Be sure the fix stays cold.
8. Spin down at 1200 rpm for 8 min in a tabletop centrifuge, aspirate off supernatant.
Gently resuspend pellet by tapping before adding 5 mL of 3Ϻ1 fix. Allow to stand
at 0°C (i.e., in ice or in freezer) for a minimum of 10 min. Be sure the fix stays cold.
9. Spin at 1200 rpm in a tabletop centrifuge for 8 min. Aspirate off supernatant and
gently resuspend pellet in remaining fix. Then add 5 mL of cold fresh fix. Allow
to stand at 0°C (i.e., in ice or in freezer) for a minimum of 10 min. Be sure the fix
stays cold.
10. Spin at 1200 rpm in a tabletop centrifuge for 8 min. Aspirate off supernatant; get
close to pellet. Resuspend gently in remaining fix. Add fresh, cold fix, drop by
drop, to desired dilution. Store suspensions at 4°C in refrigerator until slide making.
3.1.6. Slide Preparation
The basis for an informative chromosome analysis often resides in the qual-
ity of the slide preparation (see Note 7). An optimal slide should have
well-spread, but complete, metaphases with a minimum of overlapping chro-
mosomes and no cytoplasmic background around the metaphases. Because the
humidity and the sensitivity of cells to the hypotonic solution are variable, the
ability to adjust the slide-making technique to the prevailing conditions is cru-
cial. Several techniques for making slides are suggested as follows.
1. Use wet slide with bead of water on it or a dry slide.
2. Drop specimen material from a height of 1/2–2 in. (you may blow lightly to aid
spreading).
3. (If needed:) A couple of drops of acetic acid to cell suspension may aid in spread-
ing. Flaming may also improve spreading, but may interfere with banding.
4. Check under phase microscope. Add more fix or respin and resuspend to achieve
proper cell dilution.
5. Put three good quality slides on a 60°C slide warmer to age overnight before
banding. Alternatively, the slides may be heated for 20 min in a 90°C oven. Prior
to banding, expose the slides to UV light in the hood for 45 s.
6. Add 3 mL of fixative to the remaining cell suspension; cap and store tube in the
refrigerator. After analysis is complete, and if the results are normal, the cells
may be discarded. If the results are abnormal, the cells may be stored in a freezer
at –20°C for many years for future use.
3.1.7. Slide Making and Staining (GTG Banding)
1. Treat slides with 0.025 of trypsin solution at pH 7.0. Time of trypsin treatment
varies from one preparation to another. Also, the time increases with age of slides
(see Note 8).
16 Sandberg and Chen
2. Rinse in pH 7.0 buffer for 1–2 s.
3. Rinse in second pH 7.0 buffer solution for 1–2 s.
4. Stain in freshly prepared Giemsa for 60–120 s. (this jar should remain capped at
all times).
5. Rinse the slides in distilled water.
6. Blot the slides gently using bibulous paper until completely dry.
7. Adjust final trypsin and staining times based on the initial microscopic quality of
initial slides.
3.2. Modified Procedures for Lymph Node and Spleen Specimens
3.2.1. Specimen Pretreatment
1. Transfer the specimen to a Petri dish.
2. Add a few drops of culture medium.
3. Cut the specimen into very small pieces with sterile scissors until a cell suspen-
sion is obtained.
3.2.2. Culture, Harvest, Slide Reparation, and Banding/Staining
Follow steps described in Subheading 3.1. for BM and PB specimens (lym-
phoid disorders).
3.3. Analysis
1. In general, a minimum of 20 cells must be counted and analyzed for each case,
such that a rearrangement affecting one band of any chromosome can be detected
in any given cell. The cells must be selected to represent at least two culture
conditions. The individual morphology and band-by-band structure of each chro-
mosome should be checked in each cell analyzed. Difficult cases may have to be
photographed and analyzed on a print.
2. When possible, select cells with at least 300-band resolution and few overlaps.
3. Determination must be made whether one or more clones exist. A clone is defined
as two or more cells having the same rearrangements or additional chromosomes, or
three cells with the same monosomy (11). However, one cell with a normal karyo-
type is considered adequate evidence to indicate the presence of a normal cell line.
4. When a single abnormal metaphase is found in the analysis of the first 20 cells,
an additional 20 cells may be screened. This allows identification of a 10%
abnormal cell line with 87% confidence. Chronic lymphoproliferative diseases
tend to have a low mitotic rate, and a single abnormal cell may represent the only
dividing malignant cell observed in a particular sample (see Note 9).
5. When a patient with previous abnormal results is analyzed and only normal cells
are seen, an additional 10 cells may be screened for the previous abnormality.
This allows detection of 10% mosaicism with 95% confidence.
6. In general, all cases should be shared by two or more technologists. Any study
that has no metaphases or no analyzable metaphases should have an experienced
technologist as the final evaluator (see Note 10).
Cytogenetics Analysis 17
4. Notes
1. Coulter counter background readings must be kept low (less than 100). Flush the
system between readings to avoid problems.
2. Coulter counter readings should take 13 (+/–1 s). If longer, this could mean the
system is clogged. If shorter, the mercury level may be low.
3. Clots may form in the specimen or culture due to inadequate heparin, breakdown
of heparin, or abnormalities in the clotting mechanism of the patient. These clots
may be broken up by the aspiration through a needle or pipet and/or minced.
Clots can trap cells and interfere with the harvesting procedure.
4. Mislabeling is a common source of error. This can be prevented by labeling
and handling only one specimen at a time and by double checking labels and
numbers.
5. Avoid using the same pipet during harvest on two different patients.
6. Cell clumps may form during harvest due to failure to resuspend pellet thor-
oughly prior to fixation, failure to mix cell suspension while adding fixative, or
abundance of erythrocytes. The formation of these clumps may be prevented by
resuspending the pellet thoroughly after hypotonic treatment. Add up to 1 mL of
fixative dropwise while gently tapping the tube. For tubes containing a large pro-
portion of erythrocytes, bring the volume of fixative to 10–15 mL immediately.
It may be necessary to mix the cell suspension gently with a Pasteur pipet or to
split the sample into two tubes, which can be combined after one to two changes
of fixative.
7. Poor spreading of metaphase cells and the presence of cytoplasm often occur
during preparation due to poor fixation and/or poor swelling of cells during
hypotonic treatment. To overcome these problems, the following should be per-
formed: repeating fixation three to four more times, increasing glacial acetic acid
concentration up to 50%, dropping the cell suspension from a greater height,
increasing the angle at which the slide is held, and increasing the humidity when
slides are drying. An increase in humidity may result in poor fixation.
8. Poor G-bands may be a clue to the presence of cytoplasm, age of slides, and high
humidity. The banding results can be improved by increasing the time in perox-
ide and /or trypsin, preparing fresh slides (as in the preceding solution) to improve
the quality of metaphase spreads (slides older than 1 mo may give inconsistent
results). The trypsin treatment may need to be lengthened), and placing slides in
a drying oven or on a slide warmer (60°C) for several hours (perform banding
immediately after removal).
9. BM is a difficult specimen from which to obtain good material for analysis. In
general, the more malignant the cells, the poorer the quality of chromosome
preparations. It is important that the poor quality cells are not skipped over in
favor of the “prettier” cells, as this may bias the results.
10. With occasional specimens, due to the patient’s disease process, there may not be
any or enough mitotic cells to analyze. This fact in itself is informative to the
physician.
18 Sandberg and Chen
References
1. Sandberg, A. A. (1990) The Chromosomes in Human Cancer and Leukemia,
2nd ed, Elsevier, New York.
2. LeBeau, M. M. (1991) Cytogenetic analysis of hematological malignant diseases,
in The ACT Cytogenetics Laboratory Manual, 2nd ed. (Barch, M. J., ed.), Raven
Press, New York, pp. 395–449.
3. Misawa, S., Horiike, S., Taniwaki, M., Abe, T., and Takino, T. (1986) Prefixation
treatment with ethidium bromide for high resolution banding analysis of chromo-
somes from cultured human BM cells. Cancer Genet. Cytogenet. 22, 319–329.
4. Yunis, J. J. (1981) New chromosome techniques in the study of human neoplasia.
Hum. Pathol. 12, 540–549.
5. Morgan, S., Hecht, B. K., Morgan, R., and Hecht, F. (1987) Qualitative and quan-
titative enhancement of BM cytogenetics by addition of giant cell tumor condi-
tioned medium. Karyogram 13, 39–40.
6. Morgan, R., Chen, Z., Morgan, S., Notohamiprodjo, M., Betz, J., Manhas, R.,
Peier, R., Saunders, A., Wilker, S., Stone, J. F., and Sandberg, A. A. (1995) The
PHA/IL2 “COCKTAIL” is an effective cytogenetic mitogen in blood and BM
cells for revealing abnormal clonal karyotypes in lymphoid diseases. Appl.
Cytogenet. 21, 66.
7. Morgan, R., Chen, Z., Richkind, K., Roherty, S. Velasco, J., and Sandberg, A. A.
(1999) PHA/IL2: an efficient mitogen cocktail for cytogenetic studies of non-
Hodgkin lymphoma and chronic lymphocytic leukemia. Cancer Genet. Cytogenet.
109, 134–137.
8. Rowley, J. D. (1973) A new consistent chromosomal abnormality in chronic
myelogenous leukemia identified by quinacrine fluorescence and Giemsa stain-
ing. Nature 243, 290–293.
9. deKlein, A. and Hagemeijer, A. (1984) Cytogenetic and molecular analysis of the
Ph1 translocation in chronic myeloid leukemia. Cancer Surv. 3, 515–529.
10. Zech, L., Haglund, V., Nilsson, K., and Slein, G. (1976) Characteristic chromo-
somal abnormalities in biopsies and lymphoid cell lines from patients with Burkitt
and non-Burkitt lymphomas. Int. J. Cancer 17, 47–56.
11. Mitelman, F. (ed.) (1995) International System for Human Cytogenetic Nomen-
clature, Karger, Basel, Switzerland.
12. Heim, S. and Mitelman, F (1995) Cancer Cytogenetics, 2nd ed., Wiley-Liss
New York.
FISH Analysis 19
19
From:
Methods in Molecular Medicine, vol. 55: Hematologic Malignancies: Methods and Techniques
Edited by: G. B. Faguet © Humana Press Inc., Totowa, NJ
2
FISH Analysis
Avery A. Sandberg and Zhong Chen
1. Introduction
1.1. History and Principles
In situ hybridization of specific DNA or RNA sequences to cellular targets
was developed over 20 yr ago (1,2). The early techniques employed isotopi-
cally labeled probes and subsequent autoradiographic detection using a photo-
graphic emulsion overlying the metaphase chromosomes, nuclei, or whole
cells. However, autoradiography requires long exposure periods, and is not
practical for clinical application. In the late 1970s, nonisotopic methods of
nucleic acid labeling were developed. The subsequent improvements in the
detection of reporter molecules using immunocytochemistry and immunofluo-
rescence, in conjunction with advances in fluorescence microscopy and image
analysis, have made the technique safer, faster and reliable.
During the past few years fluorescence in situ hybridization (FISH) has
emerged as an extremely important tool for both basic and clinical research
and application. This chapter focuses on FISH with DNA probes only. FISH is
a technique that allows DNA sequences to be detected on metaphase chromo-
somes and interphase nuclei in tissue sections by using DNA probes specific
for entire chromosomes or single unique sequences/genes. The steps of a FISH
procedure are summarized in Fig. 1. In general, a specimen is treated with heat
and formamide to denature the double-stranded DNA to become single
stranded. The target DNA is then available for binding to a DNA probe with a
complementary sequence that is also similarly denatured and single stranded.
The probe and target DNA then hybridize to each other in a duplex based on
complementary base pairing. The probe DNA is tagged with a hapten (such as
biotin or digoxigenin) or is directly labeled with a fluorescent dye. Detection
20 Sandberg and Chen
of the hapten can be achieved with the application of an antibody tagged with a
fluorescent dye (such as fluorescein, rhodamine, or Texas Red). Hybridization
signals on a target material can be visualized through the use of a fluorescence
microscope (3).
1.2. Comparison of FISH vs Conventional Cytogenetics
A large number of acquired chromosome changes have been reported in
hematological malignancies that correlate with specific clinical, morphologic,
and immunophenotypic features (4,5). Cytogenetic analysis is, therefore, a
powerful tool in the assessment of these conditions. However, cytogenetic
analysis alone is sometimes not sufficient to detect the chromosomal changes
due to the fact that cytogenetic analysis can be performed only on dividing
cells and the limitation of cytogenetic methods in some cases in which the
abnormality is not visible with a conventional optic microscope.
FISH studies of the organization and function of chromosomal nucleic acid
sequences have made it possible to gain information about chromosome
changes in cells that are not in division, extending the possibilities of detecting
anomalies not otherwise visible (particularly when only numerical chromo-
somal changes are to be ascertained). FISH is gaining increasing popularity,
particularly because in addition to being an easy procedure for the detection of
specific sequences in interphase or metaphase cells, it can also be applied to
fixed and paraffin embedded tissues (6–8). However, FISH approaches also
suffer from the shortcoming of the investigator having to know a priori which
probes are to be used in each case being examined. The use of FISH based on
painting and cosmid probes also requires knowledge regarding the exact
anomalies to be ascertained. Detection sensitivity for FISH and other tech-
niques is shown in Table 1.
Fig. 1. Schematic presentation of some of the essential steps involved in FISH
analysis.
FISH Analysis 21
1.3. Clinical Applications of FISH in Hematologic Malignancies
During the last decade there has been an exponential increase in the applica-
tion of FISH techniques to various facets of human genetics (7–11). The rapid
advances in the human genome effort, and the continuing elucidation of the
genetic pathways of human diseases, have yielded readily available nucleic
acid reagents required for the clinical application of FISH technology. FISH
has been widely used to study the genetic events underlying hematopoietic
disorders and to classify these disorders in a meaningful way, as well as to
monitor the response to various therapeutic interventions (see Table 2). Both
numerical and structural chromosome abnormalities are amenable to FISH
analysis. A brief overview of examples of application of FISH in the study of
hematologic disorders is given here.
1.3.1. Acute Lymphoblastic Leukemia (ALL)
Hyperdiploidy is found in 16–23% of adults and in up to 40% of children
with ALL. The favorable prognosis associated with high hyperdiploidy (51–68
chromosomes) in children and adults with ALL is well established. FISH has
been reported to potentially detect these cases with aneuploidy. Utilizing probes
for 10 chromosomes (X, 4, 6, 8, 10, 14, 16, 18, 20, and 21), in particular com-
binations and in a stepwise manner, Moorman et al. (9) detected hyperdiploidy
with FISH techniques in 94% of such cases and gave an accurate prediction of
ploidy subgroups in 96% of these cases in a model population of 252 ALL
cases. Our observations are also compatible with these findings. Therefore,
these approaches may identify missing or hidden hyperdiploid cases among
cases that have not been successfully analyzed cytogenetically.
Table 1
Comparison of FISH with Other Assays
Technique Marker Detection limits
Routine pathology Cellular morphology 10
–1
–10
–2
Cytogenetics Chromosome morphology 10
–1
–10
–2
FISH Chromosome structure 10
–2
Gene rearrangement DNA configuration 10
–2
–10
–3
FACS analysis Antigen profile 10
–3
Clonogenic culture In vitro growth 10
–5
PCR DNA/RNA structure 10
–5
FACS, fluorescence activated cell sorting; PCR, polymerase chain reaction.
22 Sandberg and Chen
1.3.2. Acute and Chronic Myeloid Malignancies
FISH, utilizing centromeric and unique sequence probes, has cogent and
practical application in myeloid malignancies, including acute nonlymphocytic
leukemia (ANLL), chronic myelocytic leukemia (CML), myeloproliferative
disorders (MPD), and myelodysplastic syndromes (MDS), where it can be used
to characterize these disorders, e.g., monosomy 7 (–7) and trisomy 8 (+8) in
MDS, +8 and +9 in MPD, t(9;22) in CML, and t(15;17) in ANLL (11,12).
1. Anomalies of 11q23: Reciprocal translocations involving chromosome 11 at band
q23 have been observed in both ALL and ANLL. The incidence of 11q23 abnor-
malities has been estimated to be approximately 5% in adult and childhood ALL
and 75% or greater in infant leukemias. By FISH it was shown that most 11q23
rearrangements involve the same breakpoint cluster region of the MLL gene,
although heterogeneity in the breakpoints in some of the rare rearrangements
exists (13).
2. FISH in combination with morphology (MGG/FISH) was also used to detect
minimal residual disease (MRD) in complete remission (CR) in leukemia
patients with numerical chromosome aberrations at diagnosis. The results indi-
cate that MGG/FISH may be a clinically useful method to detect MRD in acute
leukemia and predict relapse, particularly when repeat studies are performed dur-
ing CR (14).
1.3.3. Chronic Lymphocytic Leukemia (CLL)
Chromosomal abnormalities have been described in about 50% of CLL
patients using conventional cytogenetic methodologies. The most common
abnormalities are trisomy 12 (+12) in 10–18% of cases and structural abnor-
malities of 13q14 in 10–28% of cases. However, accurate and successful cyto-
genetic analysis of specimens has been hindered by the low in vitro mitotic
activity of the critical cell population and culture failure in up to 40% of the
cases of CLL studied. Analysis of interphase cells provides a sensitive tool for
Table 2
FISH Applications in Hematologic Disorders
Detection of diagnostic numerical and structural anomalies
Marker chromosome identification
Detection of gene amplification
Analysis of terminally differentiated or nondividing cells
Analysis of fixed or nonviable cells
Monitoring course of disease
Monitoring effects of therapy
Identification of the origin of a graft postallogenic bone marrow transplantation
FISH Analysis 23
the detection of numerical cytogenetic abnormalities in poorly dividing cells.
With FISH techniques, trisomy 12 has been reported in up to 63% of CLL
cases (15).
Molecular studies, including FISH, have also demonstrated allelic deletion
of the RB1 gene in 21–30% of CLL cases, and of the D13S25 marker, one
megabase (Mb) telomeric to RB1, in 24–60% of the cases. Recently, FISH
studies have provided further evidence for the existence of a new tumor sup-
pressor locus in B-cell CLL located at 13q12.3 (16). BRCA2, located within
the minimal deletion consensus, is a candidate for the gene. Interestingly, in
most conventional chromosome banding studies of B-CLL, 11q deletions have
not been identified as a frequent change. However, with FISH using the yeast
artificial chromosome (YAC) clone 755b11 from the chromosome region
11q22.3-23.1, 11q deletions (20%) were found to be the second most frequent
chromosome aberration following 13q14 deletions (17).
1.3.4. Lymphoma
The most common characteristic chromosome abnormalities in B-cell non-
Hodgkin’s lymphoma (NHL) are translocations involving 14q32, such as
t(8;14)(q24;q32) in Burkitt’s lymphoma, t(14;18)(q32;q21) in follicular NHL,
t(11;14)(q13;q32) in intermediate lymphocytic lymphoma/mantle-cell lym-
phoma, and t(3;14)(q27;q32) in diffuse lymphomas with large-cell compo-
nents. However, cytogenetic investigations are not always successful in
lymphoma, due to poor or lack of metaphase spreads and suboptimal chromo-
somal morphology. Recently, it was reported that a set of probes for interphase
FISH analysis has been successfully established for the detection of tumor-
specific rearrangements of the immunoglobulin heavy-chain (IgH) gene in
B-cell malignancies (18). The results indicate that interphase FISH with IgH
gene probes may be a rapid and reliable method to identify lymphoma-related
gene rearrangements. As mentioned before, 50–75% of mantle-cell lympho-
mas (MCL) are associated with the t(11;14)(q13;q32). Using Southern blot
analysis, a BCL1 breakpoint can be detected in about 50% of MCL cases. Uti-
lizing FISH with two probe sets of differently labeled cosmids, symmetrically
localized at either side of the major translation cluster of BCL1, it was reported
that this FISH approach can be used to distinguish the t(11;14) from other
11q13 rearrangements in hematologic malignancies (19). Following the same
strategy, the t(2;5)(p23;q35), that occurs in 25–30% of anaplastic large-cell
lymphoma, was also reported to be successfully detected by interphase FISH
(20). Furthermore, numerical chromosomal abnormalities in NHL were also
investigated with interphase FISH. One study indicated that trisomy 12 (+12)
was detected in 33% of the patients with follicular lymphoma, polysomy 12 in
37% of patients with diffuse large-cell lymphoma, monosomy 18 in 43% of
24 Sandberg and Chen
cases with CLL, and 28% of those with small-cell lymphocytic lymphoma,
trisomy, or tetrasomy 17 in 27% of NHL patients, and X-chromosome aneup-
loidy in patients with NHL (21).
2. Materials
2.1. Specimens
Due to the high stability of DNA, FISH can be performed on most speci-
mens, ranging from blood and bone marrow smears, buccal smears, cytospins,
and touch print preparations to archival pathology specimens and epithelial
cells in bladder washings and urine. Logically, any nucleus can be evaluated
with FISH methods as long as the DNA in the cell is not degraded (see Note 1).
For hematological disorders, bone marrow (BM) and peripheral blood (PB)
are usually the specimens submitted for FISH analysis. Often these samples
are first processed for chromosomal analysis and FISH is performed on the
remaining fixed-cell pellet in cases of unsuccessful cytogenetics, to optimally
interpret the observed abnormality or as a monitoring tool during treatment.
BM is an ideal tissue for the observation of the in vivo chromosomal situation.
Unstimulated blood cells are examined in order to observe the leukemic cells
spontaneously dividing in the PB. Stimulated PB cells are used to examine
T-cell or B-cell types that may be involved in specific lymphocytic diseases.
BM and PB smears also can be used for rapid FISH analysis. Lysis of red
blood cells and fixation of cells can be accomplished after the smear is made.
Generally, this kind of preparation can be employed with any DNA probe.
2.2. DNA Probes
Three major categories of DNA sequences are used for probes in FISH
analysis.
2.2.1. Centromere-Specific Alpha Satellite DNA Sequence Probes
The most popular type of probe consists of the chromosome centromere-
specific alpha satellite DNA sequences which have a 171-bp DNA monomer,
and are tandem repetitive and polymorphic, and do not code for a gene product
(22). The alpha satellite DNA is almost identical in all human chromosomes
except for 2–3% of the DNA, which is variable to the degree that centromeres
of each individual chromosome can be distinguished and probes to these chro-
mosomes can be generated (23). Other repetitive DNA sequence probes
include those produced from the beta satellite DNA, which consists of a 68-bp
monomer arranged in the same fashion as the alpha satellite DNA and is
located at the tip of each acrocentric chromosome (24), as well as the classical
satellite I DNA, which is an AATGG repeat found on chromosomes 1, 9, 15,
FISH Analysis 25
16, and Y (25). The major use of these satellite DNA probes is in the rapid
enumeration of chromosomal monosomies or trisomies (see Fig. 2). Because
the targets are large and repeated many times, these probes generate large signals.
2.2.2. Sequence-Specific Sequence Probes
The detection of unique single-copy genes (see Fig. 3) is accomplished by
the use of sequence-specific probes. Levels of detection range from sequences
as small as 1 kb up to as large as 300 kb (26). The various FISH unique-sequence
probes are usually employed to detect microdeletion syndromes and rearrange-
ments of oncogenes. Subtelomeric probes are produced from unique sequences
in close proximity to the ends of chromosomes and are often used for the analy-
sis of cryptic translocations.
2.2.3. Whole Chromosome and Arm-Specific Sequence Probes
Whole chromosome probes (WCP) and chromosome arm-specific probes
consist of numerous unique and repetitive sequences from an entire or a partial
chromosome. They can be derived from somatic cell hybrids; single flow sorted
chromosomes, or microdissection of specific chromosomes with PCR amplifi-
cation of the dissected DNA (27,28). These probes are primarily designed for
application on metaphase chromosomes in analysis of markers and complex
chromosomal rearrangements.
2.3. Probe Labeling
In situ hybridization was successfully performed in the past with the use of
light microscopic detection methods utilizing horseradish peroxidase and other
immunocytochemical reagents. However, except for the alpha satellite probes,
unique sequence in situ hybridization probes cannot be easily resolved using a
light microscope. FISH probes are more readily visualized with fluorescence
microscopy.
Direct and indirect procedures are the two types of commonly used nonra-
dioactive hybridization methods. Incorporation of nonisotopic reporter mol-
ecules into probes is achieved enzymatically or chemically (29). In the direct
procedure, probe nucleotides are directly labeled with fluorochromes. The
bound probe and target can be visualized directly with fluorescence micros-
copy. Incorporation of fluorochromes into probes can be accomplished with
the use of polymerase enzymes and labeled nucleoside triphosphates (30). In
the indirect method, DNA probes are tagged with a hapten, the most com-
monly used being biotin or digoxigenin. Biotin binds to avidin or streptavidin
with high affinity and is used for the detection of biotin-labeled probes. Anti-
bodies to digoxigenin are used for the detection of digoxigenin-labeled probes.
26 Sandberg and Chen
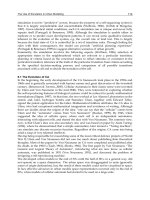
Fig. 2. In this plate are shown some representative results obtained with FISH.
(upper left) Two signals obtained with a centromeric probe for chromosome 7 in a
normal interphase cell. (upper right) Two signals obtained with a centromeric probe
for chromosome 8 in a normal interphase cell. (middle left) Signals obtained when two
differently labeled probes (chromosomes 7 and 9) were applied to a normal inter-
phase cell. The red signals are those of chromosome 7 and the yellow-green for chro-
mosome 9. (middle right) A leukemic interphase marrow cell showing three signals
for the centromeric probe of chromosome 8. This finding indicates trisomy 8 (+8) to
be present. (lower left) An interphase cell from a case with myelodysplastic syndrome
showing three red signals for a centromeric probe for chromosome 8 (trisomy 8) and
four blue signals for the probe for chromosome 10 (tetrasomy 10). (lower right) FISH
using chromosome painting for chromosome 1 in a bone marrow metaphase. Two
normal chromosomes 1 are present, as well as a derivative chromosome (upper right
of metaphase) containing one of the arms of a chromosome 1.