high resolution separation and analysis of biological macromolecules, part a
Bạn đang xem bản rút gọn của tài liệu. Xem và tải ngay bản đầy đủ của tài liệu tại đây (10.91 MB, 635 trang )
Preface
All areas of the biological sciences have become increasingly molecular
in the past decade, and this has led to ever greater demands on analytical
methodology. Revolutionary changes in quantitative and structure analysis
have resulted, with changes continuing to this day. Nowhere has this been
seen to a greater extent than in the advances in macromolecular structure
elucidation. This advancement toward the exact chemical structure of mac-
romolecules has been essential in our understanding of biological processes.
This trend has fueled demands for increased ability to handle wmishingly
small quantities of material such as from tissue extracts or single cells.
Methods with a high degree of automation and throughput are also be-
ing developed.
In the past, the analysis of macromolecules in biological fluids relied
on methods that used specific probes to detect small regions of the molecule,
often in only partially purified samples. For example, proteins were labeled
with radioactivity by
in vivo
incorporation. Another approach has been
the detection of a sample separated in a gel electrophoresis by means of
blotting with an antibody or with a tagged oligonucleotide probe. Such
procedures have the advantages of sensitivity and specificity. The disadvan-
tages of such approaches, however, are many, and range from handling
problems of radioactivity, as well as the inability to perform a variety of
in vivo
experiments, to the invisibility of residues out of the contact domain
of the tagged region, e.g., epitope regions in antibody-based recognition re-
actions.
Beyond basic biological research, the advent of biotechnology has also
created a need for a higher level of detail in the analysis of macromolecules,
which has resulted in protocols that can detect the transformation of a single
functional group in a protein of 50,000-100,000 daltons or the presence of
a single or modified base change in an oligonucleotide of several hundred
or several thousand residues. The discovery of a variety of posttranslational
modifications in proteins has further increased the demand for a high degree
of specificity in structure analysis. With the arrival of the human genome
and other sequencing initiatives, the requirement for a much more rapid
method for DNA sequencing has stimulated the need for methods with a
high degree of throughput and low degree of error.
The bioanalytical chemist has responded to these challenges in biological
measurements with the introduction of new, high resolution separation and
detection methods that allow for the rapid analysis and characterization of
macromolecules. Also, methods that can determine small differences in
xii PREFACE
many thousands of atoms have been developed. The separation techniques
include affinity chromatography, reversed phase liquid chromatography
(LC), and capillary electrophoresis. We include mass spectrometry as a
high resolution separation method, both given the fact that the method is
fundamentally a procedure for separating gaseous ions and because separa-
tion-mass spectrometry (LC/MS, CE/MS) is an integral part of modern
bioanalysis of macromolecules.
The characterization of complex biopolymers typically involves cleavage
of the macromolecule with specific reagents, such as proteases, restriction
enzymes, or chemical cleavage substances. The resulting mixture of frag-
ments is then separated to produce a map (e.g., peptide map) that can be
related to the original macromolecule from knowledge of the specificity of
the reagent used for the cleavage. Such fingerprinting approaches reduce
the characterization problem from a single complex substance to a number
of smaller and thus simpler units that can be more easily analyzed once
separation has been achieved.
Recent advances in mass spectrometry have been invaluable in de-
termining the structure of these smaller units. In addition, differences in
the macromolecule relative to a reference molecule can be related to an
observable difference in the map. The results of mass spectrometric mea-
surements are frequently complemented by more traditional approaches,
e.g., N-terminal sequencing of proteins or the Sanger method for the se-
quencing of oligonucleotides. Furthermore, a recent trend is to follow
kinetically the enzymatic degradation of a macromolecule (e.g., carboxy-
peptidase). By measuring the molecular weight differences of the degraded
molecule as a function of time using mass spectrometry [e.g., matrix-assisted
laser desorption ionization-time of flight (MALDI-TOF)], individual resi-
dues that have been cleaved (e.g., amino acids) can be determined.
As well as producing detailed chemical information on the macromole-
cule, many of these methods also have the advantage of a high degree of
mass sensitivity since new instrumentation, such as MALDI-TOF or capil-
lary electrophoresis with laser-based fluorescence detection, can handle
vanishingly small amounts of material. The low femtomole to attomole
sensitivity achieved with many of these systems permits detection more
sensitive than that achieved with tritium or 14C isotopes and often equals
that achieved with the use of 32p or 125I radioactivity. A trend in mass
spectrometry has been the extension of the technology to ever greater mass
ranges so that now proteins of molecular weights greater than 200,000 and
oligonucleotides of more than 100 residues can be transferred into the gas
phase and then measured in a mass analyzer.
The purpose of Volumes 270 and 271 of
Methods in Enzymology
is to
provide in one source an overview of the exciting recent advances in the
PREFACE xiii
analytical sciences that are of importance in contemporary biology. While
core laboratories have greatly expanded the access of many scientists to
expensive and sophisticated instruments, a decided trend is the introduction
of less expensive, dedicated systems that are installed on a widespread
basis, especially as individual workstations. The advancement of technology
and chemistry has been such that measurements unheard of a few years
ago are now routine, e.g., carbohydrate sequencing of glycoproteins. Such
developments require scientists working in biological fields to have a greater
understanding and utilization of analytical methodology. The chapters pro-
vide an update in recent advances of modern analytical methods that allow
the practitioner to extract maximum information from an analysis. Where
possible, the chapters also have a practical focus and concentrate on meth-
odological details which are key to a particular method.
The contributions appear in two volumes: Volume 270, High Resolution
Separation of Biological Macromolecules, Part A: Fundamentals and Vol-
ume 271, High Resolution Separation of Biological Macromolecules, Part
B: Applications. Each volume is subdivided into three main areas: liquid
chromatography, slab gel and capillary electrophoresis, and mass spectrom-
etry. One important emphasis has been the integration of methods, in
particular LC/MS and CE/MS. In many methods, chemical operations are
integrated at the front end of the separation and may also be significant
in detection. Often in an analysis, a battery of methods are combined to
develop a complete picture of the system and to cross-validate the infor-
mation.
The focus of the LC section is on updating the most significant new
approaches to biomolecular analysis. LC has been covered in recent vol-
umes of this series, therefore these volumes concentrate on relevant applica-
tions that allow for automation, greater speed of analysis, or higher separa-
tion efficiency. In the electrophoresis section, recent work with slab gels
which focuses on high resolution analysis is covered. Many applications
are being converted from the slab gel into a column format to combine
the advantages of electrophoresis with those of chromatography. The field
of capillary electrophoresis, which is a recent, significant high resolution
method for biopolymers, is fully covered.
The third section contains important methods for the ionization of
macromolecules into the gas phase as well as new methods for mass mea-
surements which are currently in use or have great future potential. The
integrated or hybrid systems are demonstrated with important applications.
We welcome readers from the biological sciences and feel confident
that they will find these volumes of value, particularly those working at
the interfaces between analytical/biochemical and molecular biology, as
well as the immunological sciences. While new developments constantly
xiv PREFACE
occur, we believe these two volumes provide a solid foundation on which
researchers can assess the most recent advances. We feel that biologists
are working during a truly revolutionary period in which information avail-
able for the analysis of biomacromolecular structure and quantitation will
provide new insights into fundamental processes. We hope these volumes
aid readers in advancing significantly their research capabilities.
WILLIAM S. HANCOCK
BARRY g. KARGER
Contributors to Volume 270
Article numbers arc in parentheses following the names of contributors.
Affiliations listed are current.
MARIE-ISABEL AGUILAR (]),
Department of
Biochemistry and Centre for Bioprocess
Technology, Monash University, Clayton,
Victoria 3168, Australia
J. UP, El) BANKS, JR. (21),
Analytica of" Bran-
jbrd, Inc., Branford, Connecticut 06405
RONALD C. BEAVIS (22),
Department (~f
Chemistry and Pharmacology, Skirball In-
stitute, New York University, New York,
New York 10016
BRUCE W. BIRREN
(11),
Division of Biology,
California Institute of Technology, Pasa-
dena, California 91125
PE'I'I~ BO~'EK (17),
Institute of Analytical
Chemistry, Academy of Sciences of the
Czech Republic, CZ-611 42 Brno, Czech
Republic
RICHARD M. CAPmOH (20),
Analytical Chem-
istry Center and Department of Biochemis-
try and Molecular Bioh)gy, University of
Texas Medical School, Houston, Texas
77030
BmA~ T. CHAIT (22),
Laboratory for Mass
Spectrometry and Gaseous Ion Chemistry',
The Rockefeller University, New York, New
York 10021
MARCELLA CHIARI (10),
Institute of Hormone
Chemistry, National Research Council, Mi-
hrn 20133, ltaly
GARGI CHOUDIIARY (3),
Department of
Chemical Engineering, Yale University,
New Haven, Connecticut 06520
BRUCE JON COMPTON
(15),
Autolmnnrne Inc.,
Lexington, Massachusetts 02173
MER('EDES DE FRUTOS (4, 6),
lnstituto de
Quirnica Organica, General y Ferrnentaci-
ones lndustriales (C.S.LC.), 28006 Ma-
drM, Spain
Gt/v DROUIN (12),
Department of Biology,
University of Ottawa, Ottawa, Ontario,
Canada K1N 6N5
PE~I~ GE~AUER (17),
Institute of' Analytical
Chemistry, Academy of' Sciences of the
Czech Relmblic, CZ-611 42 Brno, Czech
Republic
CECmIA GRn (10),
Institute of Advanced
Biomedical Technologies, National Re-
search Council, Milan, Italy
ME'I'TE GRONVALD (15),
Department o(
Chemistry and Chemical Engineering, The
Engineering Academy of Denmark, TIC,
7058, A 892036 Copenhagen, Denmark
MIL'L ON T. W. HEARN (1),
Department of Bio-
chemistry and Centre for Bioprocess Tech-
nology, Monash Univet~'ity, Clayton, Vitto-
ria 3168, Australia
STKLLAN HJERTI~N (13),
Department of Bio-
chemistry, Uppsala University, Uppsala,
Sweden
CSABA HORV~,TH (3),
Department (~f Chemi-
cal Engineering, Yale University, New Ha-
ven, Connecticut 06520
IAN JARDINE (23),
Finnigan MAT, San Jose,
California 95134
JAMES W. JORGENSON (18),
Department of
Chemistry, University of North Carolina,
Chapel Hill, North Carolina 27599
LUDMILA KRIVANKOVA (17),
Institute of Ana-
lytical Chernistrv, Academy (2.[ Sciences of
the Czech Republic, CZ-611 42 Brno,
Czech Rel?ublic
BARRY L. KARGER (2),
Department of Chem-
istry, Barnett lnstitltte, Northeastern Univer-
sity, Boston, Massachusetts" 0211.5
IRA S. KRtILL (8),
Department (?r Chemistry,
Northeastern University, Boston, Massa-
chusetts 02115
ERIC' LAI (11),
Department of Pharrnacology,
University of North Cklrolina, Chapel Hill,
North Carolina 27599
JOHN P. LARMANN, JR. (18),
Department of
Chemistry, University (~t' North Carolina,
Chapel Hill, North Carolina 27599
THOMAS T. LEE (19),
Department of Chernis-
try, Stanfbrd Universitv, Stanfbrd, Cal([or-
nia 95305
x CONTRIBUTORS TO VOLUME
270
ANTHONY V. LEMMO (18),
Department qf'
Chemistry, University of North Carolina,
Chapel Hill, North Carolina 27599
BARBARA D. LIPES (l 1),
Department of Phar-
macology, University qf North Carolina,
Chapel Hill, North Carolina 27599
NORlO MAISUBARA (14),
Faculty ().['Science,
Himeji Institute of Technology, Kamigori,
Hyogo 678-12, .lapan
PASCAL MAYER (12),
Department (~[Biology,
UniversiO; of Ottawa, Ottawa, Ontario,
Canada KIN 6N5
JEFF MAZZEO (8),
Waters Chromatography
Division, Millipore Corporation, Milfi)rd,
Massachusetts 01757
ROHIN MHATRE (8),
PerSeptive Biosystenzs,
Inc., Framingham, Massachusetts 01701
SlAN MI('INSKI (15),
Washington State Univer-
sity, Pullman, Washington 99164
AI.vIN W. MOORE. JR. (18),
Department q[
Chemistry, University o[" North Carolina,
Chapel Hill, North Carolina 27599
MILoS V. NOVOTNY (5),
Department qfChem-
istry, bldiana UniversiO', Bloomington, ln-
diana 47405
SANDEEP K. PAl.IWAL (4, 6),
SyStemix Inc.,
Palo Alto, Califi)rnia 94304
FRED E. RF(INIEP, (4, 6),
Departnlent of
Chemistry, Purdue Universitv, Lafilyette,
hldiana 47906
PIER GIORGIO RIGIIFTH (i0),
Faculty of
Pharmacy and Del)artment of Biomedical
Sciences and Technologies, Univers, ity qfl
Mihm, Milan 20133, lmly
ROBERTO RODRI(}t;Ez-DIAz (16),
Bio-Rad
Laboratories, Hercules, Cal([brnia 94547
GIRARD P. ROZIN(I (9).
Waldbronn Ana(vti-
cal Division, ttewlett Packard GmbH,
D76337 Waldbronn, Germany
JAE (7. SCIIWARTZ (23).
Finnigan MAT, San
Jose, Cal([~)rnia 95134
WII.IIAM E. SEIFER'I, Iv,. (20),
Ana(y, tical
Chemist O' Cenwr, University of Texas Med-
ical School, ilouston, Texas 770.t0
GARY W. SKATER (12),
Department of Phys-
ics, University of Ottawa, Ottawa, Ontario,
Canada K1N 6N5
LLOYD R. SNYI)I'.P, (7),
LC Resources, hie.,
Orinda, Cal(fbrnia 94563
MI('H,'XEt_ SzuI.C" (8),
Quality Control R&D
Laboratory, Biogen Corporation, Cam-
bridge, Massachusetts 02142
Sn n(;ERU TERABE (14),
Faculty of Science, Hi-
nteji Institute ()f Technology, Kantigori, Hy-
ogo 678-12, .lapin
TIM WEaR (16),
Bio-Rad Laboratories, lter-
cules, California 94547
CRAn(; M. WHH'EHOt:Sl (21),
Ana@tica o[
Bran ford, Inc., Bran ford, Connecticut
06405
JANET C. WRESTLER (11),
Department oj'
Pharmacology, Universi O, of North Caro-
lina, Chapel Hill, North Carolina 27599
SInAw-LIN WtI (2),
Deparmlent of Ana(y'tical
Chenlistry, Genenteeh, Inc., South San
Francisco, Califi)rnia 94080
EI)WAI',D S. YEUNG (19),
Department of
Chenlistrv and Ames LaboratoiT, Iowa
State University, Ames, lowa 50011
MIN(;DE ZUu (16),
Bio-Rad Laboratories,
Hercules, CaliJbrnia 94.547
[11
RP-HPLC OF PEPTIDES AND PROTEINS 3
[1] High-Resolution Reversed-Phase High-Performance
Liquid Chromatography of Peptides and Proteins
By
MARIE-ISABEL AGUILAR and MILTON
T. W.
HEARN
Introduction
Reversed-phase high-performance liquid chromatography (RP-HPLC)
has become a commonly used method for the analysis and purification of
peptides and proteins. ~-3 The extraordinary popularity of RP-HPLC can
be attributed to a number of factors, including the excellent resolution
that can be achieved for closely related as well as structurally disparate
substances under a large variety of chromatographic conditions; the experi-
mental ease with which chromatographic selectivity can be manipulated
through changes in mobile phase composition; the generally high recoveries,
even at ultramicroanalytical levels; the excellent reproducibility of repeti-
tive separations carried out over long periods of time, due in part to the
stability of the various sorbents under many mobile phase conditions; the
high productivity in terms of cost parameters; and the potential., which is
only now being addressed, for the evaluation of different physicochemical
aspects of solute-eluent or solute-hydrophobic sorbent interactions and
assessment of their structural consequences from chromatographic data.
The RP-HPLC experimental system usually comprises an n-alkylsilica-
based sorbent from which peptides or proteins are eluted with gradients
of increasing concentration of an organic solvent such as acetonitrile con-
taining an ionic modifier, e.g., trifluoroacetic acid (TFA). With modern
instrumentation and columns, complex mixtures of peptides and proteins
can be separated and low picomolar amounts of resolved components can
be collected. Separations can be easily manipulated by changing the gradi-
ent slope, temperature, ionic modifier, or the organic solvent composition.
The technique is equally applicable to the analysis of enzymatically derived
mixtures of peptides and also for the analysis of synthetically derived pep-
tides. An example of the high-resolution analysis of a tryptic digest of
bovine growth hormone is shown in Fig. 1. Figure 1 demonstrates the rapid
1 M. T. W. Hearn (ed.), "HPLC of Proteins, Peptides and Polynucleotides Contemporary
Topics and Applications." VCH, Deerfield, FL, 1991.
2 K. M. Gooding and F. E. Regnier (eds.), "HPLC of Biological Macromotecules: Methods
and Applications." Marcel Dekker, New York, 1990.
3 C. T. Mant and R. S. Hedges (eds.), "HPLC of Peptides and Proteins: Separation, Analysis
and Conformation." CRC Press, Boca Raton, FL, 1991.
Copyright ,~t~ 1996 by Academic Press, Inc.
METHODS IN ENZYMOLOGY. VOL. 270 All rights of reproduction in any form reserved.
4
LIQUID CHROMATOGRAPHY [1]
E
e-
U
e-
e~
<
C
t
0
I I I
7
6 8
5
15 30 45
Time (min)
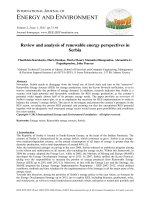
FIG. 1. Reversed-phase chromatographic prolile of a tryptic digest of bovine growth hor-
mone on an n-octadecylsilica sorbent, particle diameter 5/xm, average pore size 30 nm, packed
into a 25 cm × 4.6 mm i.d. column. Gradient elution was carried out from 0 to 50% acetonitrile
in 0.1% TFA over 60 min at a flow rate of 1 ml/min. Detection was at 215 nm. (From A. J.
Round, M. I. Aguilar, and M. T. W. Hearn, unpublished results, 1995.)
and highly selective separation that can be achieved with tryptic digests
of proteins, using RP-HPLC as part of the quality control or structure
determination of a recombinant or natural protein. The chromatographic
separation shown in Fig. 1 was obtained with an octadecylsilica (C~s) station-
ary phase packed in a column of dimensions 25 cm (length) × 0.46 cm
(i.d.). Separated components can be directly subjected to further analysis
such as automated Edman sequencing or electrospray mass spectroscopy.
For the purification of synthetically derived peptides, the crude synthetic
product is typically separated on an analytical scale to assess the complexity
of the mixture. This step is usually followed by large-scale purification
and collection of the product, with an aliquot of the purified sample then
subjected to further chromatography under different RP-HPLC conditions
or another HPLC mode to check for homogeneity. Finally, the isolation
[11
RP-HPLC OF PEPTIDES AND PROTEINS 5
and analysis of many proteins can also be achieved using high-resolution
RP-HPLC techniques. In these cases, the influence of protein conformation,
subunit assembly, and extent of microheterogeneity becomes an important
consideration in the achievement of a high resolution separation and recov-
ery of the active substance by RP-HPLC techniques. Nevertheless, RP-
HPLC methods can form an integral part of the successful isolation of
proteins in their native structure, as has been shown, for example, in the
purification of transforming growth factor c< 4 inhibin, 5 thyroid-stimulating
hormone) growth hormone] and insulin. 8 However, it should be noted
that the recovery of more refractory proteins can present a serious problem
in RP-HPLC either in terms of recovered mass or the loss of activity.
The success of RP-HPLC, which is illustrated by the selected examples
in Table I, 9 ~o is also due to the ability of this technique to probe the
hydrophobic surface topography of a biopolymer. This specificity arises
* F. J. Moy, Y C. Li, P. Rauenbuehler, M. E. Winkler, H. A. Scheraga, and G. T.
Montelione,
Biochemistry,
32, 7334 (1993).
R. G. Forage, J. M. Ring, R. W. Brown, B. V. Mclnerney, G. S. Cobon, P. Gregson,
D. M. Robertson, F. J. Morgan, M. T. W. Hearn, J. K. Findlay, R. E. H. Weltenhall,
H. G. Burger, and D. M. de Kretser,
Proc. Natl Acad. Sci. U.S.A.,
83, 3/)91 (1986).
'~ M. A. Chlenov, E. I. Kandyba, L. V. Nagornaya, I. L. Orlova, and Y. V. Volgin,
,1.
Chromatogr.
631, 261 (1993).
7 B. S. Welinder, H. H. Sorensen, and B. Hansen, J.
Chromatogr.
398, 309 (1987).
s B. S. Welinder, H. H. Sorensen, and B. Hansen,
J. Chromatogr.
361, 357 (1986).
" A. T. Jones and N. B. Roberts,
J. Chromatogr.
599, 179 (1992).
> R. Rosenfeld and K. Benedck,
J. CT, romatogr.
632, 29 (1993).
~J A. Calderan, P. Ruzza. O. Marin, M. Sccchieri, G. Bovin. and F. Machiori,
.l. Chromatogr.
548, 329 ( 1991 ).
< R. H. Buck, M. Cholewinski, and F. Maxl,
J. Chromatogr. 548,
335 (1991).
i~ E. Perez-Paya, L. Braco, C. Abad, and J. Dufourck,
.l. Chromatogr. 548,
351 (1991).
14 S. Visser, C. J. Slangen, and H. S. Rollema,
J. Chromatogr.
548, 361 (1991).
E> S. Linde, B. S. Welinder, B. Hansen, and O. Sonne,
J. Chromatogr.
369, 327 (1986).
1(, D. J. Poll and D. R. K. Harding,
J. Chromatogr.
469, 231 (1989).
~7 R. C. Chloupek, R. J. Harris, C. K. Leonard. R. G. Keck, B. A. Keyt. M. W. Spellman.
A. J. S. Jones, and W. S. Hancock,
J. Chromatogr.
463, 375 (1989).
L,s p. M. Young and T. E. Wheat,
J. Chromatogr.
512, 273 (1990).
> E. Watson and W. C. Kenney,
J. Chromatogr.
6116, 165 (1992).
> D. L. Crimmins and R. S. Thoma,
.l. Chromatogr.
599, 51 (1992).
~ D. Rapaport, G. R. Hague, Y. Pouny, and Y. Shai.
Biochemistry
32, 3291 (la93).
2e j. T{}zsdr, D. Friedman, I. T. Weber, I. Blaha, and S. Oroszlan,
Biochemistry
32, 3347 (1993).
2~ j._j. Lacapere, J. Gavin, B. Trinnaman, and N. M. Green.
Bio{hemist~v
32, 3414 (1993).
~ E. Gazit and Y. Shai,
Biochemistry
32, 3429 (1993).
~5 M. Pacaud and J. Derancourt,
Biochemistry
32, 3448 (1993).
2~, T. P. King, M. R. Coscia. and L. Kochoumian,
Biochemistry
32, 3506 (1993).
2~ K. Mock, M. Hail, 1. Mylchrest, J. Zhou, K. Johnson, and I. Sardine,
J. Chromatogr.
646,
1(,9 (1903).
> P. A. Grieve, A. Jones, and P. F. Alewood,
J. Chromatogr.
646, 175 ([993).
6
LIQUID CHROMATOGRAPHY [ 1 ]
through selective interactions between the immobilized ligand on the sur-
face of the stationary phase and the biopolymer in question. Initially, practi-
cal applications made in this field of high-resolution chromatographic meth-
ods have greatly exceeded the development of detailed theoretical
2u p. F. Alewood, A. J. Bailey, R. I. Brinkworth, D. FaMie, and A. Jones.
J. Chromatogr.
646, 185 (1993).
3~ j. j. Gorman and B. J. Shiel,
J. Chromatogr.
646, 193 (1993).
31 A. T. Jones and J. N. Keen,
J. Chromatogr.
646, 21)7 (1993).
32 L. Fabri, H. Maruta, H. Muramatsu, T. Muramatsu, R. J. Simpson, A. W. Burgess, and
E. C. Nice,
J. Chromatogr.
646, 213 (1993).
33 y. Eswel, Y. Shai, T. Vorhgar, E. Carafoli, and Y. Salomon,
Biochemistry
32, 6721 (1993).
34 N. E. Zhou, C. M. Kay, B. D. Sykes, and R. S. Hodges,
Biochemistry
32, 6190 (1993).
35 X. Liu, S. Magda, Z. Hu, T. Aiuchi, K. Nakaya, and Y. Kurihara,
Eur. J. Biochem.
211,
281 (1993).
~ S. Fulton, M. Meys, J. Protentis, N. B. Afeyan, J. Carlton, and J. Haycock,
Biotechniques
12, 742 (1992).
3v D. Miiller, C. Schulz, H. Baumeister, F. Buck, and V. Richter,
Biochemistry
31, 11138 (1992).
~s p. Le Marechal, B. M. C. Hoang, J M. Schmitter, A. Van Dorsselaer, and P. Decottignics,
Eur. J. Biochem.
210, 421 (1992).
3,~ T. Weimbs and W. Stoffel.
Biochemistry
31, 12289 (1992).
4o S. Murao, K. Ohkuni, M. Nagao, K. Hirayama, K. Fukuhara, K. Oda, H. Oyama, and T.
Shin.
J. Biol. Chem.
268, 349 (1993).
41 D. L. Lohse and R. J. Linhardt,
J. Biol. Chem.
267, 24347 (1992).
42 D. O. O'Keefe. A. L. Lee, and S. Yamazaki,
J. Chromatogr.
627, 137 (1992).
43 G. Chaga, L. Anderson, and J. Porath,
,L Chromatogr.
627, 163 (1992).
47 G. Teshima and E. Canova-Davis, J.
Chromatogr.
625, 21)7 (1992).
45 j. Koyama, J. Nomura, Y. Shojima, Y. Ohtsu, and I. Horii,
J. Chromatogr.
625, 217 (1992).
4~, S. O. Ugwu and J. Blanchard,
J. Chromatogr.
884, 175 (1992).
47 S. Awasthi, F. Ahmad, R. Sharma, and H. Ahmad,
J. Chromatogr.
584, 167 (1992).
4s F. Honda, H. Honda, and M. Koishi,
.l. Chromatogr.
609, 49 (1992).
49 N. Nimura, H. Itoh, T. Kinoshita, N. Nagae, and M. Nomura,
J. Chromatogr.
585,207 (1992).
~0 S. E. Blondelle and R. A. Houghten,
Biochemistrv
30, 4671 (1991).
5~ K. Asai, K. Nakanishi, 1. Isobe, Y. Z. Eksioglu, A. Hirano, K. Hama. T. Miyamoto, and
T. Kato,
J. Biol. Chem.
267, 20311 (1992).
5e G. P. Lunstrum, A. M. McDonough, M. P. Marinkovich, D. R. Keene, N. P. Morris, and
R. E. Burgeson,
.l. Biol. Chem.
267, 20087 (1992).
53 C. J. Rhodes, B. Lincoln, and S. E. Shoelson,
J. Biol. Chem.
267, 22719 (1992).
~4 M. H. Sayre, N. T. Schochner, and R. D. Kornberg,
J. Biol. Chem.
267, 23383 (1992).
55 D. L. Rousseau, Jr., C. A. Guyer, A. H. Beth, I. A. Papayannopoulos, B. Wang, R. Wu,
B. Mroczkowski, and J. V. Staros,
Biochemistry
32, 7893 (1993).
56 H. Peled and Y. Shai,
Biochemistry
32, 7879 (1993).
57 R. L. Moritz and R. J. Simpson,
J. Chromatogr.
899, 119 (1992).
5~ j. Liu, K. J. Volk, E. H. Kerns, S. E. Klohr, M. S. Lee, and I. E. Rosenberg,
J. Chromatogr.
632, 45 (1993).
59 p. R. Griffin, J. A. Coffman, L. E. Hood, and J. R. Yates Ill,
Int. J. Mass Spectrom. Ion
Proc.
111, 131 (1991).
(~ J. B. Smith, L. R. Miesbauer, J. Leeds, D. L. Smith, J. A. Loo, R. D. Smith, and C. G.
Edmonds,
Int. J. Mass Spectrom. Ion Proc.
111, 229 (1991).
[1]
RP-HPLC OF PEPTIDES AND PROTEINS 7
descriptions of the molecular basis of the interactions of biological macro-
molecules with these hydrophobic chromatographic surfaces. 6~ More re-
cently, however, the widespread practical application of RP-HPLC with
biomacromolecules has been accompanied by a significant improvement in
our understanding of the molecular basis of the retention process and its
impact on conformational stability) 2 ~,5 As a consequence, the use of high-
resolution chromatographic techniques for the physicochemical character-
ization of the interactive phenomena of peptides and proteins is also now
providing new insight into the dynamic behavior of biomacromolecules at
hydrophobic surfaces.
Parameters That Control Resolution
Theoretical Considerations
The capacity factor k' of a solute can be expressed in terms of the
retention time t,. through the relationship
k' = (t
to)/to
(1)
where to is the retention time of a nonretained solute. The development
of high resolution separations of peptides and proteins involves the separa-
tion of sample components through manipulation of both retention times
and solute peak shape. The practical significance of k' in defining a particu-
lar chromatographic separation window therefore resides in the concept
of solute selectivity, c~, which is defined as the ratio of the capacity factors
for adjacent peaks as follows:
a = kl/k~
(2)
The second experimental factor that is involved in defining the quality of
a separation is the solute peak width. The degree of peak broadening is
related to the column efficiency, which is normally expressed in terms of
l,l j. Frenz, W. S. Hancock, W. J. Henzel, and C. Horvath,
in
"'HPLC of Biological Macromole-
cules: Methods and Applications" (K. M. Gooding and F. E. Regnicr, eds.), p. 145. Marcel
Dekker, New York, 1990.
~e W. R. Melander, H J. Lin, J. Jacobson, and C. Horvath,
.I. Phys. Chem.
88, 4527
(1984).
~'~ J. Jacobson, W. R. Melander, G. Vaisnys, and C. Horvath,
J. Phys. Chem.
88, 4536 (1984).
~,4 S. Lin and B. L. Karger,
J. Chromatogr.
499, 89 (1990).
~,5 S. A. Cohen. K. Benedek, Y. Tapuhi, J. C, Ford, and B. L. Karger,
Anal. Chem.
144,
275 (1985).
8 LIQUID CHROMATOGRAPHY
[ 1]
"FABLE I
PEPTIDES AND PROTEINS SEPARATED BY RP-HPLC
Peptide/protein Column Mobile phase Ref.
Pepsin isozyme peptide Exsil, 300 A,, Cls, 5 p,m, 0.1% Trifluoroacetic acid (TFA), 0 9
map 15 cm × 4.6 mm i,d. 48% acetonitrile (AcCN), 50 min,
Brain-derived neuro-
trophic factor
Casein kinase-rclated
peptides
Ornipressin
Mellitin
Bovine caseins
Inhibin
Proinsulin
Glycoprotein hormones
Growth hormone
Insulin
Lysozyme tryptic pep-
tides
Tissue plasminogen acti-
vator
Cytochrome c tryptic
map
Platelet-derived growth
factor
Tropomyosins
Pardoxin analogs
Vydac, protein, C4, 15 cm ×
4.6 mm i.d.
ROsil, C~s, 3/xm, 10 cm ×
4.6 mm i.d.
Hypcrsil ODS,
5/zm,
12.5 cm × 4.6 mm i.d.
/zBondapak Cla, 30 cm X
7.8 mm i.d.
HiPore RP-318, 25 cm ×
4.6 mm i.d.
Ultrapore RPSC-C3,
7.5 cm × 4.6 mm i.d.
LiChrosorb RP-18, 5/xm,
25 cm x 4.0 mm i.d.
Vydac 214TP, C4, 10/zm,
25 cm x 4.6 mm i.d.
Nucleosil Cis, 7 /zm, 25 cm ×
4.0 mm i.d.
LiChrosorb RP-18,
5/xm,
25 cm x 4.11 mm i.d.
Vydac C4, 25 cm × 4.6 mm
i.d.
Novapak C~.s, 5 /~m, 15 cm ×
3.9 mm i.d.
Delta-Pak C~s, 300 A, 5/xm,
15 em× 3.9 mm i.d.
Vydac C4, 25 cm ×
4.6 mm i.d.
Vydac 214TP, C4, 25 cm ×
4.6 mm i.d.
C4 sorbent
1.5 ml/min
0.1% TFA, 18-31% AcCN, 44 rain, 10
1 ml/min
20 m M Na~HPO4, pH 5.6/2 m M tel- ll
rabutylammonium hydrogen sul-
fale, 5-25% AcCN, 35 mira 1
ml/min, 25 °
2(1 mM Tctramethylammonium hy- 12
droxide, pH 2.5, 5 30% AcCN,
25 min, 1 ml/min. 60 °
0.1% TFA, 30-70% AcCN. 20 rain, 13
1 ml/min
(/.1% TFA, 23 63% AcCN, 38 rain, 14
0.8 ml/min, 30 °
0.1%
TFA,
0-50% AcCN, 90 min, 5
1 ml/min
125 mM ammonium sulfate, pH 4, 15
3(/ 34% AcCN. 60 min, 1 ml/min
1/.1% TFA, 18-63% AcCN, 30 min, 6
1 ml/min, 100 mM Na=HPO4, pH
6.8, 12.5 50% AcCN, 40 min,
2 ml/min
225 mM (NH4)eHPO4/90 mM 7
NaHePO4, pH 2.5, 0-90% AeCN,
60 min, 1 ml/min
250 mM triethylammonium phos- 8
phatc, pH 3, 25 30% AcCN, 30
rain, 1 ml/min
0.1% formic acid, 5 20% AcCN, 60 16
min, 0.5 ml/min
(I.lc~ FFA, 0-6/)% AcCN, 85 rain, 17
1 ml/min
/).1% TFA or 6 mM HCI or 6 mM 18
HFBA, 0 60% AcCN, 1 ml/min,
35 °
0.1% TFA, 12-15% AcCN, 60 min. 19
1 ml/min
0.1% TFA, 0-90% AcCN, 60 rain, 20
1 ml/min
0.1% TFA, 25 80% AcCN, 40 rain, 21
1 ml/min
[11
RP-HPLC OF PEPTIDES AND PROTEINS 9
TABLE I
(continued)
Peptide/prolein Colmnn Mobile phase Ref.
Equine infectious ane- Vydac C4,300 A., 25 cm × 0.1% TFA, 0-100% AcCN, 28 rain. 22
mia virus protein 4.6 mm i.d. 1 ml/min
Sarcoplasmic reticulum Zorbax C~s, 15 cm × 40 mM ammonium acetate, pH 6.0, 23
CNBr pcptides 4.6 mm i.d. or 0.1% TFA, 0 90% AcCN, 100
min,
1
ml/min
0.1% TFA, 25-80% AcCN, 40 min,
{).6 ml/min
0.1% TFA, 0 6(E/~ AcCN
6-Endotoxin analogs Vydac C4,300 A,, 25 cmx
4.6 mm i.d.
Actin-bundling protein Aquapore C4, 25 cm x
peptides 4.6 mm i.d.
Mellitin analogs Vydac C>, 10 cm ×
9 mm i.d.
Growth hormone tryp- Reliasil Cis, 5 btm, 15 cm x
tic peptidcs
1 mm i.d.
Bactenecins DeltaPak Cns, 300 A,
30 em × 3.9 mm i.d.
TNF-oe-related peptides DeltaPak C~s, 300 A,
30 cm × 3.9 mm i.d.
Ovalbmnin tryptic pep- Vydac 218TP54, 5 /,m,
tides 25 cm × 4.6 mm i.d.
Pepsin-3b peptic pep- Exsil C~s, 300 A, 5 /,m,
tides 15 cm
×
4.6 mm i.d.
RA-inducible midkine Brownlee RP-300, 30 cm ×
2.1 mm
i.d.
Calmodulin-binding Vydac (74,300 A, 25 cm ×
peptides 4.6 mm i.d.
NBD-labcled peptides Vydac C4,300 A, 25 cm ×
4.6 mm i.d.
Amphipathic o~-helical C~,s, 300 A, 6.5/,m, 25 cm x
peptides 10 mm i.d.
Mabinlin I| TSK gel TMS-250, 7.5 cm x
4.6 mm i.d.
Mabinlin ll-related pep- Vydac 218TP54, 25 cm ×
tides 4.6 mm
i.d.
Vasoactive intestinal Poros
R/H,
10 ,u,m, 10 cm ×
polypeptide 4.6 mm i.d.
Atrial natriurctic Vydac CI~, 300 A,, 5 /*m,
pcptide 10 cm × 2.1 mm
i.d.
Carboxymethylthiorc- Vydac C4, 15 cm ×
doxin peptide maps 4.6 mm i.d.
Proteolipid protein ther-
molytic pcptides
Insulin B-chain digests
Cls,
300 ,~, 5/xm, 25 cm x
4.0 mm i.d.
Nucleosil C~s, 5/zin, 25 cm x
4.0 mm i.d.
24
25
0.1~ TFA, 0 30~/~ 2-propanoL 100 26
mira 1 ml/min
0.1% TFA, 0-60f/, AcCN. 30 rain, 27
0.05 ml/min, 40 °
0.1% TEA, 27 45% AcCN, 25 rain, 28
1
ml/min
0.1% TFA, 4.5-50% AcCN. 50 rain, 29
1 ml/min
0.1% TFA, 0 8~ AcCN, 85 min. 30
1 ml/min, 22 °
0.1% TFA, 0 48% AcCN, 70 rain, 31
1.5 ml/min, 22 °
0.1% TFA, 0-60% AcCN, 60 rain, 32
0.1 ml/min, 45 "
(t.1% TFA, 10-60% AcCN. 40 rain, 33
0.9 ml/min
0.1% TFA, 15 60% AcCN, 40 rain. 33
(1.9 ml/min
0.1% TFA, 0-100% AcCN, 100 34
rain, 2 ml/min
0.05% TFA, 10-50% AcCN, 25 35
min, 1 ml/min
0.05% TFA, 5-60% AcCN, 60 rain, 35
1 ml/min
12 mM HC], 0-30% AcCN, 5 min, 36
5 ml/min
0.1'~ TFA, 0-70% AcCN, 60 min, 37
0.2 ml/min
0.1% TFA, 0-70% AcCN, 1 38
ml/min, 10 mM ammonium for-
mate, pH 7.5, 0 60% AcCN
0.1% TFA: 10 mM triethylamine. 39
5 50% AcCN, 45 rain, 1 ml/min
0.05e~ TFA, 0 35% AcCN 40
(continued)
10 LIQUID CHROMATOGRAPHY [11
TABLE I
(continued)
Peptide/protein Column Mobile phase Ref.
Heparin lyase tryptic
peptides
Transforming growth
factor
ee-Pseudo-
monas aeruginosa
exotoxin A
Lactate dehydrogenase
CNBr fragments
HeO?-treated human
growth hormone
H202-treated human
growth hormone tryp-
tic peptides
Ribonuclease A, cylo-
chrome c, lysozyme,
bovine serum albu-
min, ovalbumin
Melanotan I1
Dinitrophenyl-3-
glutathione
Aprotinin, cytochrome
c, bovine serum albu-
min, librinogen, apo-
ferritin
Insulin, cytochromc c,
lysozyme, bovine se-
rum albumin, c~-Iactal-
bumin
Mellitin analogs
Gliostatin and platelet-
derived endothelial
cell growth factor
tryptic peptides
Collagen type-XIl tryp-
lic peptides
Iodinated proinsulin
peptides
RNA polymerase 11
general initiation
fac-
tor- a
Murine epidermal
growth factor mutant
Vydac C~s
Hy-tach Cl~ (nonporous),
30 cm × 4.6 mm i.d.
PEP-RPC HR
5/5,
5 cm ×
5 mm i.d.
PLRP-S, 300 A, 10/xm,
30 cm × 7.5 mm i.d.
Vydac (;ts, 300 A., 5 btm,
25 cm × 4.6 mm i.d.
C~, 300 A, 5 /,tin, 25 cm x
4.6 mm i.d.
Vydac C~s, 5 /xm, 15 cm ×
2.1 mm i.d.
PEP-RPC C>, 5 cm ×
4 mm i.d.
C~s-Coated polyethylene, 10
/xm, 10 cm × 10 mm i,d.
C> nonporous 2, 5, 20/xm.
3 cm × 4.6 mm i.d.
Vydac C~,~, 25 cm ×
4.6 mm i.d.
b~RPC C2/C18,
10 cm ×
2.1 mm i.d.
Vydac C4, 25 cm ×
4.6 mm i.d.
Cp4 sorbent
HiPore RP 304 C~, 25 cm ×
4.6 mm i.d.
Aquapore RP-300 Cs,
22 cm × 4.6 mm i.d.
(/.1% TFA, 0-80% AcCN, 120 rain 41
0.1% TFA, 34 64% AcCN, 6 min, 42
1 ml/min, 80 °
0.l% TFA, 0-5(1% AcCN, 3(1 rain, 43
0.7 ml/min
25 mM ammonium acetate, pH 7.5, 44
34-39% 1-propanol, 100 min,
1 ml/min, 40 °
0.1% TFA, 57-77% AcCN, 40 min, 44
(I.5 ml/min, 40 °
0.1% TFA, 15-60% AcCN, 30 rain,
1.5 ml/min, 40 °
100 mM Na~HPO4/triethylamine.
pH 2.5, 21% AcCN, 0.25 ml/min
0.l% TFA, 0-70% AcCN
0.1% TFA, 5-70% AcCN, 15 rain,
{1.5 ml/min
/).1% TFA. 9-90% AcCN, 20 rain,
2 ml/min, (t.1%
TFA,
20-90%
AcCN, 48 sec, 4 ml/min, 40 °
45
46
47
48
49
0.1% TFA, 10-75% AcCN, 65 rain, 50
1 ml/min
(I.1% TFA, 0-50% AcCN, 45 rain, 51
0.15 ml/min
0.1% TFA, 0-70% AcCN, 200 min,
1 ml/min
0.1% TFA, 16 40% AcCN, 90 min
0.1% TFA, 0-100% AcCN, 90 min,
1 ml/min
0.1%
TFA,
4-40% AcCN, 7(I min,
l ml/min
52
53
54
55
[ 1 ] RP-HPLC OF PEPTIDES AND PROTEINS 11
TABLE 1 (continued)
Peptide/protein Column Mobile phase Ref.
Shaker K ~ channel-
related peptides
Murine interleukin 6
tryptic peptides
Ribonuclease B and at-
acid protein tryptic
peptides
/3-Lactoglobulin B, a-
s 1 -phosphocasein,
myoglobin tryptic
peptides
/.~-Crystallins
/3-Crystallin tryptic pep-
tides
Vydac C4,300 ,~, 25 cm ×
4.6 mm i.d.
Brownlee RP-300 Cs, 7/zm,
5 cm x 0.32 mm i.d.
Vydac Cls, 300 A, 5 /xm,
32 cm X 0.25 mm i.d.
Cl8 ,
5 /,tm, 15 cm X
(/.32 mm i.d.
SynChropak Cs, 300 ,&, 5
p~m, 25 cmx 1.0 mm i.d.
Aquapore RP C~s, 5 cm x
1.0 mm i.d.
0.1% TFA, 25-80% AcCN, 40 rain, 56
0.6 ml/min
0.1% TFA, 0 60% AcCN, 60 min, 57
3.6/xl/min
0.1% TFA, 0 48% AcCN, 120 min, 58
3.0/zl/min
0.1% TFA, 0-100% AcCN, 59
2.0 ~l/min
0.1% TFA, 20-60% AcCN, 40 min, 60
0.05 ml/min
0.1% TFA, 3% glycerol, 3% thioglyc- 60
erol, 10 40% AcCN, 30 rain,
0.05 ml/min
the number of theoretical plates, N, as follows:
U = (tr)2/O-~ (3)
N can also be expressed in terms of the reduced plate height equivalent h,
the column length L, and the particle diameter of the stationary phase dp as
N = hL/dp (4)
Resolution between components of a mixture depends on both selectivity
and band width, according to
Rs k(N)"2(~ - 1)[1/(1 + k')] (5)
This relationship therefore describes the interdependence of the quality of
a separation on the relative retention, relative selectivity, and peak width.
The objective in the development of a high resolution separation is the
choice of experimental conditions that maximize Rs by thorough and sys-
tematic modulation of k' and c~. To obtain high resolution separations, Rs
values > 1 are required. Thus three strategies are available for improving
resolution: (1) increase c< (2) vary k' over a predefined range, e.g., 1 <
k' < 10; or (3) increase N, typically by using very small particles (about
2-5/xm) in microbore columns. This chapter focuses on the steps that can
be taken for enhancing the high resolution separation of peptides and
proteins using RP-HPLC.
12 LIQUID
CHROMATOGRAPHY [
1]
Retention Relationships of Peptides and Proteins in RP-HPLC
The rapid growth in the number of applications of RP-HPLC in peptide
and protein analysis or purification has greatly exceeded the development
of physically relevant, mechanistic models that adequately detail the ther-
modynamic and kinetic processes that are involved in the interaction of
peptides or proteins with nonpolar sorbents. In the absence of rigorous
models that predict the effect of experimental parameters on retention and
band width in terms of the detailed structural hierarchy of the ligand-
peptide or the ligand-protein interaction, investigators often resort to arbi-
trary changes in experimental parameters to effect improved peptide sepa-
rations. However, a number of predictive nonmechanistic optimization
models have been reported and effectively applied to the RP-HPLC elution
of peptides or proteins. 66 7o For example, k' for a peptide separated under
linear elution conditions with isocratic RP-HPLC can be expressed as a
linear function of the organic volume fraction 0 according to
log k' = log k0 - SO (6)
For gradient elution separation of peptides in RP-HPLC, an analogous
relationship between the median capacity factor, k, and the median organic
mole fraction, 0, can be used:
log k = log ko - S~ (7)
where S is the slope of the plot of log k versus ~ and log k0 is the intercept
of these plots. Depending on the magnitude of the S and log k0 values and
how these parameters change with variations in temperature, eluant pH,
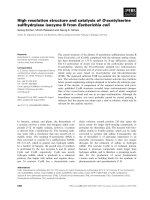
etc., a variety of dependencies of k' on 0 can be specified as depicted in
Fig. 2. These scenarios provide direct insight into the relationship between
solute structure and retention behavior and how improved high resolution
separations can be achieved. For example, cases (c) and (d) in Fig. 2 are
representative of typical behavior for the RP-HPLC behavior of strongly
hydrophobic polypeptides and proteins, while cases (a) and (b) demonstrate
a typical dependency of retention on 0 of polar peptides and small polar
proteins. The S and log k0 values for polypeptides and proteins are usually
large when compared to the corresponding values for small organic mole-
cules.
7°'71
This feature of polypeptide and protein retention behavior is
('" X. Geng and F. E. Regnier,
J. Chromatogr.
296, 15 (1984).
6: L. R. Snyder,
in
"HPLC Advances and Pcrspectivcs'" (C. Horvath, ed.), Vol. 1, p. 2/)8.
Academic Press, New York, 1983.
6sj. L. Glajch, M. A. Quarry, J. F. Vaster. and L. R. Snyder,
Anal. Chem.
58, 280 (1986).
~ M. T. W. Hearn and M. 1. Aguilar,
J. Chromatogr.
359, 33 (1986).
7o M. T. W. Hcarn and M. I. Aguilar,
J. Chrornatogr.
397, 47 (1987).
71 M. A. Stadalius, H. S. Gold, and L. R. Snyder,
J. Chromatogr.
296, 31 (1984).
[ 1 ] RP-HPLC OF PEPTIDES AND PROTEINS 1 3
o
m
FIG. 2. Schematic representation of the retention dependencies for peptides or proteins
chromatographed on RP-HPLC sorbents. Illustrated here are four scenarios for the depen-
dence of log k' versus ~/J. As the contact area increases, the slope of the plots increases, which
results in a narrowing of the elution window over which the solute will elute. {Reprinted
from M. T. W. Hearn et al. Reversed phase high performance liquid chromatography of
peptides and proteins, in "Modern Physical Methods in Biochemistry" (A. Neuberger and
L. L. M. Van Deenan, eds.), p. 113, Copyright 1989 with kind permission of Elsevier Science
NL. Sara Burgerhartstraat 25, 1055 KV Amsterdam, The Netherlands.)
believed to be a consequence of muttisite peptide-ligand interactions. A
practical consequence of this behavior is that high-resolution isocratic elu-
tion of polypeptides or proteins can rarely be carried out, as the experimen-
tal window of solvent concentration required for peptide elution is narrow.
Complex mixtures of peptides or proteins are therefore routinely resolved
by gradient elution methods when high resolution is mandatory.
Evaluation of the S and log k0 values is important for several reasons.
First, this information can be directly applied to the enhancement of resolu-
lion via optimization procedures through the determination of changes in
selectivity and resolution as a function of chromatographic parameters such
as flow rate, solvent strength, temperature, particle diameter, and column
lengthy "7° Second, analysis of these chromatographic variables also pro-
14 LIQUID CHROMATOGRAPHY [11
0.6
£5
0
.J
0.5
0.4
0.3
0.2
0.1
0.0
-0.1
-0,2
0.20
25 27 20 19
2~ 26'.,' '~ \,
128~ '
',)\ ',
.,\,\ \\
,. ,z '\ '\
I
0.25 0.30
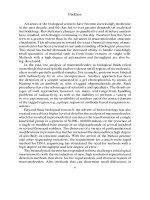
F~o. 3. Plots of log k versus ¢ for D-amino acid-substituted analogs of neuropeptide Y
(NPY)[18-38] separated on a C4 sorbent with acetonitrile as the organic modifier at 25 °. The
plots were derived from best fit analysis to the data points (which have been excluded for
clarity). The amino acid sequence of NPY[18 36] = ARYYSALRHYINLITRQRY-NH2.
The retention plot for each D-substituted analog is designated by the residue position of the
D-amino acid substitution. Data derived from results in Ref. 23.)
vides quantitative guidelines for the preparation of improved hydrophobic
stationary phases through the characterization of different stationary-phase
topographies and the effect of different column configurations.
Third, knowledge of the S and log k0 values greatly simplifies the deter-
mination of physicochemical relationships between solute structure and
chromatographic selectivity. Subtle differences in the experimentally ob-
served S values in response to changes in operating parameters such as
column temperature and surface hydrophobicity for several classes of pep-
tide analogs related to /~-endorphin, 7°'72 myosin light chain, 73 luteinizing
hormone-releasing hormone, 69 interleukin 2, 74 and neuropeptide Y (NPY) 75
have been reported that enable conformationally dependent differences in
the interactive sites on the peptide solutes to be visualized. Figure 3 shows
72 M. I. Aguilar, A. N. Hodder, and M. T. W. Hearn,
J. Chromatogr.
327, 115 (1985).
73 M. T. W. Hearn and M. I. Aguilar,
J. Chromatogr.
392, 33 (1987).
74 M. Kunitani, D. Johnson, and L. R. Snyder,
J. Chromatogr.
371, 313 (1986).
75 M. I. Aguilar, S. Mougos, J. Boublik, J. Rivier, and M. T. W. Hearn,
J. Chromatogr.
646,
53 (1993).
[1] RP-HPLC OF eEPTIDES AND PROTEINS 15
the plots of log k versus ~ for a series of NPY analogs differing in sequence
only by the substitution of a single D-amino acid residue. These plots clearly
demonstrate the sensitivity of RP-HPLC to resolve small differences in
peptide structure. More specifically, the ability of these high-resolution RP-
HPLC procedures to discriminate between these analogs indicates that the
stationary-phase ligands can act as a molecular probe of peptide surface to-
pography.
The mechanism by which peptide or protein solutes are retained in RP-
HPLC depends on the hydrophobic expulsion of the peptide from a polar
mobile phase and concomitant adsorption onto the nonpolar sorbent. 7<77
Under these conditions, peptides or proteins are retained to different ex-
tents depending on their intrinsic hydrophobicities, the eluotropicity of the
mobile phase, and the nature of the sorbent ligands. Experimental data
with species variants of proteins, as well as recombinant mutants, indicate
that proteins interact with the chromatographic surface in an orientation-
specific manner. 78 ~0 Their chromatographic retention behavior in terms of
their affinity and kinetics of the interaction is therefore determined by the
molecular composition of the specific contact region(s). The contact region
for small peptides has been shown to involve the contribution from all or
a large proportion of the molecular surface of the solute. As a result,
the retention time of small peptides in RP-HPLC can be predicted with
reasonable accuracy by summating the retention coefficients for all constit-
uent amino acid residues, a~'s2 For larger polypeptides or proteins, the chro-
matographic retention data indicate that the contact region represents a
relatively small portion of the total solute surface. Although the hydropho-
bic surface area of a protein may increase with increasing molecular weight,
it is not the molecular weight per se but rather the polarity and spatial
disposition of the surface amino acid residues involved in the interaction
with the stationary phase that ultimately control the mechanistic pathway
of the binding process. Since the magnitude of log ko is a measure of the
free energy changes associated with the binding of the solute to the station-
ary phase under initial elution conditions, it can also be anticipated that
log ko values should progressively increase with incremental increases in
solute hydrophobicity. However, if a peptide assumes any degree of pre-
71, W. R. Melander, D. Corradini. and C. Horvath,
,I. Chromatogn
317, 67 (1984).
77 (7. Horvath, W. Melander, and I. Molnar,
J. Chromatogr.
125, 129 (1976).
7'~ J. F. Pollit, G. Thdvenon, L. Janis, and F. E. Regnier,
J. Chromatogr.
443, 221 (1988).
7,~ R. M. Chicz and F. E. Rcgnier,
J. Chromatogr.
500, 503 (1990).
s0 F. E. Regnier,
Science
238, 319 (1987).
st M. (7. J. Wilce, M. I. Aguilar, and M. T. W. Hearn,
J. Chromatogr.
632, 11 (1993).
,~2 D. Guo, C. T. Mant. A. K. Taneja, and R. S. Hodges,
.L Chromatogr.
359, 519 (1986).
16 LIQUID CHROMATOGRAPHY
[ 11
ferred secondary structure or preferred folding, no simple relationship will
exist between the retention time and the summated retention coefficients.
Stationary Phases
The choice of sorbent material is one of the first decisions to be made
in the design of a high resolution RP-HPLC separation of a peptide or
protein. The chromatographic packing materials that are generally used in
RP-HPLC are commonly based on microparticulate porous silica that is
chemically modified by a derivatized silane containing an n-alkyl hydropho-
bic ligand. 8x~4 The most commonly used ligands are n-butyl, n-octyl, and
n-octadecyl, while phenyl and cyanopropyl ligands can also provide alterna-
tive selectivity. ~5 During the immobilization of the ligands, only about half
of the original surface silanol hydroxyl groups react, as a result of steric
crowding of the ligands. The sorbents can then be subjected to further
silanization with a small reactive silane to yield a so-called end-capped
packing material. The nature of the n-alkyl chain is an important factor
that can be used to change selectivity of peptide or protein mixtures. While
the specific molecular basis of these differences in selectivity is not yet
established, the relative hydrophobicity and molecular flexibility of the
ligands together with the degree of exposure of the surface silanol groups
are known to play an important role in the interactive process. 86,s7 An
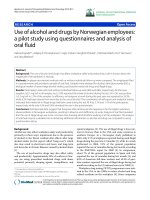
example of the effect of ligand chain length on the resolution of tryptic
peptides of porcine growth hormone is shown in Fig. 4. It can be seen that
the peaks labeled T3 (sequence, EFER) and T13 (sequence, ELEDGSPR)
are fully resolved with the C4 sorbent yet cannot be separated on the Cis
sorbent. Conversely, peptides T5 (sequence, YSIQNAQAAFCFSETI-
PAPTG) and Tls (sequence, NYGLLSCFK) elute as a single peak with
the C4 sorbent but are fully resolved on the Cis sorbent. Moreover, the
choice of the chain length of the n-alkyl ligand can have a significant impact
on the recovery, as well as the conformational integrity of a protein. While
higher protein recoveries have been reported with the shorter and less
hydrophobic n-butyl or cyanopropyl sorbents, proteins have also been iso-
lated in high yield using the n-octadecyl sorbent. 4 ~,.t5 In an attempt to
control the denaturation of proteins by RP-HPLC sorbents, porous and
nonporous silica supports also can be coated with polymethacrylate-based
s~ K. K. Unger, B. Anspach, R. Janzen, G. Jilge, and K. D. Lork,
in
"HPLC Advances and
Perspectives" (C. Horvath, ed.), Vol. 5, p. 2, Academic Press. New York, 1988.
s4 M. Henry,
J. Chromatogr.
544, 413 (1991).
s5 N. E. Zhou. C. T. Mant, J. J. Kirkland, and R. S. Hodges,
J. Chromatogr. 548,
179 (1991).
~' I. Yarovsky, M. I. Aguilar, and M. T. W. Hearn,
Anal. Chem.
67, 2145 (1995).
s7 K. Albert and E. Bayer,
J. Chromatogr.
544, 345 (1991).
[ 1] RP-HPLC OF PEPTIDES AND PROTEINS 17
E
(-
O)
0
c
©
_0
0
<
>
100
75
50
25
100
75
50
25
m
T.+T~,
~~ RP-C4
\
\
\
I I I I I I
10 20 30 40 50 60
T~+T13 i T18 RP-C
~~
18
\
I I I I I I
0 I0
20 30 40 50 60
Time
(minutes)
FI6. 4. The influence of n-alkyl chain length on the separation of an idenlical mixture
of tryptic peptides derived from porcine growth hormone.
Top:
Bakerboud (J. T. Baker,
Phillipsburg, NJ) RP-C4, 25 cm × 4.6 mm i.d., 5-~m particle size, 30-nm pore size.
Bottom:
Bakerbond RP-Cls, 25 cm × 4.6 mm i.d., 5-~m particle size, 30-nm pore size. Conditions,
linear gradient from 0 to 90% acetonitrile with 0.1% TFA over 60 rain, flow rate of 1 ml/min,
25 °. (From A. J. Round, M. I. Aguilar, and M. T. W. Hearn, unpublished results, i995.)
18 LIOUID CHROMATOGRAPHY [ 1 ]
polymers to produce a series of sorbents with varying surface hydropho-
bicity in which the underlying silanol groups also have been masked, ss's9
The use of these sorbents allows peptide and protein selectivity to be
manipulated through changes in the solute conformation.
Silica-based packings are susceptible to hydrolytic cleavage of the silox-
ane backbone, particularly when using mobile-phase pH values greater
than pH 7, even when coated with a layer of polymer such as polybutadiene.
In these cases, where high-pH separations are needed, alternative station-
ary-phase materials have been developed such as cross-linked polystyrene-
divinylbenzene, 9°'91 porous graphitized carbon, 92 and porous zirconia, 93
which all offer superior stability at alkaline pH values and different options
for high resolution separations. However, only the polymeric-based sor-
bents have been used for the RP-HPLC analysis of peptides and proteins.
The geometry of the sorbent particle is also an important factor that
requires consideration. The pore size of the RP-HPLC sorbent generally
ranges between 100 and 300 A, depending on the size of the peptide sol-
utes, while porous materials of 300- to 4000-A pore size should be used
for proteins. The selection of an optimal pore size for a particular sorbent
is made on the basis that the solute molecular diameter must be at least
one-tenth the size of the pore diameter of the packing material to avoid
restricted diffusion of the solute and also to allow the total surface area of
the sorbent material to be accessible. The other important variable of the
reversed-phase material is the particle diameter,
dp.
As is evident from
Eq. (4), resolution improves as the particle diameter decreases. The most
commonly used range of particle diameters with high-resolution RP-HPLC
sorbents is 3-5/xm. However, there are examples of the use of nonporous
particles with smaller particle diameter. ')4
Mobile Phases
The ability to manipulate solute resolution through changes in the com-
position of the mobile phase represents a powerful characteristic of RP-
~s M. Hanson, K. K. Unger. C. T. Mant, and R. S. Hodges,
J. Chromatogr.
599, 65 (1992).
a~) M. Hanson, K. K. Unger, C. T. Mant, and R. S. Hodges,
J. Chromatogr.
599, 77 (1992).
~) N. Tanaka, K. Kimata, Y. Mikawa, K. Hosoya, T. Araki, Y. Ohtsu, Y. Shiojima, R. Tsuboi,
and H. Tsuchiya,
.L Chrornatogr.
535, 13 (1990).
L)I B. S. Welinder,
J. Chromatogr.
542, 83 (1991).
,)2 F. Belliardo, O. Chiantore. D. Berek, I. Novak, and C. Lucarelli,
J. Chromatogr.
506,
371 (1990).
q3 H J. Wirth, K O. Eriksson, P. Holt, M. Aguilar, and M. T. W. Hearn,
.I. Chromatogr.
646, 129 (1993).
L)4 G. Jilge, R. Janzen, H. Giesche, K. K. Unger, J. N. Kinkcl, and M. T. W. Hearn, J.
Chromatogr.
397, 71 (1987).
[ 1 ] RP-HPLC OF PEP'rIDES AND PROTEINS 19
HPLC systems. RP-HPLC is usually carried out on n-alkyl-bonded silicas
or other reversed-phase sorbents with an acidic mobile phase and elution
of the peptides or proteins is achieved by the application of a gradient of
increasing organic solvent concentration. The most commonly used mobile-
phase additives are 10 mM trifluoroacetic acid (TFA), phosphoric acid,
perchloric acid, or heptafluorobutyric acid. is At low pH values, silica-based
sorbents are chemically stable and the surface silanols are fully protonated.
TFA is the most popular of the acidic additives owing to its volatility, while
significant changes in solute selectivity can be obtained with phosphoric
acid. Formic acid, hydrochloric acid, and acetic acid can also be utilized. ~''~5
Other mobile-phase additives such as nonionic detergents can be used in
the isolation of more hydrophobic proteins such as membrane proteins¢ )~
The three most common organic solvent modifiers are acetonitrile,
methanol, or 2-propanol, which all exhibit high optical transparency in the
detection wavelengths used in the RP-HPLC of peptides and proteins.
While acetonitrile provides lower viscosity solvent mixtures, 2-propanol is
a stronger eluent. An example of the influence of organic solvent on the
separation of peptides is shown in Fig. 5. Changes in selectivity are clearly
evident for peaks 9-12, 13-15, 17, and 18. The nature of the organic solvent
can also influence the conformation of protein samples ~)7 and therefore may
have a significant impact on the level of recovery of biologically active
sample.
Operating Parameters
Several operating parameters will also influence the resolution of pep-
tides and proteins in RP-HPLC. These parameters include the gradient
time, the gradient shape, the mobile-phase flow rate, and the operating
temperature. Typically, linear gradients with conventional analytical col-
umns are applied from 5% organic solvent up to between 50 and 100%
solvent over the time range of 20-120 rain while flow rates between 0.5
and 2 ml/min are commonly used. With microbore columns, flow rates in
the range 50-250 /xl/min can be employed. The choice of the gradient
conditions will depend on the selectivity between the solutes of interest.
The influence of gradient time on the separation of growth hormone tryptic
peptides is shown in Fig. 6. While longer retention times are .generally
observed with longer gradient times, improved resolution can also be ob-
tained, as is evident for peaks T3 and
TI3
and also T5 and T~s. Variation
,J5 G. Thdvenon and F. E. Regnier,
J. Chromatogr.
4"/6, 499 (1989).
'J¢' G. W. Welling, R. Van der Zee, and S. Welling-Wester, J.
CJlromatogr.
418, 223 (1987).
,~7 p. Oroszlan, S. Wicar, G. Tashima, S L. Wu, W. S. Hancock, and B. L. Karger,
Anal.
Chem.
64, 1623 (1993).
20
LIQUID CHROMATOGRAPHY [1]
E
(
("4
~D
0
c-
O
/3
0
<
>
11
18
4 16
S
S~~j 17
12 15
10 20 21
9 13
3 14
22
23
PrOH
1 20
22
AcCN
22
11
18
16 17 1
~~~1 4 5 7 8 12 14 19 20 21
| | | |
MeOH
23
Time (minutes)
FI(3. 5. Effect of organic modifier on the reversed-phase separation of tryptic peptides
derived from porcine growth hormone. Column, Bakerbond RP-C4, 25 cm × 4.6 mm i.d.,
5-/xm particle size, 30-nm pore size; conditions, linear gradient from 0 to 90% 2-propanol
(top), acetonitrile (middle), or methanol (bottom) with 0.1% TFA over 60 mira flow rate
of 1 ml/min, 37 °. (From A. J. Round, M. I. Aguilar, and M. T. W. Hearn, unpublished
results, 1995.)
[ 1 ] RP-HPLC OF PEPT1DES AND PROTEINS 21
Ts+T18
10tJ
r~
0
g
f" 1~
S
_Q
o
>
D
t0
T5
~o ~ ~ ~o ;o
T
8
30 minute gradlent
60 minute gradient
120 minute gradient
Time (minutes)
Fu;. 6. Effect of gradient time on the separation of tryptic peptides of porcine growth
hormone in RP-HPLC. Column, Bakerbond
RP-C4,
25 cm X 4.6 mm i.d., 5-/xm particle size,
30-nm pore size: conditions, linear gradient from 0 to 90% acetonitrile over 30 min (top), 60
rain (middle), and 120 min (bottom). (From A. J. Round, M. 1. Aguilar, and M. T. W. Hearn,
unpublished results, 1995.)