in situ detection of dna damage, methods and protocols
Bạn đang xem bản rút gọn của tài liệu. Xem và tải ngay bản đầy đủ của tài liệu tại đây (3.94 MB, 279 trang )
Methods in Molecular Biology
TM
HUMANA PRESS
HUMANA PRESS
Methods in Molecular Biology
TM
Edited by
Vladimir V. Didenko
In Situ
Detection
of DNA Damage
Methods and Protocols
VOLUME 203
Edited by
Vladimir V. Didenko
In Situ
Detection
of DNA Damage
Methods and Protocols
Labeling DNA Damage with Terminal Transferase 1
I
L
ABELING
DNA B
REAKS
U
SING
T
ERMINAL
T
RANSFERASE
(TUNEL A
SSAY
)
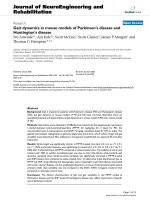
2Walker et al.
Labeling DNA Damage with Terminal Transferase 3
1
3
From:
Methods in Molecular Biology, vol. 203:
In Situ
Detection of DNA Damage: Methods and Protocols
Edited by: V. V. Didenko © Humana Press Inc., Totowa, NJ
Labeling DNA Damage with Terminal Transferase
Applicability, Specificity, and Limitations
P. Roy Walker, Christine Carson, Julie Leblanc,
and Marianna Sikorska
1. Introduction
Apoptotic and programmed cell death are characterized by, and indeed were
first discovered from observations of, remarkable morphological changes that
occur in the nucleus (see 1 for a comprehensive review of apoptosis and pro-
grammed cell death). Thus, light and electron microscopy were the first tools
for the detection of apoptosis. This characteristic collapse of chromatin and
ultimately the structural organization of the nucleus is triggered by the degra-
dation of DNA, which is an active process and occurs prior to death of the cell.
The degradation of DNA was subsequently found to be mediated by endo-
nucleolytic activity that generated a specific pattern of fragments (2). The frag-
ment sizes were multiples of approx 200 bp, the amount of DNA wound around
a single nucleosome, and the pattern became known as the DNA ladder (Fig. 1A).
Later it became apparent that DNA fragmentation is quite variable within cells
and some cell types produce only high molecular weight (HMW) fragments
(Fig. 1B, 3). The latter observations formed the basis of a convenient in vitro
biochemical technique for the routine detection of apoptosis by resolving the
fragmented DNA by conventional or pulsed field agarose gel electrophoresis.
However, this technique requires relatively large amounts of material and DNA
extraction. Subsequently, a variety of techniques have emerged to detect
apoptotic DNA fragmentation in situ by exploiting the fact that the hydroxyl
group at the 5' or 3' ends of the small DNA fragments becomes exposed. Nucle-
otide analogues can be attached to the ends by several enzymes, with
Terminal
deoxynucleotide Transferase (TdT) being the most popular (4,5). The assays
4Walker et al.
are typically fluorescence-based, either by the direct incorporation of a nucle-
otide to which a fluorochrome has been conjugated, or indirectly using fluores-
cent dye conjugated antibodies that recognize biotin- or digoxigenin-tagged
nucleotides. Radioactively labeled nucleotides can also be used. Since several
million fragments are generated during complete DNA fragmentation and low
levels of fluorescence can be readily detected by photo-multipliers and CCD
arrays, the assays are extremely sensitive. The assays have been formatted for
light and confocal microscopy as well as flow cytometry, thereby greatly facili-
tating the detection and quantitation of apoptosis in situ. In addition, end-
labeling techniques are employed in studies of the actual mechanism of DNA
fragmentation, as well as the detection and characterization of endonucleases.
Fig. 1. Patterns of DNA fragmentation in apoptosis. (A) DNA extracted from con-
trol (lane 1) and glucocorticoid-treated (lane 2) thymocytes showing the DNA ladder
of mono- and oligo-nucleosomes. (B) DNA extracted from untreated (lane 1), vehicle-
treated (lane 2) and VM26-treated (lane 3) HL60 cells and resolved by pulsed field gel
electrophoresis (see 9). Lane m is the lambda DNA ladder marker (multiples of
48.5Kb). In these cells, only high molecular weight (HMW) degradation occurs.
Labeling DNA Damage with Terminal Transferase 5
1.1. The Nature of the DNA Fragments
Endonucleases cleave DNA by attacking the phosphodiester bonds of the
sugar-phosphate backbone of each strand (Fig. 2A). The phosphodiester bond
can be cleaved in two ways such that the phosphate is left on either the 3' end of
the DNA strand or the 5' end, the opposite end being a hydroxyl group in each
case. In addition, the distance between the point at which the bond is broken on
opposite strands of the DNA duplex also varies. If the breaks are exactly oppo-
site, the fragment is considered blunt-ended. If they are offset, they generate
either 3' or 5' overhangs (Fig. 2B). Thus, DNA can be cleaved by a variety of
nucleases, operating by different mechanisms, and each type of nuclease gen-
erates a characteristic “signature” in terms of nature of the ends it creates.
The DNA fragments that are produced during apoptosis are usually, but not
always, created by an endonuclease that cleaves the DNA strand at the
Fig. 2. Mechanisms of endonucleolytic attack on DNA. In A the arrows indicate the
site of attack by an endonuclease cleaving the phosphodiester bond at the same point
on each strand of the DNA duplex to generate multiple smaller fragments each with 3'-
OH and 5'-P ends. In B the endonuclease cleavage of each strand of the DNA duplex is
offset generating fragments with a 3' recess.
6Walker et al.
phosphodiester bond such that the 5' end of the DNA retains the phosphate
group and the 3' end is an hydroxyl group (Fig. 2A). Generally there is little or
no overhang (6,7). The terminal transferase assays take advantage of this
observation, and add nucleotide analogs to the 3'-hydroxyl of the DNA frag-
ment. However, numerous exceptions to this observation have been docu-
mented. In some cells, the DNA is believed to be cleaved by DNAse II, an
enzyme that produces 5'-OH (8). Such ends would not be labeled with terminal
transferase. In addition, the cleavage of each strand is sometimes offset, leav-
ing a variety of sizes of overhang (9). The reasons for this are not clear, but
probably relate to the fact that different endonucleases cleave the DNA in dif-
ferent cell types or under different physiological conditions. Terminal trans-
ferase can still add nucleotides to the 3'-OH of many of these fragments and a
variety of other enzymes can also be used to add fluorescent or radioactive
nucelotides to those DNA strands, as discussed below.
In some cells undergoing apoptosis, the DNA is not cleaved into small frag-
ments at all. Instead, larger fragments of about 50 Kb are produced (Fig. 1B) (3).
These fragments appear to have 3'-OH groups, but since the number of fragments
per cell is orders of magnitude lower, their detection becomes more difficult.
1.2. Terminal Deoxynucleotidyl Transferase
DNA nucleotidylexotransferase. (E.C. 2.7.7.31, common name: Terminal
deoxynucleotidyl Transferase, TdT) is a DNA polymerase that catalyzes the
addition of deoxyribonucleotides to the 3'-OH end of DNA strands without the
need for a template or a primer. This is in contrast to most enzymes that incor-
porate nucleotides into duplex DNA, since they require a string of nucleotides
on the opposite strand to create a template so that the enzyme recognizes which
nucleotides to select. A reaction mixture containing all four nucleotides is
required by these enzymes. DNA polymerases and the smaller Klenow frag-
ment are typical examples and these enzymes are ideally suited to incorporate
nucleotides into DNA fragments that possess overhangs. On the other hand,
TdT requires only 1 nucleotide type (typically, deoxyuridine triphosphate,
dUTP) in end-labeling assays and will continue to add it to generate a homo-
polymer. TdT also has other advantages such as the ability to add nucleotides
to very small fragments of DNA making it ideal for labeling fragments in
apoptotic cells. The enzyme will also label single stranded DNA molecules
containing a 3'-OH and will attach nucleotides to a single-strand nick in DNA.
This is particularly useful since many single-strand breaks are also introduced
into DNA during fragmentation in apoptotic cells (10).
1.3. Nucleotides Used in Labeling Assays
Initially, radioactively-labeled nucleotides were used in DNA-labeling
experiments, but more recently, fluorescent nucleotide analogs have been
Labeling DNA Damage with Terminal Transferase 7
developed. The fluorochrome, usually fluorescein isothiocyanate (FITC), can
be directly conjugated to the nucleotide and its green fluorescence readily
detected using standard filter sets (Fig. 3). The nucleotide of choice is
deoxyuridine triphosphate (dUTP) and conjugation is usually to the C-5 posi-
tion of uridine which does not participate in hydrogen bonding. A spacer is
used to decrease steric hindrance, with the length of the spacer dependent upon
manufacturer and the nature of the molecule being conjugated. In other for-
mats, the nucleotide is conjugated with biotin or digoxigenin derivatives and
these molecules are detected with fluorescently-tagged proteins. This is fluo-
Fig. 3. Nucleotide analogs used in end-labeling assays. The three compounds com-
monly conjugated to dUTP are Fluoroscein, biotin and digoxigenin. The compounds are
linked via a spacer to the C-5 of the nucleotide. Radioactively labeled dUTP is com-
monly on the alpha-Phosphate which becomes incorporated into the sugar phosphate
backbone of DNA. Also shown is the substitution that terminates polymerization by
removing the hydroxyl that interacts with the phosphate of the next nucleotide.
8Walker et al.
rochrome-conjugated streptavidin for biotin detection and anti-digoxigenin
antibodies for digoxigenin detection. Because more than one molecule of FITC
can be conjugated to the protein, the fluorescence signal is amplified. Thus, the
indirect assays are more sensitive than direct FITC conjugation to the nucle-
otide (11). Moreover, since digoxigenin is found only in plants, its antibody
does not recognize any mammalian proteins, thereby reducing the background
that is usually caused by non-specific binding. Other non-fluorescent detection
systems have been used, particularly for tissue sections and blots, including alka-
line phosphate-colorimetry, peroxidase, chemi-luminescence and colloidal gold.
Under optimal conditions, the sensitivity of fluorescence detection approaches
that of radioactivity and the small number of fragments that occur during high
molecular weight DNA fragmentation are readily detectable (12). In addition, fluo-
rescence affords the opportunity for multicolor counterstaining and labeling proto-
cols, which are particularly useful for flow cytometry and confocal microscopy.
1.4. Assays Based on Terminal Transferase
The first end-labeling protocol developed for the detection of DNA frag-
mentation in apoptosis was the Terminal Uridine Nucleotide End Labeling
(TUNEL) technique of Gavrielli et al (4). This method exploited the ability of
the enzyme, terminal transferase, to add biotin-conjugated nucleotides onto the
3' OH of a DNA strand. By using either a fluorescently tagged or radioactively
labeled nucleotide analog, the DNA fragments become detectable. Formula-
tion of the reaction buffer with cobalt ensures that the enzyme can add multiple
bases to the 3'-end of each strand. As mentioned above, all types of 3'-end can
be labeled, including those of single and double stranded DNA as well as
recessed, protruding and blunt ends. The enzyme appears to have a preference
for single stranded and 3'-protruding ends. The method can be used on cell
suspensions and monolayers as well as frozen or paraffin tissue sections.
If only one nucleotide is to be incorporated onto each end of the double-
stranded DNA fragment in order, for example, to accurately quantitate the num-
ber of fragments, then dideoxynucleotides can be used to create strand
termination (Fig. 3). Usually, however, the objective is to increase sensitivity
by incorporating multiple nucleotides and under optimal conditions as many as
50–100 monomers may be incorporated (13). Unmodified nucleotides are
included in the reaction mixture to “space out” the modified nucelotides in
order to increase the ability of the binding protein to recognize its target. Typi-
cally, the methods use either digoxigenin-conjugated dUTP detected by stain-
ing with a FITC-conjugated anti-digoxigenin antibody or biotin-conjugated
dUTP detected by staining with FITC-conjugated streptavidin.
Labeling DNA Damage with Terminal Transferase 9
If radioactivity is needed, the alpha-phosphate of dUTP is substituted with
32
P, since this is the phosphate that becomes incorporated into the sugar phos-
phate backbone of the DNA (Fig. 3).
1.5. Other Enzymes That Can Label DNA
Since some endonucleases also leave an overhang (i.e. a run of nucleotides
on one strand only, Fig. 2B) the other strand can be extended or “filled in” by
the Klenow fragment of DNA polymerase. The Klenow fragment of DNA poly-
merase I is used since it retains the ability to create a polymer, but does not
possess the 5'–3' exonuclease activity which would degrade the fragment. In
other situations, it is necessary to examine the 5' end of the DNA fragments. To
confirm that the 5' end is indeed phosphorylated, the fragments can be incu-
bated in the presence of the enzyme T4 kinase and
32
P-labeled inorganic phos-
phate. T4 kinase phosphorylates any 5'-OH. Thus, if the phosphate group is
already present no radioactivity can be incorporated. However, if the phos-
phate is absent, or has been removed by incubation with alkaline phosphatase,
the radioactively-labeled phosphate becomes attached to the fragment and this
can be detected by autoradiography. Since T4 kinase can add only one phos-
phate, whereas terminal transferase or the Klenow fragment can add multiple
nucleotides, the 5' labeling technique is much less sensitive than the 3' labeling
techniques and is not generally used in routine assays. However, it is very
useful for determining the nature of the ends of DNA from apoptotic cells.
1.6. Limitations
DNA fragments with 3'-OH ends can be produced in a number of situations
where apoptosis is not occurring. For example, some forms of DNA damage pro-
duce DNA breaks or nicks with 3'-OHs. Moreover, the DNA degradation that
occurs during necrosis also produces fragments with 3'-OH that would be labeled
by TUNEL or ISEL (In situ End Labeling, 14). Over-reliance on these techniques
has led to considerable controversy in studies in brain where, following some
insults, both apoptosis and necrosis occur simultaneously making it very difficult
to establish and quantitate true apoptotic cell death (15–17).
It is evident, therefore, that TdT-based labeling techniques should not be
used as the sole criterion for establishing the nature of the cell death mecha-
nism. In order to establish that apoptosis is occurring, other criteria must also
be used. Since it is possible to use multiple fluorochromes in the same experi-
ments, another marker such as the appearance of annexin on the cell surface,
can be used simultaneously. Once it has been established that the cell death is
indeed apoptotic, then the TdT-based assays can be used for routine quantita-
tion by microscopy or flow cytometry (3,18).
10 Walker et al.
1.7. Terminal Transferase Labeling Examples
In the following sections are general protocols used in our laboratory for
the detection of DNA fragmentation in situ using TdT. More detailed and
application-specific protocols are given in the subsequent chapters of this sec-
tion. Fig. 4 shows apoptotic thymocytes prepared for electron, light and confo-
cal microscopy as well as flow cytometry using the protocols described below.
The electron micrograph shows a cell exhibiting classical apoptotic morphol-
ogy alongside a normal thymocyte. The condensed apoptotic cells can easily
be seen by light and fluorescence microscopy, particularly when the condensed
chromatin is stained with Hoechst dye. The TUNEL assay labels all of the
nuclei that are condensed and also shows two cells with TUNEL-positive
fragmented DNA that have not yet undergone nuclear condensation (arrows).
The extent of DNA fragmentation is demonstrated dramatically in the confocal
image. In this example, the streptavidin is conjugated with Cy3 which fluo-
resces red and the anti-lamin B antibody is conjugated with FITC. The TUNEL
positive (+) cells can be easily quantitated and sorted from the still normal (–)
G
1
and G
2
populations by flow cytometry.
2. Materials
2.1. TUNEL Labeling of Cells for Light or Confocal Microscopy
1. 10× PBS: 1.31 M NaCl, 50 mM Na
2
HPO
4
, 16 mM KH
2
PO
4
. Composition per
liter: 76.5 g NaCl, 7.25 g Na
2
HPO
4
, 2.12 g KH
2
PO
4
. Adjust pH to 7.0 after dilu-
tion, as pH changes over storage time. Store at room temperature.
2. Poly-L-lysine: 0.1% (w/v) in distilled H
2
O.
3. Paraformaldehyde: 3% (w/v) in PBS. For 100 mL, heat 90 mL of distilled H
2
O
until boiling, add 3 g EM grade paraformaldehyde, 100 µL 1 M NaOH and stir to
dissolve. Cool to room temperature, and add 10 mL of 10× PBS. Adjust pH to
7.0. Make fresh just before use, do not store.
4. 0.2% Triton-X-100 (v/v) in PBS. Composition per 100 mL: 2 mL 10% Triton-X-
100 solution (Pierce, Rockford, IL), 10 mL 10× PBS, 88 mL distilled H
2
O. Adjust
pH to 7.0. Make fresh just before use.
5. TDT buffer: 30 mM Trizma base, 140 mM sodium cacodylate, 1 mM cobalt chlo-
ride. Available commercially from Gibco Life Technologies (Rockville, MD)
with purchase of TDT enzyme.
6. Reaction buffer: 10 µM biotin-16-dUTP (Roche Molecular Biochemicals, India-
napolis, IN), 0.3 U/µL TDT enzyme (Gibco Life Technologies, Rockville, MD)
in TDT buffer. Make fresh just before use.
7. TB buffer: 300 mM NaCl, 30 mM sodium citrate. Composition per 100 mL of 2×
stock: 3.5 g NaCl, 1.76 g sodium citrate. Store at room temperature.
2.2. TUNEL Labeling of Tissue Sections for Microscopy
1. Paraformaldehyde: 4% (w/v) in PBS. For 100 mL, heat 90 mL of distilled H
2
O
until boiling, add 4 g EM grade paraformaldehyde, 100 µL 1 M NaOH and stir to
Labeling DNA Damage with Terminal Transferase 11
Fig. 4. Examples of the versatility of terminal transferase-based assays. Thymocytes
were treated with dexamethasone for 2 h and then prepared for electron, light or fluo-
rescence microscopy or TUNEL-labeled and examined by fluorescence or confocal
microscopy and flow cytometry.
12 Walker et al.
dissolve. Cool to room temperature, and add 10 mL of 10× PBS. Adjust pH to
7.0. Make fresh just before use, do not store.
2. Proteinase K buffer: 20 µg/mL Proteinase K (Invitrogen, Bethesda, MD) in 100
mM Tris-HCl, pH 8.0 plus 50 mM EDTA.
2.3. TUNEL Labeling of Cells for Flow Cytometry
1. 10× PBS: 1.31 M NaCl, 50 mM Na
2
HPO
4
, 16 mM KH
2
PO
4
. Composition per
liter: 76.5 g NaCl, 7.25 g Na
2
HPO
4
, 2.12 g KH
2
PO
4
. Adjust pH to 7.0 after dilu-
tion, as pH changes over storage time. Store at room temperature.
2. Paraformaldehyde: 1% (w/v) in PBS. For 100 mL, heat 90 mL of distilled H
2
O
until boiling, add 1 g EM grade paraformaldehyde, 100 µL 1 M NaOH and stir to
dissolve. Cool to room temperature, and add 10 mL of 10× PBS. Adjust pH to
7.0. Make fresh just before use, do not store.
3. Reaction buffer: 10 µM biotin-16-dUTP (Roche Molecular Biochemicals, India-
napolis, IN.), 0.3 U/µL TDT enzyme (Gibco life Technologies, Rockville, MD),
0.2 M sodium cacodylate pH=6.6 (from 10× stock), 25 mM Tris-HCl pH=6.6
(from 10× stock), 2.5 mM CoCl
2
(from 10× stock), 0.25 mg/mL BSA. Make fresh
just before use. All stocks stored at 4°C.
4. 2× TB buffer: 600 mM NaCl, 60 mM sodium citrate. Composition per 100 mL:
3.5 g NaCl, 1.76 g sodium citrate. Store at room temperature.
5. Staining buffer: 5% (w/v) dry milk powder, 0.1% (v/v) Triton-X-100 in 2× TB
buffer. Composition per 5 mL: 50 µL 10% Triton-X-100 solution (Pierce, Rock-
ford, IL), 0.25 g milk, 5 mL 2× TB buffer.
2.4. Determining the Nature of the Ends of the Fragments
1. Nuclear buffer (NB): 15 mM Tris-HCl, pH 7.4, 60 mM KCl, 15 mM NaCl, 1 mM
EGTA, 2 mM EDTA, 0.5 mM Spermidine and 0.15 mM spermine. Composition
per liter: 1.82 g Tris-HCl, 0.38 g EGTA, 0.74 g EDTA, 0.13 g spermidine
(trihydrochloride, Sigma, St. Louis, MO), 0.05 g spermine (tetrahydrochloride,
Sigma), 4.5 g KCl, 0.9 g NaCl. Adjust pH to 7.4 and store at 4°C.
2. TdT reaction buffer: 25 mM Tris-HCl buffer, pH 6.6, 200 mM potassium cacody-
late, 5 mM CoCl
2
, 0.5 mM DTT, 0.25 mg/mL BSA. Composition of a 2× stock
per 10 mL: 0.06 g Tris-HCl, 0.67 g potassium cacodylate, 0.024 g CoCl
2
, 1.54 mg
DTT, 5 mg BSA. Adjust pH to 6.6 and store at 4°C.
3. T4 kinase reaction buffer: 50 mM glycine-NaOH buffer, pH 9.2, 5 mM DTT, 10 mM
MgCl
2
. Composition of a 10× stock per 100 mL: 3.75 g Glycine-NaOH, 0.77 g
DTT, 2.03 g MgCl
2
. Adjust pH to 9.2.
4. Lysis buffer: 5 mM Tris-HCl, pH 7.5, 5 mM EDTA and 0.5% (w/v) Triton X100.
Composition per 100 mL: 0.061 g Tris-HCl, 0.19 g EDTA, 0.5 g Triton X 100.
Adjust pH to 7.5 and store at 4°C.
5. TE buffer: 10 mM Tris-HCl + 1 mM EDTA, pH 7.5. Composition per liter: 1.26 g
Tris + 0.37 g EDTA. Adjust pH to 7.5 with HCl and store at room temperature.
6. RNase solution: 2 mg/mL RNase A (Sigma, St. Louis, Missouri) Dissolved in
10 mM Tris-HCl + 15 mM NaCl at pH 7.5. Composition per 5 mL: 6.1 mg Tris,
Labeling DNA Damage with Terminal Transferase 13
4.5 mg NaCl, 10 mg RNase A . Adjust pH to 7.5, boil for 15 min and aliqout 0.5 mL
into microfuge tubes and store at –20°C.
7. Proteinase K buffer: 10 mM Tris-HCl, pH 7.8, 5 mM EDTA and 0.5% (w/v)
N-Lauroylsarcosine. Composition of a 10× stock per 100 mL: 1.21 g Tris-HCl, 1.86
g EDTA, 5 g N-lauroylsarcosine. Adjust pH to 7.8 and store at room temperature.
3. Methods
3.1. TUNEL Labeling of Cells for Light or Confocal Microscopy
3.1.1. Coating of Coverslips or Slides for Attachment of Suspension
Cells or Tissue Sections
In order to stain suspension cells or tissue sections, they must be attached to
coverslips or slides, respectively with a suitable bonding agent that maintains
them in place and can withstand the multiple wash steps of the staining proce-
dure, but does not interfere chemically with the staining or contribute to back-
ground fluorescence. We use poly-
L-lysine although commercial bonding
agents are also available.
1. Place coverslips or slides in a humid chamber, but do not add water to the cham-
ber at this point (see Note 1). Coat with 0.1% poly-L-lysine solution and allow to
sit 10 min at room temperature.
2. Drain coverslips and rinse by dipping briefly in a beaker of distilled water. Drain and
return to humid chamber. Drain slides, but do not rinse. Air dry with the lid ajar (to
promote air circulation, while preventing dust contamination)—typically 10–20 min.
3. Add water to the humid chamber. Allow suspension cells (typically at concentra-
tions of 0.2–1 × 10
6
cells/mL) or tissue sections 10 min to adhere.
3.1.2. TUNEL Labeling of Cells for Light Microscopy
All steps carried out at room temperature unless noted otherwise.
1. Grow cells on glass coverslips, or attach suspension cells to coverslips with poly-
L-lysine or a suitable bonding agent. Rinse coverslips by immersing for 30 sec in
PBS (see Note 2).
2. Fix for 5 min in 3% paraformaldehyde in PBS. Rinse twice for 30 sec each time
in PBS.
3. Permeabilize for 20 min in 0.2% Triton X-100 in PBS. Rinse 3× for 4 min each
time in PBS.
4. Incubate with reaction buffer or control buffer (no enzyme) for 1 h at 37°C in a
humid chamber (see Notes 3 and 4).
5. Stop reaction by transferring to TB buffer for 15 min. Rinse 3× for 4 min each
time in PBS.
6. Block for 10 min in PBS + 2% BSA. Rinse 3× for 4 min each time in PBS.
7. Incubate with fluorochrome-linked streptavidin (Jackson Laboratories, 1:200 in
PBS) for 30 min in a humid chamber (see Note 5). Rinse 3× for 4 min each time
in PBS.
14 Walker et al.
8. Counterstain for 1 min with 1 µg/mL of Hoechst 33258 in PBS (see Notes 6 and
7). Mount onto slides, using 16–20 µL of mounting medium per 22 mm x 22 mm
coverslip.
9. Examine the cells on a microscope equipped with epifluorescence optics, visual-
izing the nuclear morphology seen with the Hoechst signal using a UV filter set
and the TUNEL label with the appropriate filter set for your fluorochrome (i.e.,
green for FITC, or red for CY3).
3.1.3. TUNEL Labeling of Tissue Sections for Microscopy
1. Adhere sections to poly-L-lysine coated slides.
2. Fixed samples embedded in paraffin must be deparaffinized and hydrated prior
to staining. Samples can be gently heated to remove paraffin; either 10 min at
70°C or 30 min at 60°C should be appropriate. Sections are then hydrated by
passing though a series of washes in fresh reagents: twice for 5 min each time in
xylene, then twice for 3 min each time in 100% ethanol, then once for 3 min each
in 90% ethanol, 80% ethanol 70% ethanol and 50% ethanol (see Note 8). Slides
are then rinsed 3× for 5 min each time in PBS.
3. Fresh frozen tissue sections only should be fixed for 15 min in 4% paraformal-
dehye then rinsed 3× for 4 min each time in PBS.
4. Drain slides carefully. Permeabilize sections for 15 min in proteinase K buffer in
a humid chamber (see Notes 9 and 10). Rinse three times for 4 min each time in
PBS.
5. Incubate sections for 5 min in 3% H
2
O
2
to inactivate endogenous peroxidase.
Rinse three times for 4 min each time in PBS.
6. Equilibrate sections for 10 min in TdT buffer in a humid chamber. Drain slides
carefully.
7. Proceed with staining as for cultured cells, as described in 3.1.2 steps 4–6, using
75 µL of reaction buffer per section.
8. Drain slides carefully. Incubate with ExtrAvidin-Peroxidase (Sigma, 1:20 in PBS)
for 30 min in a humid chamber. Rinse 3× for 4 min each time in PBS.
9. Drain slides carefully. Stain with AEC (3-amino-9-ethyl-carbazole, Sigma) or
alternate colorimetric substrate for 30 min in a humid chamber. Rinse 3× for 4
min each time in PBS. Drain slides carefully.
10. Mount coverslips onto slides if desired and examine using brightfield optics.
3.2. TUNEL Labeling of Cells for Flow Cytometry
3.2.1 Fixation of Cells
1. Spin down approximately 2 × 10
6
cells for 4 min at 220 g and carefully aspirate
medium.
2. Resuspend while vortexing in 1 mL of ice-cold 1% paraformaldehyde in PBS.
All vortexing is done at approximately 2/3 maximum on a variable speed vortex.
Fix for 15 min on ice. Transfer to Eppendorf tubes during this step.
Labeling DNA Damage with Terminal Transferase 15
3. Spin down cells for 1 min at 1500 g at 4°C. Carefully aspirate formaldehyde (see
Note 11).
4. Resuspend while vortexing in 200 µL of ice-cold PBS. Add, while vortexing, 1 mL
of –20° C 70% ethanol. Samples may be stored in the freezer at this point for
several days.
3.2.2. TUNEL Labeling of Cells for Flow Cytometry
All steps carried out at room temperature unless noted otherwise.
1. Spin down fixed cells and aspirate fixative. All spins are done at 1500 g for 1 min.
Rehydrate for 15 min at room temperature in PBS + 1% BSA (see Notes 12 and
13). Spin down cells and aspirate wash.
2. Incubate while rocking for 30 min at 37°C in 100 µL reaction buffer or control
buffer (no enzyme). Stop the reaction by diluting the sample with 1 mL of 2× TB
buffer (see Note 14). Spin down cells and aspirate buffer.
3. Incubate while rocking for 1 h at room temperature in the dark in 100 µL of
staining buffer containing 10 µg/mL of FITC-conjugated streptavidin. Wash by
diluting the sample with 1 mL of 2× TB buffer + 0.1% TX-100. Spin down cells
and aspirate buffer.
4. Incubate while rocking for 20 min at room temperature in the dark in 1 mL of
PBS + 1% BSA, plus 100 µL of 0.1 mg/mL DNase-free RNase in PBS, plus 20 µL
of 0.1 mg/mL propidium iodide in PBS. Spin down cells and aspirate buffer.
5. Resuspend in 0.5–1 mL of PBS.
6. Examine the cells on a flow cytometer using an excitation wavelength of 488 nm,
and detecting the green TUNEL signal, indicative of the extent of DNA breaks,
using a 525 bp filter and the red propidium iodide signal, indicative of total DNA
content (cell cycle), using a 610 bp filter. The data is best analyzed on a two-
parameter histogram displaying propidium iodide signal (DNA content) on the X
axis and TUNEL labeling (DNA breaks) on the Y axis.
3.3. Determining the Nature of the Ends of the Fragments
3.3.1. Processing of Cells and Extraction of DNA
1. Each flask should contain a minimum of 10
7
cells. Remove the medium from
each flask and set aside. Add 2 mL of trypsin/ T75 flask (0.15% trypsin in PBS
containing 1 mM EDTA, pre-warmed to 37°C). After 1–2 min, add the medium
back to each flask, remove the total suspension into a conical centrifuge tube and
centrifuge at 200 g for 5' in a tabletop centrifuge.
2. Resuspend the pellet in 1 mL of nuclear buffer at room temperature (see Note 15).
Centrifuge the suspension at 200 g for 5' as above.
3. Resuspend the pellet in 400 µL of lysis buffer in a microfuge tube and place on
ice for 15 min.
4. Centrifuge the lysate at maximum speed in a refrigerated microfuge for 15' (see
Note 16).
16 Walker et al.
5. Discard the pellet and and add 40 µL of 2.5 M sodium acetate and 800 µL of
absolute ethanol. Precipitate at –20°C for at least 12–16 h (see Note 17).
6. Centrifuge the lysate at maximum speed in a refrigerated microfuge for 15' and
resuspend in 400 µL of 70% (v/v) ethanol. Centrifuge again and dissolve the
pellet in 400 µL of TE buffer on ice. Add 50 µL of RNase solution and incubate at
65°C for 1 h.
7. Add 25 µL of Proteinase K (Gibco Life Technologies, Rockville, Maryland, 20 mg/mL
stock in dH
2
O) and 40 µL of 10× Proteinase K buffer to the same reaction tube.
Incubate at 37°C for a further 2 h (see Note 18).
8. To the same tube, add 400 µL of phenol:chloroform-isoamyl alcohol 1:1 (v/v).
The chloroform:isoamyl alcohol is a 40:1 (v/v) mixture. Vortex vigorously, cen-
trifuge immediately at maximum speed in microfuge, and remove the upper layer
into a new microfuge tube.
9. Precipitate the DNA from this supernatant as in step 5. Resuspend the precipi-
tated DNA in 50 µL of TE buffer in a microfuge tube (see Note 19).
3.3.2. Labeling of 3'-OH Ends of DNA
1. Prepare a reaction tube by adding 25 µL of 2× TdT reaction buffer, 5 µL of sample
from step 9 of Subheading 3.3.1., 4 µL (60 Units) of TdT (Gibco Life Technolo-
gies, Rockville, Maryland), 1 µL (5 µci) of alpha [
32
P]-ATP (NEN Life Science
Products, Boston, MA) and water to a final volume of 50 µL.
2. Incubate for 1 h at 37°C.
3. Unincorporated radionucleotides are removed by transferring the reaction mix-
ture to a G-50 Micro column (Amersham Pharmacia Biotech, Piscataway, NJ).
The column is centrifuged at 750 g for 2' and the material that passes through the
column is collected at the bottom of the tube.
4. Labeled DNA fragments are separated by agarose gel electrophoresis followed
by autoradiography.
3.3.3. Labeling of 5'-OH Ends of DNA
1. Prepare a reaction tube by adding 5 µL of 10× T4 kinase reaction buffer, 5 µL of
sample from step 9 of Subheading 3.3.1., 5 µL (50 Units) of T4 Kinase (New
England BioLabs, Beverly, MA), 1 µL (5µci) of gamma [
32
P]-ATP (NEN Life
Science Products, Boston, MA), 5 µL of phosphate (stock solution is 10 mM
Na
2
HPO
4
\10 mM NaH
2
PO
4
mixed at a ratio of 5:7.5 to give a pH of 9.2) and
water to final volume of 50 µL (see Note 20).
2. Incubate for 1 h at 37°C.
3. Unincorporated radionucleodides are removed using G-50 Micro columns as
described in step 3 of Subheading 3.3.2.
4. Labeled DNA fragments are separated by agarose gel electrophoresis followed
by autoradiography.
4. Notes
1. A humid chamber consists of a small box or large glass Petri dish with a lid into
which is placed a filter paper (which can be dampened to provide the source of
Labeling DNA Damage with Terminal Transferase 17
humidity) covered by a piece of Parafilm, onto which coverslips can be placed.
With the lid on, cells on the coverslips can be left to incubate in small volumes of
reagent without drying out.
2. Coverslips are typically placed cell side up in multiwell plates of appropriate
size (6-well plates for 22 mm x 22 mm coverslips, 12 well plates for 15 mm
round coverslips and 24 well plates for 12 mm round coverslips), and solutions
are added from squeeze bottles and removed using a gentle water vacuum, tak-
ing care not to disturb the cells. Some suspension cells do not adhere well
enough to withstand these manipulations. As a gentler alternative, solutions
can be dispensed and coverslips moved from well to well in the plates or from
weigh boat to weigh boat. 2–5 mL of solution per sample will be required for
staining.
3. For incubations with enzymes, antibodies or steptavidin, which typically use very
small volumes, coverslips are turned cell side down over a 25–50 µL drop of
solution in a humid chamber. To remove, PBS is added to the drop so that the
coverslip floats up and can be picked up without exerting undue shearing force
on the cells. Gentle addition of PBS to the parafilm at the edge of the coverslip
will result in the liquid being drawn under the glass by capillary action.
4. Gibco supplies a 5× TDT buffer with purchase of the enzyme which is conve-
nient to use and of good quality. Alternatively, TUNEL labeling kits are avail-
able. The quality of these kits is reported to be good, but their cost is several
times more than the purchase price of the separate components.
5. Prolonging the streptavidin incubation increases the background fluorescence
markedly. Typically, attached cells display a noticeable level of background
while suspension cells stain very cleanly.
6. DAPI may be used as an alternate counterstain. Incubate cells 3 min in 0.2 µg/mL
DAPI, and rinse once in PBS.
7. To label fixed samples using both TUNEL and immunofluorescence staining for
an antigen of interest, do the antibody incubations first, then block 20 min in
0.15% gelatin in PBS, rinse and proceed with the TUNEL labeling from step 4.
8. Slides are typically placed in Coplin jars into which solutions have already been
dispensed and moved from jar to jar.
9. Slides with tissue sections are incubated cell side up in a humid chamber, with
approximately 100 µL of solution covering each section.
10. The length of the incubation in proteinase K may need to be optimized to ensure
adequate permeabilization and permit positive signals to be readily detected,
while guarding against over-digestion, which loosens sections, leading to their
loss in subsequent wash steps.
11. There is a marked loss of cells during the staining procedure. Take extreme
care when aspirating solutions above the cell pellet, removing the bulk of the
liquid with a GENTLE water vacuum and then the last 100 µL or so with a
pipetman.
12. There is a tendency for some cell types to clump, especially when apoptotic. If
this is the case, vortexing at each resuspension step usually solves the problem.
18 Walker et al.
13. Cells in suspension are fragile, hence 1% BSA is added to the PBS throughout
the protocol to enhance cell recovery.
14. In order to maximize recovery of cells from suspension, salt concentrations in the
reaction and stop buffers used for flow cytometry are higher than those required
for microscopy. This means that commercial buffer cannot be used.
15. This buffer has a relatively low ionic strength to assist in disruption of the cell
and contains EDTA and EGTA to chelate divalent cations, as well as polyamines
to bind to chromatin and protect the DNA.
16. We keep a regular microfuge in a cold cabinet for routine spins at 4°C.
17. Sodium acetate\ethanol ensures precipitation of DNA. Dry ice can also be used to
lower the temperature and the tube can be left overnight at this stage for convenience.
18. RNase removes contaminating RNA and proteinase K removes residual protein
and the RNase.
19. DNA fragments can be radioactively labeled at either the 3'-OH or 5'-OH end
using terminal deoxynucleotidyl transferase (TdT) or T4 polynucleotide kinase,
respectively. Since the presence of a phosphate group blocks both of these reac-
tions, this approach can be used to determine the nature of the ends of the DNA
fragments in apoptotic DNA, e.g. 5'P/3'-OH or 5'-OH/3'-P. This has important
implications for the mechanism of action of nucleases involved in DNA frag-
mentation in apoptosis. To assess this, divide the reaction mixture in two tubes,
one for TDT and other for the T4 kinase labeling reaction.
20. Phosphate, at 1 mM final concentration, is included in the reaction mixture to
fully activate the forward reaction (i.e. phosphorylation of the 5'-OH) and inhibit
the reverse reaction (i.e. an exchange reaction that would permit the incorpora-
tion of radioactive phosphate molecules onto 5-phosphorylated DNA).
References
1. Lockshin, R. A., Zakeri, Z. and Tilly, J. A. (1998) When Cells die: a comprehen-
sive evaluation of apoptosis and programmed cell death. Wiley-Liss, New York.
2. Wyllie, A. H. (1980) Glucocorticoid induced thymocyte apoptosis is associated
with endogenous endonuclease activation. Nature 284, 555–556.
3. Walker, P. R., Pandey, S. and Sikorska, M. (1995) Degradation of chromatin in
apoptotic cells Cell Death and Differentiation 2, 93–100.
4. Gavrieli, Y., Sherman, Y. and Ben-Sasson, S. A. (1992) Identification of Pro-
grammed Cell Death In Situ via Specific Labeling of Nuclear DNA Fragmenta-
tion. J. Cell Biol. 119, 493–501.
5. Mundle, S., Iftikhar, A., Shetty, V., Dameron, S., Wright-Quinones, V., Marcus,
B., Loew, J., Gregory, S., Raza, A. (1994) Novel in situ double labeling for simul-
taneous detection of proliferation and apoptosis. J. Histochem. Cytochem. 42,
1533–1537.
6. Alnemri, E. S. and Litwack, G. (1990) Activation of internucleosomal DNA cleav-
age in human CEM lymphocytes by glucocorticoids and novobiocin. J. Biol.
Chem. 265, 17323–17333.
Labeling DNA Damage with Terminal Transferase 19
7. MacManus, J. P., Fliss, H., Preston, E., Rashquinha, I. And Tour, U. (1999) Cere-
bral Ischemia produces laddered DNA fragments distinct from cardiac ischemia
and archetypal apoptosis. J. Cereb. Blood Flow Metab. 19, 502–510.
8. Barry, M. A. and Eastman, A. (1993) Identification of deoxyribonuclease II as an
endonuclease involved in apoptosis. Arch. Biochem. Biophys. 300, 440–450.
9. MacManus, J. P. and Rashqinha, I. (2001) Ischemic neuronal death is not by clas-
sic apoptosis: Are all DNA ladders the same? In “Apoptosis in Health and Dis-
ease”. Ruffolo, R. R. and Walsh, F., eds. Harwood Academic Publishers,
Amsterdam. pp. 33–46.
10. Walker, P. R. Leblance, J. and Sikorska, M (1997) Evidence that DNA fragmen-
tation in apoptosis is initiated and propagated by single-strand breaks. Cell Death
& Differentiation 4, 506–515.
11. Li, X., James, W. M., Traganos, F. and Darzynkiewicz, Z. (1995) Application of
biotin, digoxigenin or cluoroscein conjugated deoxyribonucleotides to label DNA
strand breaks for analysis of cell proliferation and apoptosis using flow cytometry.
Biotech & Histochem. 70, 234–242.
12. Chapman, R. S., Chresta, C. M., Herberg, A. A., Beere, H., Heer, S., Whetton, A.
D., Hickman, J. A. and Dive, C. (1995) Further characterisation of the in situ
terminal deoxynucleotidyl transferase (TdT) assay for the flow cytometric analy-
sis of apoptosis in drug resistant and drug sensitive leukemic cells. Cytometry 20,
245–256.
13. Paladichuk, A. (1999) Fishing In A Molecular Sea. The Scientist 13, 1–2 (http://
www.the-scientist.com/yr1999/jan/profile1_990118.html).
14. FujiKawa, D. G. (2000) Confusion between neuronal apoptosis and activation of
cell death mechanism in acute necrotic insults. Trends NeuroSci. 23, 410–411.
15. Roy, M. and Sapolsky, R. (1999) Neuronal apoptosis in acute necrotic insults:
why is this subject such a mess? Trends NeuroSci. 22, 419–422.
16. Gilmore, E. C., Nowakowski, R. S., Caviness, V. S. and Herrup, K. (2000) Cell
birth, cell death, cell diversity and DNA breaks: how do they all fit together?
Trends NeuroSci. 23, 100–105.
17. Chun, J. (2000) Cell death, DNA breaks and possible rearrangements: an alterna-
tive view. Trends NeuroSci. 23, 407–409.
18. Darzynkiewicz, Z. (1993) Detection of DNA strand breaks associated with
apoptosis in: Handbook of Flow Cytometry Methods ed: J. Paul Robinson, pub:
Wiley-Liss, Inc., New York, N. Y. 206–207.
TUNEL Assay: Overview of Techniques 21
2
21
From:
Methods in Molecular Biology, vol. 203:
In Situ
Detection of DNA Damage: Methods and Protocols
Edited by: V. V. Didenko © Humana Press Inc., Totowa, NJ
TUNEL Assay
An Overview of Techniques
Deryk T. Loo
1. Introduction
The study of DNA damage holds a wide interest within both basic and
applied fields of research. Elucidating the mechanisms involved in the genera-
tion of DNA damage, and the consequences of this damage, will have an enor-
mous impact on multiple fields of scientific research and will ultimately lead
to a better understanding of human disease. One of the most widely used meth-
ods for detecting DNA damage in situ is TdT-mediated dUTP-biotin nick end
labeling (TUNEL) staining (1). TUNEL staining was initially described as a
method for staining cells that have undergone programmed cell death, or
apoptosis, and exhibit the biochemical hallmark of apoptosis—internucleo-
somal DNA fragmentation (2–6). TUNEL staining relies on the ability of the
enzyme terminal deoxynucleotidyl transferase to incorporate labeled dUTP into
free 3'-hydroxyl termini generated by the fragmentation of genomic DNA into
low molecular weight double-stranded DNA and high molecular weight single
stranded DNA (1). While TUNEL staining has nearly universally been adopted
as the method of choice for detecting apoptosis in situ, it should be recognized
that TUNEL staining is not limited to the detection of apoptotic cells. TUNEL
staining may also be used to detect DNA damage associated with non-apoptotic
events such as necrotic cell death induced by exposure to toxic compounds and
other insults (7), and TUNEL staining has also been reported to stain cells
undergoing active DNA repair (8). Therefore TUNEL staining may be consid-
ered generally as a method for the detection of DNA damage (DNA fragmenta-
tion), and under the appropriate circumstances, more specifically as a method
for identifying apoptotic cells.
22 Loo
The goal of this chapter is to provide the reader with step-by-step protocols
for in situ TUNEL staining of nuclear DNA fragmentation in both cultured
cells and tissue sections. These basic TUNEL protocols have been used on a
wide variety of cell types and tissues with success. Methods for both colori-
metric and fluorescent staining of cultured cells and tissues is presented thereby
allowing investigators to utilize the TUNEL staining procedure with a minimal
investment in laboratory reagents and equipment. In addition, methods to
modify and optimize the basic protocols, as well as troubleshooting and con-
trol conditions, are provided in the Notes and Troubleshooting sections.
2. Materials
2.1. Cultured Cells
1. Phosphate-buffered saline (PBS), pH 7.4.
2. 2% buffered formaldehyde: dilute high quality formaldehyde (v/v) in PBS prior
to use.
3. 70% ethanol
4. TdT equilibration buffer: 2.5 mM Tris-HCl (pH 6.6), 0.2 M potassium cacody-
late, 2.5 mM CoCl
2
, 0.25 mg/mL bovine serum albumin (BSA). Aliquots may be
stored at –20°C for several months.
5. TdT reaction buffer: TdT equilibration buffer containing 0.5 U/µL of TdT enzyme
and 40 pmol/µL biotinylated-dUTP (Roche Diagnostics Corp.; Indianapolis, IN).
Prepare fresh from stock solutions prior to use.
6. TdT staining buffer: 4× saline-sodium citrate (0.6 M NaCl, 60 mM sodium cit-
rate), 2.5 µg/mL fluorescein isothiocyanate-conjugated avidin (Amersham
Pharmacia Biotech, Inc.; Piscataway, NJ), 0.1% Triton X-100, and 1% BSA. Pre-
pare fresh from stock solutions prior to use.
7. Hoechst 33342 counterstain: 2 µg/mL in PBS (Molecular Probes; Eugene, OR).
Stock solution may be stored at 4°C in the dark for several weeks.
8. Vectashield antifade mounting medium (Vector Laboratories, Burlingame, CA).
2.2. Tissue Sections
1. Phosphate-buffered saline (PBS), pH 7.4.
2. 4% buffered formaldehyde: dilute high quality formaldehyde (v/v) in PBS prior
to use.
3. 20 µg/mL proteinase K (Roche Diagnostics Corp.). Stock solution may be stored
at –20°C for several months.
4. 95, 90, 80, and 70% ethanol in Coplin jars
5. 2% hydrogen peroxide . Prepare fresh from hydrogen peroxide reagent stock prior
to use.
6. 2% BSA solution: 2% BSA (w/v) dissolved in PBS and passed through a 0.45 µm
filter. Sterile stock solution may be stored at 4°C for several weeks.
7. 2× SSC buffer: 300 mM NaCl, 30 mM sodium citrate. Stock solution may be
stored at room temperature for several months.
TUNEL Assay: Overview of Techniques 23
8. TdT Equilibration Buffer: 2.5 mM Tris-HCl (pH 6.6), 0.2 M potassium cacody-
late, 2.5 mM CoCl
2
, 0.25 mg/mL BSA. Prepare from stock solutions. Aliquots
may be stored at –20°C for several months.
9. TdT Reaction Buffer: TdT Equilibration Buffer containing 0.5 U/µL of TdT
enzyme and 40 pmol/µL biotinylated-dUTP (Roche Diagnostics Corp.). Prepare
fresh from stock solutions prior to use.
10. Vectastain ABC-peroxidase stock solution (Vector Laboratories, Burlingame, CA).
11. 3,3'-Diaminobenzidine (DAB) staining solution (Vector Laboratories).
12. TdT staining buffer: 4× saline-sodium citrate (0.6 M NaCl, 60 mM sodium cit-
rate), 2.5 µg/mL fluorescein isothiocyanate-conjugated avidin (Amersham
Pharmacia Biotech, Inc.), 0.1% Triton X-100, and 1% BSA. Prepare fresh from
stock solutions prior to use.
13. Hematoxylin counterstain (Sigma-Aldrich; St. Louis, MO).
14. Hoechst 33342 counterstain: 2 µg/mL in PBS (Molecular Probes). Stock solu-
tion may be stored at 4°C in the dark for several weeks.
15. Vectashield antifade mounting medium (Vector Laboratories).
3. Methods (
see
Notes 1 and 2).
A flowchart of the general protocol for TUNEL staining of cells and tissues
is shown in Fig. 1. Cells or tissues are fixed with formaldehyde then permeabil-
ized with ethanol to allow penetration of the TUNEL reaction reagents into the
cell nucleus. Following fixation and washing, incorporation of biotinylated-
dUTP onto the 3' ends of fragmented DNA is carried out in a reaction contain-
ing terminal deoxynucleotidyl transferase. Depending on the specific needs of
the investigator and/or available equipment, the incorporated biotinylated-
dUTP may be visualized by (1) fluorescence microscopy or FACS analysis
following staining with fluorescent-tagged avidin or (2) light microscopy fol-
lowing staining with horseradish peroxidase-conjugated avidin-biotin complex
in conjunction with a colorimetric substrate (see Notes 3 and 4).
3.1. Cultured Cells
3.1.1. Suspension Cells
1. Collect cells by centrifugation, wash with PBS, and resuspend cells at a concentra-
tion of 1–2 × 10
7
/mL in PBS. Transfer 100 µL of cell suspension to a V-bottomed
96-well plate.
2. Fix cells by addition of 100 µL of 2% formaldehyde in PBS, pH 7.4 (see Note 5).
Incubate on ice for 15 min.
3. Collect cells by centrifugation, wash once with 200 µL of PBS, the postfix with
200 µL of 70% ice-cold ethanol. Cells may be stored in 70% ethanol at –20°C for
several days.
4. Collect cells by centrifugation and wash twice with 200 µL PBS.
5. Resuspend cells (1 × 10
5
– 5 × 10
5
) in 50 µL of TdT equilibration buffer. Incubate
the cell suspension at 37°C for 10 min with occasional gentle mixing.
24 Loo
Fig. 1. General flow chart outlining the TUNEL assay protocols described in this
chapter for staining cultured cells and tissue sections.
6. Resuspend cells in 50 µL of TdT reaction buffer. Incubate the cell suspension at
37°C for 30 min with occasional gentle mixing.
7. Collect cells by centrifugation and wash with 200 µL PBS.
8. Resuspend the cells in 100 µL of TdT staining buffer. Incubate the cell suspen-
sion at room temperature for 30 min in the dark.
TUNEL Assay: Overview of Techniques 25
9. Collect cells by centrifugation, wash twice with 200 µL PBS, then resuspend in
PBS at 2–8 × 10
6
/mL. For fluorescence microscopy attach coverslips using
Vectashield antifade mounting medium.
10. Examine cells by fluorescence microscopy, confocal microscopy or flow
cytometry. See examples shown in Fig. 2 and 3.
3.1.2. Cytospin Preparation of Suspension Cells
TUNEL staining and subsequent fluorescent microscopic or confocal exam-
ination of suspension cells may be conveniently carried out on cells attached to
glass slides. The cell suspension protocol may be easily modified to accommo-
date cytospin samples, as described below.
1. Collect cells by centrifugation, wash with PBS, then collect on glass slides pre-
treated with aqueous 0.01% poly-L-lysine using a cytospin device. Routinely 1 ×
10
5
– 5 × 10
5
cells are collected on a single slide.
2. Fix cells by covering with a puddle of 1% formaldehyde in PBS for 15 min.
3. Rinse slides with PBS then transfer to a Coplin jar containing ice-cold 70% etha-
nol for 1 h. Slides may be stored overnight in 70% ethanol at 4°C.
4. Rinse slides with PBS and pipet 25–50 µL of TdT buffer onto the slides, enough
to cover the cells. Incubate the slides in a humidified chamber for 30 min at 37°C.
In order to conserve reagents a reduced volume of TdT buffer may be used and
carefully covered with a glass coverslip during the incubation. Take care to avoid
trapping air bubbles which may lead to staining artifacts.
Fig. 2. Confocal micrograph of TUNEL-stained Jurkat T lymphocytes. (A)
Untreated culture. (B) Fas ligand-treated culture undergoing apoptosis. Note the con-
densed TUNEL-positive chromatin within the nuclei of cells undergoing apoptosis
(see arrows).