Genetic linkage map construction and QTL identification of juvenile growth traits in Torreya grandis
Bạn đang xem bản rút gọn của tài liệu. Xem và tải ngay bản đầy đủ của tài liệu tại đây (2.31 MB, 9 trang )
Zeng et al. BMC Genetics 2014, 15(Suppl 1):S2
/>
PROCEEDINGS
Open Access
Genetic linkage map construction and QTL
identification of juvenile growth traits in Torreya
grandis
Yanru Zeng1*, Shengyue Ye1, Weiwu Yu1, Song Wu2, Wei Hou3, Rongling Wu4*, Wensheng Dai1, Jun Chang5
From International Symposium on Quantitative Genetics and Genomics of Woody Plants
Nantong, China. 16-18 August 2013
Abstract
Torreya grandis Fort. ex Lindl, a conifer species widely distributed in Southeastern China, is of high economic value
by producing edible, nutrient seeds. However, knowledge about the genome structure and organization of this
species is poorly understood, thereby limiting the effective use of its gene resources. Here, we report on a first
genetic linkage map for Torreya grandis using 96 progeny randomly chosen from a half-sib family of a
commercially cultivated variety of this species, Torreya grandis Fort. ex Lindl cv. Merrillii. The map contains 262
molecular markers, i.e., 75 random amplified polymorphic DNAs (RAPD), 119 inter-simple sequence repeats (ISSR)
and 62 amplified fragments length polymorphisms (AFLP), and spans a total of 7,139.9 cM, separated by 10 linkage
groups. The linkage map was used to map quantitative trait loci (QTLs) associated with juvenile growth traits by
functional mapping. We identified four basal diameter-related QTLs on linkage groups 1, 5 and 9; four heightrelated QTLs on linkage groups 1, 2, 5 and 8. It was observed that the genetic effects of QTLs on growth traits vary
with age, suggesting the dynamic behavior of growth QTLs. Part of the QTLs was found to display a pleiotropic
effect on basal diameter growth and height growth.
Introduction
Plant breeding has proven to be difficult because most
economically important traits are quantitatively inherited, controlled by an interacting network of genes, each
with a small effect, and environmental factors. This is
especially true for forest trees, a group of species characterized by long life spans, high heterozygosity, and
environmental heterogeneity [1,2]. It is ubiquitous that
variation in phenotypic traits of forest trees fluctuates
from year to year owing to varying contributions from
genetic and environmental factors. Molecular technologies extensively developed in the past several decades
have provided a powerful tool to dissert phenotypic variation into its underlying genetic factors, known as
* Correspondence: ;
1
The Nurturing Station for the State Key Laboratory of Subtropical
Silviculture, Zhejiang Agricultural and Forestry University, Lin’an, Zhejiang
311300, China
4
Center for Statistical Genetics, Pennsylvania State University, Hershey, PA
17033, USA
Full list of author information is available at the end of the article
quantitative trait loci (QTLs) [3-5]. Genetic mapping of
QTLs from linkage maps has become a routine avenue
to identify and study the genetic architecture of phenotypic traits [6].
There has been a considerable body of literature on the
construction of genetic maps in forest trees, such as
Eucalyptus [7], Salix [8], Betula [9], Populus [10-12], and
Pinus [13,14]. Because it is difficult or impossible to
obtain segregating populations from inbred lines, genetic
mapping in forest trees should use strategies that are different from those used in annual crops or model systems.
These strategies include (1) controlled crosses made
from two heterozygous parents, in which different types
of markers are segregating [15-17], and (2) open-pollinated progeny from a heterozygous tree, consisted of
seeds that share the same mother but have different
fathers [14,18]. In gymnosperms including conifers,
cycads, ginkgo, and Gnetales, a seed consists of a diploid
seed coat from the original parent sporophyte, a haploid
megagametophyte developed from a megaspore produced
© 2014 Zeng et al.; licensee BioMed Central Ltd. This is an Open Access article distributed under the terms of the Creative Commons
Attribution License ( which permits unrestricted use, distribution, and reproduction in
any medium, provided the original work is properly cited. The Creative Commons Public Domain Dedication waiver (http://
creativecommons.org/publicdomain/zero/1.0/) applies to the data made available in this article, unless otherwise stated.
Zeng et al. BMC Genetics 2014, 15(Suppl 1):S2
/>
by the original sporophyte, and a diploid embryo developed from the fertilization of the original sporophyte and
a male sporophyte [19]. Given its haploid feature, less
expensive dominant markers genotyped on the megagametophyte are equally informative to more expensive
codominant markers and, therefore, the megagametophyte has been widely used as a tissue to generate molecular markers for genetic mapping.
By taking advantage of megagametophyte-based genotyping, we constructed a low-density genetic linkage map
for an important but understudied conifer species, Torreya
grandis Fort. ex Lindl, using dominant markers. The
genus Torreya comprises 8 dioecious species, 5 of which
originate in China [20]. T. grandis cv. Merrillii is the only
commercially important ever-green variety for nut production. Despite its widespread cultivation in Southeastern
China for thousands of years, however, the genetic background of this variety has been poorly understood. In
T. grandis and T. grandis cv. Merrillii, only several protocols have been established for molecular marker assays
[21-24]. A limited set of markers has been used to estimate genetic relatedness among several varieties [25] and
identify sexes in young seedlings [26,27].
The genetic map reported in this study is a first one for
Torreya grandis. This map was constructed from an openpollinated progeny, composed of half-sibs, produced from
Torreya grandis Fort. ex Lindl cv. Merrillii. While markers
were genotyped from haploid megagametophyte, phenotypic traits were measured from the seedlings of these halfsibs generated from the diploid embryos. Wu [18] derived
a statistical model for mapping QTLs for diploid issues
using megagametophyte-based markers. We used this
model to map QTLs that control stem height and base diameter growth in juvenile seedlings. The dynamic pattern of
QTL effects detected was studied by functional mapping, a
statistical model for QTL mapping of developmental trajectories [28-32]. The identification of growth QTLs may
provide scientific guidance for marker-assisted selection of
economically important traits in Torreya grandis.
Results
Map construction
The 16 primers screened from five random samples generated a total of 109 markers, 91 of which (82%) were
polymorphic. The number of polymorphic RAPD markers produced per primer ranged from 2 to 11, with an
average of 5.7. ISSR analysis using 24 primers created
194 polymorphic loci in total on the genomic DNAs,
with an average of 8 loci per primer. Fifteen polymorphic
loci were amplified using primer ISSR-46, but only two
using ISSR-52. For AFLP analysis, 14 pairs of selective
primers generated 155 polymorphic loci, with E6/M4
amplifying 24 polymorphic loci while E2/M7 and E4/M5
amplifying three only, and an average of polymorphic loci
Page 2 of 9
produced by a pair of primers is 11. In total, three different types of markers generated 440 polymorphic loci.
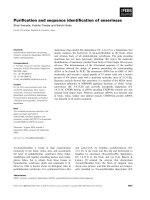
Of all the markers, 262 (75 RAPDs, 119 ISSRs and 68
AFLPs) (59%) were identified to follow Mendelian segregation ratio according to chi-square tests at a level of
≥ = 0.05. These markers were mapped to 10 linkage
groups at an LOD > 6 with Mapmaker 3.0. The total
map distance was 7,138 cM (Kosambi units) with an
average distance between adjacent markers of 28.2cM
(Figure 1). Linkage groups each comprise 7 - 71 loci
(138 - 1898.5cM). Table 1 shows the distribution of
markers in different linkage groups. Our long map constructed in Torreya grandis cv. Merrillii confirms the
detection of large genomes of coniferous species.
Detection of growth QTL
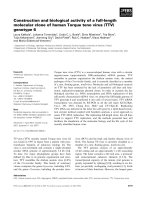
Growth curves of 510 young seedlings from the openpollinated population over the first three years are illustrated in Figure 2, where substantial variation in curve
shape exists, suggesting that specific QTLs may be involved
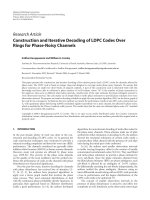
in developmental trajectories. Functional mapping was
used to scan the existence and distribution of QTLs for
growth traits by calculating genome-wide likelihood ratios
(LR) of the full model with a QTL and the reduced model
without QTL (Figure 3). By comparing the LR peaks with
chromosome-wide critical thresholds determined from permutation tests, we identified several significant QTLs for
stem diameter and height growth. As a first QTL study in
T. grandis, we used a less conservative criterion at the chromosome level to claim the significance of QTLs. Four
significant QTLs for stem diameter growth were detected
in marker intervals S11-2 - E8M8-2 on linkage group 1,
I-77-3 - I-36-6 in linkage group 5, I-17-8 - I-44-9 and
E6M5-11 - E8M8-1in linkage group 9. Four significant
QTLs for stem height are located between markers I-5610 - I-46-10 on linkage group 1, I-46-13 - E6M4-5 on linkage group 2, E6M7-2 - I-34-6 on linkage group 5 and
E6M8-6 - E7M3-12 on linkage group 8. Linkage group 1
and 5 carry the QTLs for both diameter and height growth,
suggesting that these segments may contribute to the
genetic correlation between these two growth traits.
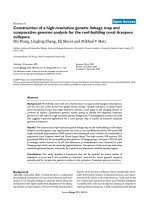
Using the estimated growth parameters, we drew
growth curves of each QTL identified for height and diameter traits (Figure 4A). In general, all genotypes
increase in both height and basal diameter with age,
although the extent of increase varies depending on the
QTL detected. For the height QTLs detected in linkage
groups 1, 2, and 8, favorable alleles for increasing stem
height are derived from the egg of T. grandis cv. Merrillii,
whereas the favorable allele at the QTL detected in linkage group 5 is from a pollen which may be generated by
either T. grandis cv. Merrillii or another tree in the pool.
For the diameter QTLs on linkage groups 1 and 5, the
egg of T. grandis cv. Merrillii contributes favorable alleles
Zeng et al. BMC Genetics 2014, 15(Suppl 1):S2
/>
Page 3 of 9
Figure 1 Genetic linkage map constructed from 75 RAPD, 119 ISSR and 68 AFLP markers for 96 half-sib seedlings derived from a
maternal parent in Torreya grandis cv. Merrillii.
for increasing radial growth, whereas two QTLs on linkage group 9 have their favorable alleles from the pollen.
As seen in Figure 4B, genetic effects on both diameter
and height growth increase with age during the early
stage of growth.
Discussion
Despite its economic, ornamental and ecological importance, the genetic study of Torreya grandis has received
little attention. For those underrepresented tree species
like T. grandis, for which little knowledge about their
genome structure and sequence is available, simple and
cheap dominant markers have still been widely used for
constructing genetic linkage maps. In this article, we
present a first linkage map for T. grandis constructed
from three types of dominant markers, RAPD, ISSR and
AFLP. A total of 262 markers are clustered into 10 linkage groups, totaling 7,138 cM in length. Since T. grandis
Table 1 Distribution of molecular markers on 10 linkage groups for a half-sib family of Torreya grandis cv. Merrillii.
Linkage Group
No. Markers
RAPD
ISSR
AFLP
Max. Distance
Min. Distance
Length
Ave. Distance
LG1
71
6
59
6
64.7
3.5
1898.5
27.1
LG2
46
6
24
16
75.5
4.2
1492.2
33.2
LG3
LG4
35
54
23
35
2
18
10
1
78.4
64.7
2.1
1
915.9
1394.4
26.9
26.4
LG5
12
1
5
6
53.7
14.3
397.3
36.1
LG6
8
0
0
8
50.7
8.2
253.2
36.2
LG7
8
4
4
0
40.9
3.5
138
19.7
20.1
LG8
8
0
1
7
36.9
7
140.6
LG9
11
0
4
7
53.7
9.4
284.4
28.4
LG10
9
0
2
7
50.7
4.7
223.4
27.9
Zeng et al. BMC Genetics 2014, 15(Suppl 1):S2
/>
Page 4 of 9
Figure 2 Plots of stem diameter (left) and height growth (right) in the first growing seasons of young seedlings from a half-sib family
of Torreya grandis cv. Merrillii. Part of this material, all with repeated measures at three time points, was used for functional mapping
of growth traits.
cv. Merrillii has a chromosome number of 2n = 2x = 22
[33], our map only partially covers the genome of
T. grandis. Also, given its large marker intervals, our
map is quite sparse which should be filled by more markers, especially more informative codominant markers.
Nevertheless, a long genetic map identified in our study
appears to support the big genome of a gymnosperm
[34,35]. This map provides an additional fuel to study
the structure, organization and evolution of conifer
genomes.
We used the linkage map constructed to identify several QTLs for height and radial growth by functional
mapping. Although the results presented in this article
are preliminary, our study is characterized by two features which are particularly important in genetic mapping of forest trees. First, our mapping design is based
on half-sibs from an open-pollinated individual tree in a
natural stand. This design can overcome the limitation
of genetic mapping for forest trees. Second, while many
QTL mapping studies result from the association
between markers and phenotypes observed at static
points, our method makes use of growth data longitudinally measured at multiple time points through functional mapping [28-32]. Since it was first proposed in
2002, functional mapping has been used to detect
growth QTLs in poplar [36] rice [37] and mouse [38].
Its tremendous advantage lies in its integration of biologically meaningful growth equations [39] into QTL
mapping, leading to interpretable results of QTL discoveries [40]. All the QTLs identified in this study change
their genetic effects over time, with some decreasing
while the other increasing.
Powerful genetic and molecular tools have made it possible not only to detect the action of genes at the juvenile
stage but also to detect their dynamic actions and interaction of individual loci or QTLs, which is of significance to
seedling production in both agriculture and forestry. It has
been well known that phenotypic formation results from
coordinated action of genes and environmental factors.
Based on a better understanding of gene actions, we can
design an optimal strategy for seedling selection and production in the first few years in the nursery. Such a strategy is especially important for tree species of highly
economic values, like T. grandis.
The design used is a half-sib family with members from
a heterozygous tree [14,18]. A more powerful design is to
sample multiple heterozygous trees randomly from a natural population and further collect open-pollinated seeds
from each sampled tree [41]. This design constructs a
two-stage hierarchical platform composed of the maternal genotypes and offspring genotypes. Wu et al. [41]
implemented a sophisticated procedure of the EM algorithm to provide the simultaneous estimates of linkage
disequilibria in natural populations and the QTL-marker
linkage based on offspring genotypes. Such a design integrating population genetics and quantitative genetics is
especially suitable for genetic mapping in T. grandis.
More recently, Sun et al. [42] embedded genetic imprinting into this design, enabling geneticists to chart a comprehensive picture of the genetic architecture of growth
Zeng et al. BMC Genetics 2014, 15(Suppl 1):S2
/>
Page 5 of 9
Figure 3 The profile of log-likelihood ratios (LR) for stem diameter (A) and height growth trajectories (B) throughout the genome
composed of 10 linkage groups in Torreya grandis cv. Merrilli. The genomic position corresponding to the peak of the curve is the
maximum-likelihood estimate of the QTL location. The 95th percentile (indicated at horizontal lines) of the distribution of the maximum LR
values obtained from 200 permutation tests is used as an empirical critical value to declare chromosome-wide existence of a QTL at a = 0.05.
Zeng et al. BMC Genetics 2014, 15(Suppl 1):S2
/>
Page 6 of 9
Figure 4 (A) Age-dependent expression profiles of two different genotypes at the QTL detected in different linkage groups for stem
diameter and height QTLs in Torreya grandis cv. Merrilli. Solid and broken curves represent QTL genotypes QQ and Qq, respectively. (B)
Age-dependent genetic effects of the QTLs detected on stem diameter and height growth. The genetic effects are estimated as the differences
of genotype QQ minus Qq.
and morphological traits in forest trees, including
T. grandis.
Materials and methods
Plant material
The mapping population consisted of 510 half-sib progeny
of T. grandis cv. Merrillii from a relatively isolated, open
pollinated tree located in Changming Village, Sankou
Town, Lin’an City, Zhejiang Province of China. The seeds
harvested were piled for 7 days to soften and remove
outermost arils and then stratified with sand in an open
area to accelerate germination with two layers of plastic
film covering on the pile top of the stratified seeds. When
the radicle appeared, the seeds were potted in medium
(peat: perlite: vermiculitm = 1: 1: 1), followed by partial
megagametophyte extraction from germinating seedlings
when seedlings were out of top medium. The white megagametophytes extracted were stored at -40°C for DNA isolation later. If megagametophytes are insufficient, fresh
young leaves were harvested for DNA isolation. Juvenile
Zeng et al. BMC Genetics 2014, 15(Suppl 1):S2
/>
growth traits, including seedling height, basal diameter
and branching number, were measured consecutively for
3 years at the end of each year.
Molecular marker analysis
DNA was extracted from both the megagametophytes
and young leaves of 96 seedlings by a CTAB method.
The quality of DNA extracted was tested by measurement with NanoDrop Sepectrophotomter ND-100 and
electrophoresis on 1% agarose gels, based on which the
DNA concentration was calculated. The DNAs of the 96
samples were used for RAPD, ISSR and AFLP analyses.
From 100 primers tested in five random samples, a
total of 16 RAPD primers were found to produce polymorphic markers. Amplifications were carried out in
20-µl aliquots of the solution containing 12.99 µl H2O,
2µl 10×buffer, 1.76 µl 25 mM MgCl2, 0.3 µl 10 mM solution of mixed dNTPs (Sangon Biotech (Shanghai) Co.,
Ltd.), 0.75µl 10µM primer, 2 µl of a 10 ng/µl DNA solution, and 0.2 µl 5 U/µl Taq DNA polymerase (TaKaRa
Biotechnology (Dalian) Co., Ltd.). Amplifications were
performed in a GeneAmp PCR System 9600 (Applied
Biosystem, Singapore) programmed for 40 amplification
cycles (94°C for 0.5 min, 35.2°C for 1.5 min, and 72°C for
1.5 min) followed by 7-min extension at 72°C. Amplification products were resolved by electrophoresis on a gel
of 1% agarose run at 110 V for 45 min in 1×TBE buffer.
Band sizes were estimated by comparison to a GeneRuler
100bp DNA Ladder (Fermentas). Gels were stained with
ethidium bromide (EB) and photographed on an Alpha
Imager (Alpha Innotech Corporation, USA), and the segregation patterns were scored manually as a band being
present or absent from a computer printout. The RAPD
markers were denoted by their primer code followed by
the numbering of the band (e.g. S30-8).
An AFLP analysis protocol was optimized based on
description by Vos et al. (1995). A 20 µl aliquot containing
250-ng genomic DNA, 2 àl 10ìNE-Buffer 2, 0.2 àl
100ìBSA, and 12.35µl H2O was digested with the restriction enzymes viz. 0.15µl of a 20 U/µl EcoRI (New England
Biolabs) and 0.3µl of a 10 U/µl MseI (New England Biolabs) at 37°C for 5 h followed by incubation at 65°C for
15 min to inactivate the enzyme. The DNA digested fragments in the 20 µl aliquot were then ligated at 16°C for
12 hours to 1.4 µl of M-adaptor (50 pM) and 1.0 µl of
E-adaptor (5 pM) contained in a 5 µl aliquot of 0.1µl of a
350 U/µl T4 ligase (TaKaRa Biotechnology (Dalian) Co.,
Ltd.) and 2.5àl 10ìT4 ligase buffer followed by a 10-min
enzyme inactivation at 65°C. The pre-selective amplification cycle was carried out in a GeneAmp PCR System
9600 (Applied Biosystem, Singapore) programmed for
25 amplification cycles (94°C for 0.5 min, 56°C for 1 min,
and 72°C for 1 min) followed by 5-min extension at 72°C
with one selective nucleotide (E-A, M-C) in an 20 µl
Page 7 of 9
aliquot containing 2 µl digested fragment solution, 1.5 µl
M-primer (10 mM), 1.5 àl E-primer (10 mM), 2.0 àl
10ìPCR buffer, 1.2 µl 25 mM MgCl2, 0.3 µl 5 U/µl Taq
polymerase (TaKaRa Biotechnology (Dalian) Co., Ltd.),
1.0 µl 10 mM solution of mixed dNTPs (Sangon Biotech
(Shanghai) Co., Ltd.), and 10.5µl H2O. The pre-selective
amplification product was diluted at 1:30 to be used as a
template in the following selective amplification. The
selective amplification was programmed for initially denaturing at 94°C for 3 min., 15 amplification cycles at 94°C
for 0.5 min, 67°C for 0.5 min, and 72°C for 1 min with a
lowered annealing temperature of 0.7 each cycle, and
23 cycles at 94°C for 0.5 min, 56°C for 0.5 min, and 72°C
for 1 min followed by 7-min extension at 72°C using a pair
of primers, each of which contained three selective nucleotides, in a 20 µl aliquot containing 2 µl diluted pre-amplification product, 1.4 µl M-primer (10 mM), 1 µl E-primer
(10 mM), 2.0 µl 10×PCR buffer, 1.3 µl 25 mM MgCl 2 ,
0.2 µl 5 U/µl Taq polymerase (TaKaRa Biotechnology
(Dalian) Co., Ltd.), 1.0 µl 10 mM solution of mixed dNTPs
(Sangon Biotech (Shanghai) Co., Ltd.), and 11.1µl H2O.
Totally 41 pairs of primers were used in the experiment.
The amplification products thus obtained were run on a
6% polyacrylamide gel for 2.5 h on a sequencer (CBS,
USA). Gel images were scanned and manually scored for
the presence or absence of bands. The AFLP bands were
named after the code of EcoR I/Mse I primer pairs followed by the number of the band.
In total, 24 ISSR primers were used in the analysis of
genomic DNAs. Amplifications were performed in 20-µl
aliquots of the solution, each of which contained 3 àl of
a 10 ng/àl template DNA, 2 àl 10ìbuffer, 3.25 µl
25 mM MgCl 2 , 0.5 µl 25 mM solution of each dNTP
(Sangon Biotech (Shanghai) Co., Ltd.), 0.7µl 10 µM primer, 0.2 µl Taq DNA polymerase (TaKaRa Biotechnology (Dalian) Co., Ltd.) and 10.35 µl H2O. Amplifications
were programmed for pre-denaturing at 94°C for 5 min,
and 35 amplification cycles (94°C for 30 s, denaturing
for 45 s, and 72°C for 90 s) followed by 7-min extension
at 72°C, in which the denaturing temperature varied
among primers. Amplification products were resolved
by electrophoresis on a gel of 1.6% agarose at 150 V for
30 min, EB stained and photographed (Alpha Innotech
Corporation, USA). The segregation patterns of ISSR
markers were scored and denoted in a way similar to
those of RAPD makers.
Map construction and QTL mapping
Chi-squared tests were performed to check if the markers
genotyped follow the Mendelian ratios. The markers with
significant departure from Mendelian segregation ratios
were excluded from the map construction. A maternal
linkage map was constructed using MapMaker version
3.0 [43] following a backcross mapping strategy. The data
Zeng et al. BMC Genetics 2014, 15(Suppl 1):S2
/>
sets of dominant markers were duplicated to allow the
detection of repulsion phase between linked markers,
indicated by R after the names of markers. The “triple
error detection” and the “error detection” features were
used to recognize the circumstance in which an event
was more probably the result of error than of recombination. These features avoid map expansion [44]. Linkage
groups were assigned with thresholds for a minimum
LOD (logarithm of the odds) score of 6.0 and a maximal
recombination fraction of 0.30. The markers were
ordered using the “Order” command iteratively with a
default LOD of 3.0. The first-sequence order was confirmed using the “Ripple” command permuting five markers at a time. All markers that were not ordered in the
first pass were placed again using the “Try” command.
Linkage maps were generated with the “map” command
using the Kosambi mapping function. Maps were drawn
with the program MapChart 2.1 [45].
For megagametophyte-generated markers, we used
Wu’s [18] approach to formulate a mixture likelihood for
functional mapping of QTLs that control growth traits.
Functional mapping is a dynamic model that was derived
to map growth QTLs through integrating growth equations into a mapping framework [28-32]. In this study,
growth traits were measured in the first three years of
growth. Growth curves that describe juvenile growth are
defined by an exponential equation [39], i.e.,
g (t) = aert
where g(t) is the growth of a trait at time t, a is the
constant and r is the exponent. Thus, by estimating a
and r for each QTL genotype, we can test the effect of a
QTL on growth curves.
Functional mapping also models the covariance structure of growth traits measured at multiple time points
by a statistical approach. In this study, we implemented
a first-order autoregressive (AR (1)) model to fit the
covariance structure by using the variance and the
between-time correlation. To make the data fitted by
the stationarity of covariance and correlation assumed
for the AR (1) model, we log-transformed raw data of
growth. The log-transformation leads to more parallel
curves and, thus, increases the feasibility of using the
analytically advantageous AR (1) model to analyze the
growth data.
If different genotypes at a given QTL correspond to
different trajectories, the QTL must affect the differentiation of this trait. Therefore, by estimating the curve
parameters (a, r) that define the trait trajectory of each
QTL genotype and testing the differences in these parameters among genotypes, we can determine whether a
dynamic QTL exists and how it affects the formation
and expression of a trait during development.
Page 8 of 9
Funding
Publication of this work was supported by grants
(2008C22003 and 2012C12904-12) from Department of
Science and Technology, Zhejiang Province, China, NSF/
IOS-0923975 and “863” Program 2013AA102605 of China.
Competing interests
The authors declared that they have no competing interests.
Authors’ contributions
Conceived and designed the experiments: YZ RW. Performed the
experiments: YZ SY WY. Analyzed the data: SW, WH. Contributed reagents/
materials/analysis tools: YZ WD JC. Wrote the paper: YZ RW.
Declarations
This article has been published as part of BMC Genetics Volume 15
Supplement 1, 2014: Selected articles from the International Symposium on
Quantitative Genetics and Genomics of Woody Plants. The full contents of
the supplement are available online at />bmcgenet/supplements/15/S1.
Authors’ details
The Nurturing Station for the State Key Laboratory of Subtropical
Silviculture, Zhejiang Agricultural and Forestry University, Lin’an, Zhejiang
311300, China. 2Department of Applied Mathematics Statistics, State
University of New York at Stony Brook, Stony Brook, NY 11794, USA.
3
Department of Preventive Medicine, State University of New York at Stony
Brook, Stony Brook, NY 11794, USA. 4Center for Statistical Genetics,
Pennsylvania State University, Hershey, PA 17033, USA. 5Research Institute of
Subtropical Forestry, Chinese Academy of Forestry, Fuyang, Zhejiang 311400,
China.
1
Published: 20 June 2014
References
1. Wu RL, Zeng Z-B, McKend SE, O’Malley DM: The case for molecular
mapping in forest tree breeding. Plant Breed Rev 2000, 19:41-68.
2. Neale DB, Kremer A: Forest tree genomics: growing resources and
applications. Nat Rev Genet 2011, 12:111-122.
3. Lander ES, Botstein D: Mapping Mendelian factors underlying
quantitative traits using RFLP linkage maps. Genetics 1989, 121:185-199.
4. Haley CS, Knott SA: A simple regression method for mapping
quantitative trait loci in line crosses using flanking markers. Heredity
1992, 69:315-324.
5. Wu R, Ma CX, Casella G: Statistical Genetics of Quantitative Traits Linkage, Maps, and QTL. Springer, New York; 2007.
6. Lynch M, Walsh B: Genetics and Analysis of Quantitative Traits. Sinauer
Associates, Sunderland, Massachusetts; 1997.
7. Grattapaglia D, Sederoff R: Genetic linkage maps of Eucalyptus grandis
and Eucalyptus urophylla using a pseudo-testcross: Mapping strategy
and RAPD markers. Genetics 1994, 137:1121-1137.
8. Hanley S, Barker A, Van Ooijen W, Aldam C, Harris L, Ahman I, Larsson S,
Karp A: A genetic linkage map of willow (Salix viminalis) based on AFLP
and microsatellite markers. Theor Appl Genet 2002, 105:1087-1096.
9. Pekkinen M, Varvio S, Kulju KKH, Kärkkäinen M, Smolander S, ViheräAarnio A, Koski V, Sillanpää MJ: Linkage map of birch, Betula pendula
Roth, based on microsatellite and amplified fragment length
polymorphisms. Genetics 2005, 48:615-625.
10. Bradshaw HD, Villar M, Watson BD, Otto KG, Stewart S, Stettler RF:
Molecular genetics of growth and development in Populus. III. A genetic
linkage map of a hybrid poplar composed of RFLP, STS, and RAPD
markers. Theor Appl Genet 1994, 89:167-178.
11. Wu RL, Han YF, Hu JJ, Li L, Li ML, Zeng Z-B: An integrated genetic map of
Populus based on amplified fragment length polymorphisms. Theor Appl
Genet 2000, 100:1249-1256.
12. Gaudet M, Jorge V, Paolucci I, Beritognolo I, Scarascia Mugnozza G,
Sabatti M: Genetic linkage maps of Populus nigra L. including AFLPs,
SSRs, SNPs, and sex trait. Tree Genet Genom 2008, 4:25-36.
Zeng et al. BMC Genetics 2014, 15(Suppl 1):S2
/>
13. Nelson CD, Kubisiak TL, Stine M, Nance WL: A genetic linkage map of
longleaf pine (Pinus palustris Mill.) based on random amplified
polymorphic DNAs. J Hered 1994, 85:433-439.
14. Wilcox PL, Amerson HV, Kuhlman EG, Liu BH, O’Malley DO, et al: Detection
of a major gene for resistance to fusiform rust disease in loblolly pine
by genomic mapping. Proc Natl Acad Sci USA 1996, 93:3859-3864.
15. Maliepaard C, Jansen J, van Ooijen JW: Linkage analysis in a full-sib family
of an outbreeding plant species: Overview and consequences for
applications. Genet Res 1997, 70:237-250.
16. Wu R, Ma C, Painter I, Zeng Z: Simultaneous maximum likelihood
estimation of linkage and linkage phases in outcrossing species. Theor
Pop Biol 2002, 61:349-363.
17. Lu Q, Cui YH, Wu RL: A multilocus likelihood approach to joint modeling
of linkage, parental diplotype and gene order in a full-sib family. BMC
Genet 2004, 5:20.
18. Wu RL: Mapping quantitative trait loci by genotyping haploid tissues.
Genetics 1999, 52:1741-1752.
19. Bierhorst DW: Morphology of Vascular Plants. Macmillan, New York; 1971.
20. Kang N, Tang ZX: Studies on the taxonomy of genus Torreya. Bull Bot Res
1995, 15:349-362.
21. He D: DNA extraction and establishment of an AFLP protocol in the
construction of a molecular genetic map in T. grandis cv. Merrillii. Thesis,
Central South Forestry University (In Chinese); 2000.
22. Hu F, Zhang D, Wuyuntana , Tan ×: Optimization of the experiment
conditions for the randomly amplif ied polymorphism DNA analysis for
Torreya grandis. Econ For Res 2002, 20(3):5-7, (In Chinese).Liang D, Wu Y,
Zeng Y, Cheng X, Wu S, Tong Z (2007) Establishment of an AFLP system in
Torreya grandis J Fujian Forest Sci Tech 34(2): 93-96 (In Chinese).
23. Ye S, Chen G, Zhang H, Liu J, Zeng Y, Wu H: Optimization of an ISSR-PCR
system and primer screening for Torreya grandis Fort. ex Lindl. cv.
Merrillii Hu. J Zhejiang Forest Coll 2010, 27(1):87-92.
24. Dai Z, Chen L, Tong P: Genetic variation and fingerprinting of Torreya
grandis cultivars detected by ISSR markers. Acta Hortic Sin 2008,
35(8):1125-1130, (In Chinese).
25. Liang D, Zhou Q, Shu Y, Zeng Y, Yu W: AFLP-base sexual identification in
Torreya grandis. J Zhejiang Forest Coll 2009, 26(1):63-67, (In Chinese).
26. Dai Z, Chen L, Tong P: RAPD and SCAR markers for sex identification in
Torreya grandis. J Fruit Sci 2008, 25(6):856-859, (In Chinese).
27. Ma CX, Gasella G, Wu R: Functional mapping of quantitative trait loci
underlying the character process: a theoretical framework. Genetics 2002,
161:1751-1762.
28. Wu R, Lin M: Functional mapping - how to map and study the genetic
architecture of dynamic complex traits. Nature Reviews Genetics 2006,
7:229-237.
29. Li Q, Huang Z, Xu M, Wang C, Gai J, Huang Y, Pang X, Wu R: Functional
mapping of genotype-environment interactions for soybean growth by
a semiparametric approach. Plant Methods 2010, 6:13.
30. Li Y, Wu RL: Functional mapping of growth and development. Biol Rev
2010, 85:207-216.
31. He QL, Berg A, Li Y, Vallejos CE, Wu RL: Modeling genes for plant
structure, development and evolution: Functional mapping meets plant
ontology. Trends Genet 2010, 26:39-46.
32. Guan Q, Yuan M, Yu Z: Early discrimination of karyotype and sexuality for
Chinese torreya. Sci Silv Sin 1993, 29(5):389-392, (In Chinese).
33. Zimin A, Stevens KA, Crepeau MW, Holtz-Morris A, Koriabine M, Marcais G,
Puiu D, Roberts M, Wegrzyn JL, de Jong PJ, Neale DB, Salzberg SL, Yorke JA,
Langley CH: Sequencing and assembly of the 22-Gb loblolly pine
genome. Genetics 2014, 196:875-890.
34. Wegrzyn JL, Liechty JD, Stevens KA, Wu LS, Loopstra CA, Vasquez-Gross HA,
Dougherty WM, Lin BY, Zieve JJ, et al: Unique features of the loblolly pine
(Pinus taeda L.) megagenome revealed through sequence annotation.
Genetics 196:891-909.
35. Wu RL, Ma CX, Lin M, Casella G: A general framework for analyzing the
genetic architecture of developmental characteristics. Genetics 2004,
166:1541-1551.
36. Zhao W, Zhu J, Gallo-Meagher M, Wu R: A unified statistical model for
functional mapping of environment-dependent genetic expression and
genotype × environment interactions of ontogenetic development.
Genetics 2004, 168:1751-1762.
Page 9 of 9
37. Wu R, M CX, Hou W, Corva P, Medrano JF: Functional mapping of
quantitative trait loci that interact with the hg mutation to regulate
growth trajectories in mice. Genetics 2005, 171(1):239-249.
38. Bertalanffy VL: Quantitative laws for metabolism and growth. Q Rev Biol
1957, 32:217-231.
39. Sillanpää MJ, Pikkuhookana P, Abrahamsson S, Knürr T, Fries A, Lerceteau E,
Waldmann P, García-Gil MR: Simultaneous estimation of multiple
quantitative trait loci and growth curve parameters through hierarchical
Bayesian modeling. Heredity 2012, 108:134-146.
40. Lander ES, Green P, Abrahamson J, Barlow A, Daly M, Lincoln S, Newburg L:
MapMaker, an interactive computer package for construction genetic
linkage maps of experimental and natural populations. Genomics 1987,
1:174-181.
41. Lincoln SE, Lander ES: Systematic detection of errors in genetic linkage
data. Genomics 1992, 14:604-610.
42. Voorrips RE: MapChart: Software for the graphical presentation of linkage
maps and QTLs. J Hered 2002, 93:77-78.
doi:10.1186/1471-2156-15-S1-S2
Cite this article as: Zeng et al.: Genetic linkage map construction and
QTL identification of juvenile growth traits in Torreya grandis. BMC
Genetics 2014 15(Suppl 1):S2.
Submit your next manuscript to BioMed Central
and take full advantage of:
• Convenient online submission
• Thorough peer review
• No space constraints or color figure charges
• Immediate publication on acceptance
• Inclusion in PubMed, CAS, Scopus and Google Scholar
• Research which is freely available for redistribution
Submit your manuscript at
www.biomedcentral.com/submit