Báo cáo y học: "Construction of a high-resolution genetic linkage map and comparative genome analysis for the reef-building coral Acropora millepora" ppt
Bạn đang xem bản rút gọn của tài liệu. Xem và tải ngay bản đầy đủ của tài liệu tại đây (383.24 KB, 17 trang )
Genome Biology 2009, 10:R126
Open Access
2009Wanget al.Volume 10, Issue 11, Article R126
Research
Construction of a high-resolution genetic linkage map and
comparative genome analysis for the reef-building coral Acropora
millepora
Shi Wang, Lingling Zhang, Eli Meyer and Mikhail V Matz
Address: Section of Integrative Biology, School of Biological Sciences, University of Texas at Austin, 1 University Station C0930, Austin, TX
78712, USA.
Correspondence: Shi Wang. Email:
© 2009 Wang et al.; licensee BioMed Central Ltd.
This is an open access article distributed under the terms of the Creative Commons Attribution License ( which
permits unrestricted use, distribution, and reproduction in any medium, provided the original work is properly cited.
Coral genetic map<p>A high-resolution genetic linkage map for the coral Acropora millepora is constructed and compared with other metazoan genomes, revealing syntenic blocks.</p>
Abstract
Background: Worldwide, coral reefs are in decline due to a range of anthropogenic disturbances,
and are now also under threat from global climate change. Virtually nothing is currently known
about the genetic factors that might determine whether corals adapt to the changing climate or
continue to decline. Quantitative genetics studies aiming to identify the adaptively important
genomic loci will require a high-resolution genetic linkage map. The phylogenetic position of corals
also suggests important applications for a coral genetic map in studies of ancestral metazoan
genome architecture.
Results: We constructed a high-resolution genetic linkage map for the reef-building coral Acropora
millepora, the first genetic map reported for any coral, or any non-Bilaterian animal. More than 500
single nucleotide polymorphism (SNP) markers were developed, most of which are transferable in
populations from Orpheus Island and Great Keppel Island. The map contains 429 markers (393
gene-based SNPs and 36 microsatellites) distributed in 14 linkage groups, and spans 1,493 cM with
an average marker interval of 3.4 cM. Sex differences in recombination were observed in a few
linkage groups, which may be caused by haploid selection. Comparison of the coral map with other
metazoan genomes (human, nematode, fly, anemone and placozoan) revealed synteny regions.
Conclusions: Our study develops a framework that will be essential for future studies of
adaptation in coral and it also provides an important resource for future genome sequence
assembly and for comparative genomics studies on the evolution of metazoan genome structure.
Background
Although substantial effort is being devoted to understand
physiological mechanisms of coral stress tolerance and accli-
mation [1-3], virtually nothing is currently known about the
mechanisms that might enable their adaptation to the chang-
ing climate over generations. We have recently demonstrated
that the coral Acropora millepora shows considerable genet-
ically determined variation in thermal tolerance and respon-
siveness of the larvae to the settlement cue, which may be the
raw evolutionary material for future local thermal adaptation
or modification of the larval dispersal strategy in response to
ongoing climate change [4]. A high-resolution genetic linkage
Published: 10 November 2009
Genome Biology 2009, 10:R126 (doi:10.1186/gb-2009-10-11-r126)
Received: 30 July 2009
Revised: 12 October 2009
Accepted: 10 November 2009
The electronic version of this article is the complete one and can be
found online at /> Genome Biology 2009, Volume 10, Issue 11, Article R126 Wang et al. R126.2
Genome Biology 2009, 10:R126
map would enable identification of the quantitative trait loci
(QTLs) associated with these and other adaptation-relevant
physiological traits [5,6]. To date, however, no genetic map
has been constructed for any coral species, mainly due to lack
of genetic resources for most corals.
The coral A. millepora, like the majority of hermatypic (algal
symbiont-hosting) corals of the order Scleractinia, is a diploid
hermaphrodite with 2n = 28 chromosomes [7]. A. millepora
is common across the Indo-Pacific. As a representative of the
most speciose and ecologically important coral genus Acro-
pora, A. millepora is becoming the leading coral model in
terms of molecular groundwork. Currently, 50 microsatellite
markers are available for this species [8,9]. Although these
markers are obviously not enough for linkage mapping, they
are already the largest marker collection available for any
reef-building coral. Single nucleotide polymorphisms (SNPs)
are the most abundant type of genetic variation in eukaryotic
genomes, and are the preferred genetic markers for a variety
of applications such as high-resolution linkage mapping, QTL
mapping of complex traits, and for combining these results
with population genomics, which is arguably the most power-
ful way of detecting and understanding the process of natural
adaptation [10]. Previously, our group has released a large
body of sequence data for A. millepora obtained by 454
sequencing of the larval transcriptome [11]. More than
33,000 putative SNPs have been identified in these data.
Since the detected SNPs reside in or immediately next to the
protein-coding sequences ('gene-based SNPs'), they are par-
ticularly useful for QTL mapping and population genomics
studies because they have the potential for quickly identifying
causal genes underlying complex traits [12,13].
A genetic linkage map, especially gene-based, is also an excel-
lent platform for comparative genome studies. Recent com-
parative genome analyses based on genetic maps have
already provided new insights into genome organization, evo-
lution, and function across different organisms [14-20]. For
example, comparison of the Caenorhabditis briggsae genetic
map and the Caenorhabditis elegans genome reveals exten-
sive conservation of chromosome organization and synteny
despite a very long divergence time (80 to 110 million years),
suggesting that natural selection operates at the level of chro-
mosomal organization [14]. In another study, a genetic link-
age map of the blind Mexican cavefish Astyanax mexicanus
has been successfully applied to predict candidate quantita-
tive trait genes relating to rib number and eye size by anchor-
ing cavefish QTLs to the zebrafish genome [16]. The phylum
Cnidaria is the sister group of the Bilateria. Anthozoan cni-
darians such as corals are phylogenetically basal in the phy-
lum Cnidaria, and have proven to be particularly informative
for understanding the evolution of metazoan genetic and
developmental complexity [21,22]. Identification of con-
served synteny blocks across coral and other metazoan
genomes would help to unravel ancestral metazoan genome
architecture.
Here, we report the first high-resolution genetic linkage map
for a reef-building coral, Acropora millepora, which was con-
structed based on a family of larvae from a cross between two
naturally heterozygous coral individuals from Magnetic
Island, Australia (an outbred full-sib cross design). An inves-
tigation of SNP transferability was carried out in two more
populations. Sex differences in recombination were observed
in the coral linkage map. Comparison of the coral map with
other metazoan genomes (human, nematode, fly, anemone
and placozoan) was conducted to identify syntenic regions.
This coral genetic map should lay a solid foundation for a
variety of future genetic and genomic studies such as QTL
mapping of adaptive traits, population genomics, compara-
tive genomics, and assembly of the coral genome.
Results
SNP marker development
For SNP marker development, we designed PCR primers for
1,033 candidate SNPs, which were previously identified in the
A. millepora larval transcriptome by 454-FLX sequencing
[11]. After PCR amplification, 603 produced single strong
bands with expected sizes, of which 427 SNPs were hetero-
zygous in at least one parent of the mapping family, 91 were
homozygous in both parents but for two different alleles, and
85 showed no genetic variations in two parents. Although we
restricted the expected amplicon length to about 100 bp in
primer design, 208 primer pairs still produced single strong
bands but of larger than expected sizes, indicating potential
introns in the vicinity of the SNPs. Longer amplicons greatly
diminish the precision of high-resolution melting (HRM)
SNP analysis, so most of these intron-containing amplicons
were discarded. Only four SNP markers developed based on
intron sequences were included in this study. The remaining
222 attempted SNP assays resulted in poor amplification
(very little or no product) or bad melting curves, suggesting
non-specific amplification.
In order to evaluate the transferability of our markers in other
populations of A. millepora, we randomly selected 48 SNP
markers to test their applicability on 7 colonies from 2 Aus-
tralian Great Barrier Reef locations, Orpheus Island (n = 4)
and Great Keppel Island (n = 3), which are 80 km and 570 km
away from Magnetic Island, respectively. All the 48 SNP
markers could be successfully amplified in the assayed sam-
ples. Notably, 36 (75%) and 31 (65%) of them were still poly-
morphic in the Orpheus Island and Great Keppel Island
populations, respectively, despite the fact that only a few indi-
viduals were assayed.
Linkage mapping
Linkage analysis was carried out using JoinMap 4.0 software
[23]. In total, 469 markers (431 SNPs and 38 microsatellites)
were heterozygous in at least one parent of the mapping fam-
ily, and were therefore included in the linkage analysis. Seg-
regation analysis showed that 380 markers conform to the
Genome Biology 2009, Volume 10, Issue 11, Article R126 Wang et al. R126.3
Genome Biology 2009, 10:R126
expected Mendelian ratios at P ≥ 0.05 level. More than half of
the distorted markers depart only slightly from expected
Mendelian ratios (0.01 <P < 0.05).
At the initial logarithm of the odds (LOD) threshold of 4.5,
293 markers were grouped into 14 linkage groups, which cor-
responds to the known haploid chromosome number for this
species. Then 124 markers were added to the established
groups at LOD = 3, and 14 additional markers were added at
LOD = 2.5. After data partitioning by the Joinmap 4.0 pro-
gram, the maternal (1:1 female type) and paternal (1:1 male
type) datasets contained 167 and 155 markers, respectively,
which were subsequently used for constructing sex-specific
maps based on the two-way pseudo-testcross strategy [24].
The female map contains 152 markers and spans 1,185.8 cM,
while the male map contains 149 markers and spans 945.4 cM
(Figures 1, 2, 3 and 4). The female map is 240.4 cM (30%)
longer than the male map, even discounting L8 and L14
where recombination information is missing for one parent.
Large differences between recombination rates in the male
and female parents were observed for linkage groups L4, L5,
L6, L10 and L11 (Table 1). Notably, we found that the poly-
morphism level revealed by markers in L8 was significantly
lower than the average in the male parent (chi-square test, P
< 0.0001). More interestingly, we found that more than half
of the annotated genes in this linkage group were putatively
involved in sexual reproduction (Table 2).
The consensus map contains 429 markers (393 SNPs and 36
microsatellites) in 14 linkage groups (Figures 1, 2, 3 and 4),
and spans 1,391 cM with an average marker interval of 3.4 cM.
The length of each linkage group ranges from 46 cM to 161.5
cM. Marker density varies dramatically across linkage groups
(Table 1). For example, both L1 and L14 are approximately 95
cM in length, but L1 contains 59 markers whereas L14 con-
tains only 12 markers. Nine putative stress-related genes were
identified in the consensus map (Figures 1, 2 and 3; EM and
MVM, unpublished) [25,26]. These genes are involved in
cytoskeleton formation, heat shock, oxidative stress, protein
degradation, and vesicular transport.
Genome lengths estimated by two different methods [27,28]
are similar at 1,484.8 cM (G
e1
) and 1,501.9 cM (G
e2
), respec-
tively. The average of two estimates was taken as the expected
genome length - 1493.4 cM. Given an estimated genome size
of 200 Mbp for A. millepora [1], the average recombination
rate across all linkage groups is approximately 7.5 cM/Mbp.
The genome coverage of the current map was estimated as
93.1%.
Comparative genome analysis
Comparison of the markers mapped in this study with the
previously annotated coral larval transcriptome [11] allowed
the assignment of nearly all markers (97%) to longer cDNA
sequences, which included all markers derived from 454 tran-
scriptome sequences. Of the 416 sequences so identified, 286
(69%) corresponded to known genes based on the previously
described transcriptome annotation [11]; 280 genes mapped
by this process were each associated with a single marker,
with 6 genes containing two markers each. The accession
numbers, gene annotation, and synteny information for all
mapped markers are shown in Additional data file 1.
Table 1
Summary of the coral genetic linkage map
Linkage group Number of
markers
Length (cM) Average marker
interval (cM)
Length in female
map (cM)
Length in male
map (cM)
Ratio of female/
male
recombination rate
1 59 94.7 1.6 96.5 98.9 1.0
2 57 114.0 2.0 110.3 104.8 1.1
3 46 112.3 2.5 94.2 85.7 1.1
4 44 141.0 3.3 141.1 70.6 2.0
5 34 118.2 3.6 122.4 56.7 2.2
6 34 161.5 4.9 142.8 100.3 1.4
7 28 100.3 3.7 81.1 74.6 1.1
8 27 101.1 3.9 99.8 NA NA
9 21 84.6 4.2 68.0 65.7 1.0
10 18 89.4 5.3 60.2 39.7 1.5
11 18 67.0 3.9 62.1 45.0 1.4
12 17 66.0 4.1 58.5 55.1 1.1
13 14 46.0 3.5 48.8 48.5 1.0
14 12 95.2 8.7 NA* 99.8 NA
All 429 1,391.0 3.4 1,185.8 945.4 1.3
*Not available (NA) due to the lack of recombination information for one of the parents.
Genome Biology 2009, Volume 10, Issue 11, Article R126 Wang et al. R126.4
Genome Biology 2009, 10:R126
Comparison of the mapped sequences with assembled
genomes from other metazoans identified putative homologs
for between 48% (nematode) and 80% (sea anemone) of the
mapped coral genes, and a similar comparison with the yeast
genome identified putative homologs for 29% of mapped
coral genes. These pairs of putative homologs allowed for
comparison of the coral genetic map with assembled genome
sequences of other metazoans, identifying conserved synteny
blocks in 11 of the 14 coral linkage groups, each of which con-
tained from 3 to 12 markers. The largest synteny block con-
served between coral and another metazoan was found in
linkage group 4, with 12 markers spanning 69 cM in the coral
linkage group and their best matches spanning 5 Mb in scaf-
fold 5 of the Trichoplax adhaerens genome (Figure 5). An
overlapping set of markers within this same linkage group
also showed conserved synteny with the anemone Nemato-
stella vectensis (Figure 5). Synteny blocks were identified in
each of the metazoan comparisons; each comparison identi-
fied 4 to 13 blocks, with each block containing 3 to 12 markers
(Table 3). Most of the conserved synteny blocks identified
here involved intra-chromosomal rearrangements, in which
linkage was conserved but gene order was not (for example,
the synteny block conserved between coral and placozoan in
Figure 5). Notably, a parallel comparison between the coral
map and the yeast genome found no evidence of conserved
synteny, even though the small genome size of yeast (approx-
imately 12 Mb) would be expected to relax one of the opera-
tional criteria for determining synteny (the requirement that
matches occur within ≤10 Mb in the yeast chromosome).
We tested for the significance of synteny blocks using ran-
domly shuffled permutations of the original data, which
revealed that a non-trivial number of synteny blocks could be
expected to emerge in these comparisons by random chance
(Table 3). Although numerous synteny blocks were detected
in comparisons between coral and Drosophila melanogaster
or C. elegans, the number of blocks detected was not signifi-
cantly higher than expected by chance for either comparison
(P = 0.68 and P = 0.39, respectively). In contrast, the other
three metazoan genomes we investigated each showed signif-
icantly more synteny than expected by chance (anemone, P <
0.001; placozoan, P = 0.002; human, P = 0.002). Obviously
the comparison with yeast (Saccharomyces cerevisiae),
which found no conserved synteny, was unaffected by these
statistical tests. Each of the metazoan genome comparisons
identified at least one synteny block that contained more
markers (n = 6 to 12) than expected by chance. These signifi-
cant blocks of conserved synteny are depicted in Figure 5, and
the syntenic markers in each block are described in more
detail in Additional data file 1.
Discussion
SNP marker development in coral
Molecular markers are useful tools for assessing important
ecological and evolutionary issues such as connectivity, local
adaptation, range shifts, biodiversity depletion, speciation,
and invasion. Despite widespread concerns about the future
of reef-building corals in the changing climate, genetic
resources for corals remain scarce. The traditional ways of
developing microsatellites or SNP markers are quite costly
and time-consuming. Moreover, due to technical problems
and low abundance in the genome, it has been shown that
development of a large number of microsatellite markers in
acroporid corals is particularly difficult based on the tradi-
tional microsatellite-enriched genomic library method [29].
Despite the advantages of SNP markers for a variety of tasks
[30], their use in non-model organisms such as corals has
been hampered primarily due to the costs of high-throughput
SNP discovery and genotyping. With the introduction of the
next-generation 454 sequencing technology, high-through-
put SNP discovery is now feasible for any non-model organ-
ism. Our previous study [11], as well as others recently
published [31-33], demonstrates a cost-effective way to pro-
Table 2
A list of genes from linkage group 8 that are putatively involved in sexual reproduction
Marker Position (cM) Gene name Biological process Reference
C2348S700 0 Tubulin-specific chaperone A (TBCA) Spermatogenesis [94]
C20407S208 20.6 Death-associated protein kinase 3 (Dapk3) Spermatogenesis [95]
C19470S311 23.3 RNA-binding protein MEX3C (Mex3c) Regulation of germ cell mitosis [96]
C16549S511 24.5 Myosin-13 (MYH13) Oogenesis [97]
C21253S536 46.4 Zinc finger RNA-binding protein (ZFR) Meiosis I [98]
C12216S415 49.9 Translocon-associated protein subunit beta (Ssr2) Spermatogenesis [99]
C43885S203 52.9 Chromodomain-helicase-DNA-binding protein 1 (CHD1) Gametogenesis [100]
C12479S421 62.2 Putative tyrosinase-like protein tyr-1 (tyr-1) Spermatogenesis [101]
C6250S141 68.1 Zinc finger CCHC domain-containing protein 9 (ZCCHC9) Spermatogenesis [102]
C15011S233 73.0 Serine protease 23 (PRSS23) Ovary remodeling [103]
C25187S178 76.8 SNARE-associated protein Snapin (Snapin) Spermatogenesis [104]
C63883S448 101.1 WD repeat-containing protein 47 (Wdr47) Spermatogenesis [101]
Genome Biology 2009, Volume 10, Issue 11, Article R126 Wang et al. R126.5
Genome Biology 2009, 10:R126
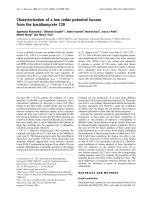
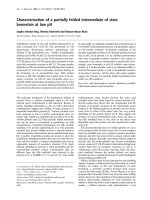
A genetic linkage map (L1 to L4) of the reef-building coral A. milleporaFigure 1
A genetic linkage map (L1 to L4) of the reef-building coral . Female (F) and male (M) maps are shown on the left and right, respectively, and the consensus
map is shown in the center. Homologous loci are connected with solid lines. Putative stress-related markers are shown in red. Distorted loci are indicated
by asterisks (*0.01 <P < 0.05, ** P < 0.01; *** P < 0.001).
C13288S189
0.0
C11422S292
6.1
WGS211
13.0
C19740S286
20.4
C1024S157
21.1
C17912S202
22.4
EST254 **
28.0
C19263S650
32.1
C19862S335
34.0
C11959S269 *
36.0
C21833S285
40.9
C22405S305
43.6
C14455S306
53.4
C22875S709 *
62.2
EST181
63.9
C10466S190
75.0
C52176S400 *
75.1
C18841S310
78.2
C11099S398
82.7
C15620S247
84.7
C13698S442
90.0
C841S459
95.6
WGS079
96.5
C21349S456
0.0
C1328S290
1.9
C11524S150 *
4.7
C13288S189
5.8
C20570S83
7.3
C11422S292
9.4
WGS211
11.1
C25302S260
15.8
C24856S313
19.7
C19740S286
22.1
C1024S157
23.1
C17622S201 *
23.5
C12140S96
24.6
C17828S268
26.7
C21470S842
29.7
C3633S408
30.8
C17438S197
33.6
C17912S202
34.4
C15044S328
35.4
C45199S349
36.6
EST254 **
36.7
C19263S650
38.4
C19862S335
39.1
C35020S147
39.8
C18397S183
40.1
C11959S269 *
42.5
C22545S1379
43.0
C22826S366
44.5
C13905S483 *
47.4
C26852S307
48.2
C21833S285
49.2
C21186S526
49.9
C22405S305
51.1
C20625S210
53.0
C14455S306
54.5
C20763S245
56.2
C3729S182
59.2
C22875S709 *
60.3
C12606S270
60.7
EST181
62.1
C23083S345
62.5
C17741S312
65.0
C25628S525
68.5
WGS051
70.1
C10466S190
70.8
C52176S400 *
70.9
C18443S396 *
73.1
C18841S310
73.9
C22993S160 ***
76.2
C11099S398
77.7
C31833S405 *
78.6
C15620S247
79.2
C22973S285
81.8
C11470S398
84.7
C13698S442
86.9
C841S459
91.8
WGS079 **
92.6
C15873S711
94.5
C14269S102 *
94.7
C11524S150 *
0.0
C20570S83
6.4
WGS211
15.6
C17622S201 *
25.0
C45199S349
37.4
C35020S147
41.5
C26852S307
49.5
C20625S210
51.5
C20763S245
58.1
C23083S345
65.6
C25628S525
72.1
C18443S396 *
79.8
C22993S160 ***
87.5
C31833S405 *
88.9
WGS079 *
97.7
C15873S711
98.9
C36218S165
0.0
C45380S826
15.6
C24159S323
35.2
C20274S537 *
36.7
C12902S674
50.3
C237S473
58.6
C24096S618 **
60.0
C6659S249 *
71.4
C17077S225
0.0
C16387S343
23.4
C22900S198 **
38.9
C36218S165
0.0
C18580S230
13.2
C23375S174 *
15.8
C45380S826
16.1
C18366S189
24.1
EST164
26.5
C14319S510 *
35.9
C24159S323
36.4
C14226S523 *
38.1
C20274S537 *
40.6
C21618S209
42.8
C19944S225
44.3
C13648S225
44.5
C19364S520
47.0
C22643S340 ***
47.2
C20821S413
50.4
EST165 ***
54.0
C20399S426
55.4
C12902S674
56.2
C13142S250
EST062 **
57.5
C237S473
61.7
C22821S388
62.7
C24096S618 **
64.5
Apam3_166
66.0
C10697S175
66.7
C25444S173
68.4
C14487S191 ***
71.9
C13354S446 **
72.6
C6659S249 *
73.9
C20442S307
75.4
C26831S450
76.0
C13486S116 **
76.9
C24129S242
78.9
C14357S360
79.3
C2435S173
81.7
C25234S280
82.6
C25652S324
84.0
C23734S391
84.9
C15351S256 *
85.1
C17077S225
86.7
C16387S343
87.3
C15493S507
89.1
C17287S307
90.7
C12507S635
90.8
C18231S140
91.3
C22109S391 *
93.7
C25536S620 *
95.6
C22900S198 **
96.0
C15056S244
99.0
C54074S403 ***
101.5
C14474S185
101.8
C26329S310
105.5
C25946S829
105.7
C11020S415
108.6
C25425S128
112.8
C14242S316
114.0
C18580S230
0.0
C23375S174 *
2.0
C18366S189
8.1
EST164
12.9
C14319S510 *
22.6
C14226S523 *
25.5
C13648S225
31.5
C22643S340 ***
34.1
C20821S413
37.5
C20399S426
43.0
C12902S674
46.6
Apam3_166
53.3
C25444S173
54.0
C14487S191 ***
55.0
C13354S446 **
55.2
C13486S116 **
58.1
C25234S280
62.0
C23734S391
66.6
C15351S256 *
69.0
C15493S507
75.1
C22109S391 *
77.5
C25536S620 *
82.1
C15056S244
86.4
C14474S185
91.2
C14242S316
104.8
C188S318 *
0.0
C28595S225
19.9
C15111S282
23.4
C34124S511
26.0
C19002S323
38.6
C16956S551
46.7
WGS131
55.9
C1136S272
62.3
C11110S247 *
67.6
C21244S233
72.4
C29060S309
81.7
C15670S505
94.2
C26271S403
0.0
C188S318 *
1.6
C10862S253
9.4
C17498S226 **
16.0
C28595S225
16.4
C38503S228
18.5
C15111S282
28.0
C22427S223
29.6
C27925S129
32.2
C15176S465
34.2
C34124S511
36.3
C16912S265
37.8
C19002S323
39.5
C19713S134
42.0
C20998S134
44.0
C18165S232
44.2
C12093S318
44.8
C10565S307 **
46.2
C16956S551
49.2
C13265S200
49.6
C23489S194
53.9
WGS131
55.9
C20581S243
58.4
C24932S258
61.1
C23738S719
62.5
C11110S247 *
C1136S272
63.7
C16621S398
64.7
C22425S453
68.0
C24216S175
69.0
EST016
70.4
C166S563
72.5
C21244S233
73.2
C12174S605
75.1
C13535S196 **
75.4
C11242S364
78.0
C28868S363 *
79.5
C29060S309
C16965S252
84.6
C22138S164
86.5
C15670S505
90.9
WGS035
91.9
C18064S518
98.1
C23209S177 **
99.6
C60613S230
105.8
C10810S897
112.3
C26271S403
0.0
C10862S253
12.0
C17498S226 **
24.9
C22427S223
29.2
C15176S465
30.6
C16912S265
37.4
C19713S134
40.4
C12093S318
43.2
C10565S307 **
44.6
C13265S200
48.0
C23489S194
52.4
WGS131
56.2
C20581S243
57.0
C23738S719
60.6
C16621S398
63.6
C22425S453
66.1
C24216S175
67.8
EST016
69.7
C166S563
71.6
C12174S605
74.0
C11242S364
76.8
C16965S252
83.3
WGS035
85.7
C17479S262
0.0
C15084S136
16.7
C24438S225
24.0
C14364S490
34.2
C3724S507
35.8
C14018S197
42.2
C27153S258
43.6
C29226S281
60.1
C18185S479
62.8
C7889S263 **
C18487S1302 ***
70.7
C22633S340
72.5
C1063S181
78.1
WGS116 ***
86.8
C13992S181 **
90.4
C26116S342
96.6
C48806
102.8
C17914S739
104.5
C11759S946
113.3
C12464S260
120.1
C11999S90
124.5
C13550S341
141.1
C17479S262
0.0
C15084S136
16.7
C24438S225
24.0
C14364S490
34.2
C3724S507
35.8
EST007
37.3
C14018S197
42.2
C19797S331
43.6
C27153S258
44.1
C18363S421
50.2
C7134S210
56.4
C13990S341
57.9
C29226S281
C17330S121
59.8
C18920S453
60.4
C18185S479
62.6
C5239S208 *
65.2
EST149
68.1
C10773S305
70.0
C7889S263 **
72.3
C18487S1302 ***
72.4
C11797S545
72.8
C22633S340
73.7
C10625S161 *
74.0
C76S562
76.4
C13301S439
77.1
C1063S181
77.8
C19928S437
80.4
C23327S599
84.1
WGS116 **
85.8
C20443S297 *
89.4
C13992S181 **
89.9
C20163S412
92.9
C63602S197
95.1
C26116S342
96.6
C14848S1085
99.4
C11461S560
100.9
C48806
102.7
C17914S739
104.1
C14404S340 ***
108.7
C11759S946
112.5
C12464S260
119.7
C11999S90
124.3
C13550S341
141.0
EST007
0.0
C18363S421
11.8
C7134S210
18.2
C17330S121
22.8
C5239S208 *
26.9
C10773S305
31.5
C11797S545
34.5
C10625S161 *
35.4
C19928S437
41.2
WGS116
45.5
C20443S297 *
51.1
C20163S412
55.2
C63602S197
57.1
C14848S1085
61.9
C14404S340 ***
70.6
L1-F L1 L1-M L2-F L2 L2-M
L3-F L3 L3-M L4-F L4 L4-M
Genome Biology 2009, Volume 10, Issue 11, Article R126 Wang et al. R126.6
Genome Biology 2009, 10:R126
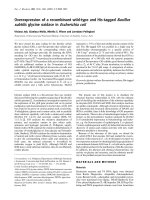
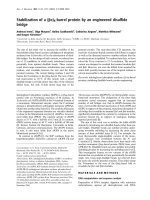
A genetic linkage map (L5 to L8) of the reef-building coral A. milleporaFigure 2
A genetic linkage map (L5 to L8) of the reef-building coral A. millepora. Female (F) and male (M) maps are shown on the left and right, respectively, and the
consensus map is shown in the center. Homologous loci are connected with solid lines. Putative stress-related markers are shown in red. Distorted loci
are indicated by asterisks (*0.01 <P < 0.05, ** P < 0.01; *** P < 0.001).
C26311S424 **
0.0
C25225S451
16.7
C11329S180 *
31.0
WGS189
42.1
C18576S293
66.1
C18603S149
79.3
C29080S200
91.7
C15741S475 ***
105.6
C14154S231
122.4
C22820S193 **
0.0
C26311S424 **
6.8
Amil2_010 *
14.4
C15891S454 ***
19.5
C8136S163 *
20.8
C59049S135
23.8
C25225S451
24.8
EST032
27.8
C6723S318
28.7
C12395S564
32.0
C15021S282 *
34.9
C70S236
35.3
C15238S417
38.7
C11329S180 *
40.3
C23525S293
40.9
C11670S169
42.8
WGS152
44.7
C21844S313 **
47.6
WGS189
51.2
C25713S318
52.6
C16442S295
54.7
C10924S223
59.1
C29432S370
61.8
C24388S705
63.0
C26140S243
66.2
C11439S315
70.5
C15985S312
70.6
C18576S293
72.6
C22761S360
75.4
EST121
76.6
C18603S149
79.5
C29080S200
90.1
C15741S475 ***
102.1
C14154S231
118.2
Amil2_010 *
0.0
C15891S454 ***
2.4
C59049S135
4.4
EST032
C6723S318
11.7
C12395S564
11.9
C70S236
15.2
C15238S417
17.4
C11670S169
21.7
WGS152
24.1
C21844S313 **
26.3
WGS189
27.9
C25713S318
32.3
C10924S223
39.8
C29432S370
42.1
C26140S243
45.7
EST121
56.7
C23978S544 *
0.0
C31340S160
10.3
C3255S483
19.0
C15113S204
29.7
C915S149
38.9
C10475S502
45.7
C15522S127 *
53.5
C1023S218
63.0
WGS134
72.6
C29463S468
82.1
C11520S633
94.1
C16774S791
99.3
C21914S231
112.9
C13394S333
142.8
C23978S544 *
0.0
C31340S160
11.3
C3255S483
20.2
C15113S204
30.7
C915S149
39.8
C16279S643
43.2
C10475S502
46.5
C19478S130
52.4
C20167S379
54.6
C288S173
56.9
C15522S127 *
58.7
C26478S226
66.1
C1023S218
70.2
C23950S250
74.2
C10005S217
75.3
WGS134
81.8
WGS205 *
84.7
C29463S468
86.4
C27026S472
91.4
C11520S633
92.6
C16774S791
95.3
C23085S183
98.6
C19533S241
100.8
C21914S231
106.8
C11535S517
108.7
C19178S536
116.6
C1114S124
119.7
C13394S333
130.2
C15415S232
133.9
C16634S406
134.2
C4134S257
142.0
C52394S280
144.4
C22526S224
148.7
C1379
161.5
C20167S379
0.0
WGS134
26.0
WGS205 *
31.7
C27026S472
38.7
C19533S241
47.8
C11535S517
55.7
C1114S124
68.2
C15415S232
84.2
C22526S224
100.3
C8085S432
0.0
EST122
12.5
C15286S686
22.1
C11076S81
33.7
C50281S478 *
50.9
C27337
57.5
WGS153 **
62.7
C12987S419
81.1
C23566S420
0.0
C26794S214
5.5
C45851S374
15.5
C15318S250
18.1
C49697S354
C19092S284
23.7
C8085S432
26.7
C19982S400
34.4
EST122
35.9
C27071S243
40.3
C17050S589
43.3
C15286S686
45.8
C24897S240
48.2
C20102S582
48.8
WGS145
49.3
C20479S292
53.1
C11463S192
55.9
C16449S173
58.0
C11076S81
59.6
C10050S780
67.2
C14161S301
72.7
C50281S478 *
73.2
C24813S193
73.5
C27337
78.7
WGS153 **
83.0
C14532S618
84.4
C23508S203
92.4
C12987S419
100.3
C26794S214
0.0
C45851S374
10.7
C49697S354
C19092S284
19.1
C19982S400
30.1
EST122
31.8
C27071S243
36.0
C20102S582
45.4
C16449S173
50.3
C10050S780
67.1
WGS153 *
74.6
C2348S700
0.0
C28447S501
1.2
C18084S286
9.8
C18442S324
13.5
C22464S266 *
18.6
C20407S208
21.2
C19470S311 *
23.7
C11715S299 *
27.2
C55647S531
32.8
C25725S230 *
37.2
C25677S330
43.3
C21253S536 ***
46.3
C12216S415
50.0
C17151S285
56.9
C12479S421
63.3
C969S127
67.9
C6250S141
68.2
C15011S233
71.3
C25187S178
75.3
C17471S281
84.7
C19916S128
90.2
C63883S448
99.8
C2348S700
0.0
C28447S501
1.1
C18084S286
9.4
C18442S324
13.0
C22162S248
17.2
C22464S266 *
18.6
C20407S208
20.6
C19470S311 *
23.3
C16549S511
24.5
C11715S299 *
27.5
C55647S531
32.5
C24321S173
35.3
C25725S230 *
37.8
C25677S330
43.6
C21253S536 ***
46.4
C12216S415
49.9
C43885S203
52.9
C17151S285
56.0
C12479S421
62.2
C969S127
67.7
C6250S141
68.1
C15011S233
73.0
C25187S178
76.8
C17471S281
85.2
C19916S128
92.1
C15269S273
92.8
C63883S448
101.1
L5-F L5 L5-M L6-F L6 L6-M
L7-F L7 L7-M L8-F L8
Genome Biology 2009, Volume 10, Issue 11, Article R126 Wang et al. R126.7
Genome Biology 2009, 10:R126
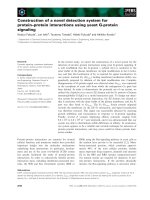
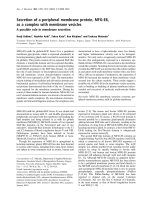
A genetic linkage map (L9 to L12) of the reef-building coral A. milleporaFigure 3
A genetic linkage map (L9 to L12) of the reef-building coral A. millepora. Female (F) and male (M) maps are shown on the left and right, respectively, and
the consensus map is shown in the center. Homologous loci are connected with solid lines. Putative stress-related markers are shown in red. Distorted
loci are indicated by asterisks (*0.01 <P < 0.05, ** P < 0.01; *** P < 0.001).
C26997S204
0.0
WGS112
8.5
WGS227
22.1
C14723S141
31.5
C14246S887
36.8
C9608S288
45.1
C16176S198 ***
68.0
C17475S294
0.0
C16716S153 *
4.8
WGS092
6.7
C49658S304
11.1
C14641S195
25.2
C17299S143
27.3
C26997S204
31.1
C63538S709
31.7
C20768S189
37.0
C16181S885
38.1
WGS112
38.6
C21135S139
49.2
WGS227
53.1
C16127S174
60.1
C14723S141
62.8
C14246S887
68.3
C25192S305
68.7
C22982S334
71.8
WGS217 **
74.9
C9608S288
76.4
C16176S198 ***
84.6
C17475S294
0.0
WGS092
2.0
C14641S195
19.3
C20768S189
33.0
WGS112 *
45.1
C22982S334
65.7
C12097S324
0.0
WGS101
13.3
C490S693
28.0
EST014
0.0
C13861S511
32.2
C12097S324
0.0
WGS101
13.1
C25351S196
15.2
WGS005
17.3
C490S693
29.5
C25688S405
29.8
EST014
35.4
C23210S557
41.5
C16458S418
45.4
C5145S66
46.7
C22489S363
52.4
C11638S270
53.6
C22100S336
56.6
C24238S242
60.3
C15774S399
68.3
C13861S511
69.3
C12550S536
82.1
C989S461
89.4
C25688S405
0.0
EST014
6.0
C23210S557
12.9
C5145S66
17.9
C24238S242
29.3
C15774S399
39.7
C14259S283
0.0
C18993S556
16.8
C19881S196
33.5
C1419S315 *
0.0
C12729S314
28.6
C14259S283
0.0
C16096S170
5.2
C12118S364 **
11.0
C16269S320
11.5
C18993S556
20.2
C49448S110
20.7
C14755S556
22.8
C1166 *
27.2
C55644S292
27.3
C30854S314
33.1
C19881S196
35.2
C15355S114 **
39.8
C1419S315 *
45.4
C16867S473
48.2
C986S247
49.6
C12677S188
58.5
C24058S463
63.8
C12729S314
67.0
C14755S556
0.0
C15355S114 **
16.7
C16867S473
25.6
C24058S463
45.0
C19560S178
0.0
C22182S205
8.7
C15150S931
15.0
C16136S488
19.0
Amil2_002
25.2
C25131S634 **
31.9
C1405S258
42.3
C52436S128 **
58.5
C23019S237
0.0
C19560S178
7.0
WGS107
11.3
C22182S205
15.7
C12219S331
16.0
C15150S931
21.7
C40003S97
23.7
C16136S488
26.0
C45133S676 *
29.4
Amil2_002
31.6
C22306S240
35.7
C25131S634 **
38.5
C50909S225
42.3
C2365S347
47.2
C1405S258
48.9
C6267S266
52.9
C52436S128 **
66.0
C23019S237
0.0
C12219S331
19.7
C45133S676 *
35.2
C2365S347
55.1
L9-F L9 L9-M L10-F L10 L10-M
L11-F L11 L11-M L12-F L12 L12-M
Genome Biology 2009, Volume 10, Issue 11, Article R126 Wang et al. R126.8
Genome Biology 2009, 10:R126
duce a large number of gene-associated SNPs from transcrip-
tome data obtained by 454 sequencing. Such gene-derived
SNPs are particularly useful for non-model organisms, since
they stand a better chance of identifying causal genes under-
lying complex traits in these organisms in the absence of
genome sequence data [12,13]. The criteria that we used for
SNP mining (at least 3× occurrence of the minority allele and
at least 6× read coverage) are more stringent than those typi-
cally used (2× occurrence of the minority allele, and 4× or 5×
read coverage) [11,31,32]. In our experience, the use of these
stringent criteria enhances the success rate of marker devel-
opment from 454 sequencing data.
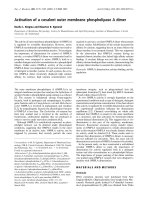
A genetic linkage map (L13 and L14) of the reef-building coral A. milleporaFigure 4
A genetic linkage map (L13 and L14) of the reef-building coral A. millepora. Female (F) and male (M) maps are shown on the left and right, respectively, and
the consensus map is shown in the center. Homologous loci are connected with solid lines. Distorted loci are indicated by asterisks (*0.01 <P < 0.05, ** P
< 0.01; *** P < 0.001).
C10890S256 *
0.0
WGS196
17.2
C23502S311
21.4
C26043S200 *
22.1
C11040S312
37.9
C23126S678
48.8
C10890S256 *
0.0
WGS196
1.7
C24140S397
2.9
C26275S382 **
14.9
C23502S311
18.9
C24582S267 **
20.9
C26043S200 *
22.1
C25568S279
23.4
C13315S616
29.8
C19552S147
31.4
C11040S312
35.4
C16499S363
37.0
C12260S193 *
44.1
C23126S678
46.0
WGS196
0.0
C26275S382 **
16.3
C25568S279
25.4
C13315S616
32.3
C16499S363
39.5
C12260S193 *
48.5
C1723S422
0.0
Amil2_022
15.4
C22110S143
29.0
C25285S214
41.3
C16637S215
44.4
C22687S231
53.4
C13965S176
61.1
C19502S541
63.7
C19168S356
68.4
C294S372
76.1
C21164S307
80.0
C17723S124
95.2
C1723S422
0.0
Amil2_022
18.3
C22110S143
33.1
C16637S215
57.4
C22687S231
74.5
C19168S356
89.9
C294S372
99.8
L13-F L13 L13-M L14 L14-M
Table 3
Synteny blocks between A. millepora and other eukaryotic genomes and their significance
All synteny blocks Significant blocks
Comparison Blocks (n) Markers per block Overall significance Blocks (n) Markers per block
Saccharomyces cerevisiae 00 1 00
Homo sapiens 43-6 0.0021 6
Nematostella vectensis 63-6 < 0.0011 6
Caenorhabditis elegans 12 3-10 0.392 1 10
Drosophila melanogaster 13 3-10 0.679 2 9-10
Trichoplax adhaerens 13 3-12 0.002 2 12
Overview of synteny blocks identified by comparisons between the genetic map of A. millepora and other eukaryotic genome sequences, with
permutation tests to evaluate significance of synteny blocks. Probabilities were based on permutation tests, as described in Materials and methods.
The P-value reported for overall significance reflects the likelihood that the observed number of conserved synteny blocks would be expected by
random chance. Significance of synteny block sizes was based on the likelihood that a block containing at least that many markers would be expected
by chance.
Genome Biology 2009, Volume 10, Issue 11, Article R126 Wang et al. R126.9
Genome Biology 2009, 10:R126
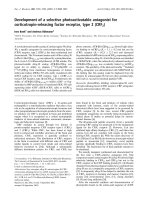
Conserved synteny blocksFigure 5
Conserved synteny blocks. Each synteny block represents a set of mapped coral markers and their best matches in another metazoan genome. Synteny
blocks were defined as groups of at least three markers, each of which was ≤10 cM from its nearest neighbor within a linkage group in the coral map, and
for which the best matches in another genome were also each ≤10 Mb from their nearest neighbors in the same chromosome or scaffold. All blocks
shown here contain more markers than expected from chance (P < 0.05) based on permutation analysis (n = 1,000). For each block, the coral linkage
group is shown as a white horizontal bar, with syntenic marker positions (in cM) indicated on the bar. For each linkage group containing a synteny block,
each comparison with the other genome is shown as a horizontal grey bar, with marker positions (in Mb) indicated on the bar. Relationships between
coral markers and other genomes, based on sequence similarity (tblastx, bit-score ≥50), are indicated by diagonal lines connecting each coral marker with
its best match.
LG1
0.6 Mb 27.3 Mb
||||||||||
1 cM
95 cM
|||| |||| ||
LG2
1.9 Mb 15.8 Mb
||||| ||||
2 Mb 11.1 Mb
|||||| | |||||
1 cM 114 cM
|| ||||| | ||| | | || | | || | |
LG4
0.7 Mb 2.8 Mb
||||| |
5.6 Mb 0.6 Mb
||||||||||||
1 cM 141 cM
|| |||||| | | | | | | | | | |
LG5
6 Mb
14.7 Mb
||||||||||
49.9 Mb
77.1 Mb
||||||
1 cM
118 cM
|| || | ||| | |||| || |
Drosophila melanogaster Ch3R
Drosophila melanogaster Ch3L
Trichoplax adhaerens Sc1
Nematostella vectensis Sc2
Trichoplax adhaerens Sc5
Homo sapiens Ch14
Caenorhabditis elegans Ch5
Genome Biology 2009, Volume 10, Issue 11, Article R126 Wang et al. R126.10
Genome Biology 2009, 10:R126
SNP genotyping via high resolution melting analysis
Among the methods available for high-throughput SNP gen-
otyping, the simple, fast and cost-effective HRM method is
especially suitable for non-model organisms. The original
HRM method requires one fluorescently labeled probe for
each assay [34,35]. Later, this method was simplified by using
an unlabeled probe in the fluorescent dye solution, but the 3'
end of the probe still required costly chemical modification to
prevent extension of the probe [36,37]. In this study, we fur-
ther decrease HRM genotyping cost simply by adding two
mismatched bases to the 3' end of an unlabeled probe instead
of chemical modification.
SNP marker transferability between populations
Transferability of the assays to different populations is argu-
ably the most important problem that may arise when trying
to apply SNP markers to broad-scale population studies. The
markers developed for one population may turn out to be
appreciably polymorphic only in populations well connected
to the original one, while being essentially homozygous in
other, more isolated populations. The degree of connectivity
between A. millepora populations between three reefs in the
Great Barrier Reef (representing northern, middle, and
southern regions) has been previously evaluated using alloz-
yme markers [38]. Similar to nearly all coral species in that
analysis, A. millepora demonstrated genetic subdivision
among sampled sites (high F
st
values), although not without
some connectivity (an estimated 5 to 30 exchanged migrants
per generation). Oliver and Palumbi [39], on the other hand,
detected strong barriers to connectivity over longer spatial
scales (across Pacific archipelagoes) in two closely related
species, A. cytherea and Acropora hyacinthus, using several
intron- and mitochondrial DNA-derived markers that were
developed for phylogeography applications. The study of the
natural genotypic diversity and connectivity between A.
millepora populations is of great interest for understanding
the evolutionary responses of reef-building corals to ongoing
climate change, and is among our high-priority research
areas for the future. This emphasizes the importance of deter-
mining whether our SNP markers are polymorphic in other
populations, or mostly represent 'private alleles' specific to
the Magnetic Island (and perhaps even more specifically,
Nelly Bay) population. Fortunately, in our interpopulation
transferability test, most (65 to 75%) of the SNP markers we
tested were polymorphic in just seven A. millepora colonies
from Orpheus Island and Great Keppel Island, which are 80
km and 570 km away from Magnetic Island, respectively.
Although this result suggests that the detected SNPs repre-
sent relatively common alleles in these populations, the dis-
tance between these populations is just a fraction of what was
assayed in the Ayre and Hughes study [38], and so it remains
to be seen how far this allele sharing extends. Still, this result
is quite promising and suggests the potential for application
of these SNP markers to inter-population studies of local
adaptation in A. millepora.
Mapping population
For animals and plants with short generation times, very effi-
cient mapping populations (second generation (F
2
), back-
cross, recombinant inbred lines, double haploid, and so on)
can be generated from the crosses among homozygous pater-
nal strains or recombinant inbred lines, which usually
requires multiple generations of sib-mating or self-fertiliza-
tion. Despite several advantages of those methods, it would be
very difficult, if not impossible, to produce such mapping
populations in corals because most corals have long genera-
tion times (approximately 5 to 10 years in some corals, and 3
to 5 years in most acroporids), and the adult colonies are
rather difficult to maintain. Last but not least, to our knowl-
edge, synchronized coral mass spawning, an essential
requirement for making genetic crosses, has never been rec-
reated in laboratory-raised corals. In short, corals make poor
laboratory models; however, this does not diminish the value
of ecological and evolutionary questions pertaining to these
organisms. Fortunately, previous studies have shown that A.
millepora, like many other corals, is a highly heterozygous
species [8,9]. Because of this, an outbred full-sib family would
be a suitable mapping population for constructing a linkage
map [40-45]. Although marker configurations are more com-
plicated in such a family, they can be deduced after analyzing
the parental origin and genetic segregation of the markers in
the progeny (for a review, see [46]). In particular, coral larvae
offer several key advantages over adult colonies for linkage
mapping in that they are easy to obtain in great numbers, and,
in this species, they do not contain algal symbionts, which
would be a potential source of DNA contamination.
Map density and recombination rate
In the consensus map, marker density is dramatically varia-
ble across linkage groups, indicating that the protein-coding
genes in A. millepora, like in human [47], are distributed very
unevenly among chromosomes. This also suggests that
including anonymous genetic makers into the current map
will likely increase marker density in less populated linkage
groups. The current genetic map covers 93% of the A. mille-
pora genome and has a resolution of 3.4 cM, which should be
sufficient for QTL mapping [48,49]. The average recombina-
tion rate across all linkage groups is approximately 7.5 cM/
Mb in A. millepora, which is much higher than human (1.20
cM/Mb [50]), mouse (0.5 cM/Mb [50]), D. melanogaster (2
cM/Mb [51]), and even the plant Arabidopsis thaliana (5 cM/
Mb; calculated based on data from The Arabidopsis Informa-
tion Resource website [52]). This suggests that QTLs, if iden-
tified, can be narrowed down to rather small genomic regions
in this coral species. Nine putative stress-related genes were
mapped in the consensus map (markers colored red in Fig-
ures 1, 2 and 3), and it would be interesting to see whether any
of these are highlighted in future QTL mapping of adaptive
physiology traits, such as heat tolerance. Moreover, SNPs in
these genes might also prove useful for the study of allele-spe-
cific gene expression [53]. Last but not least, the high-resolu-
tion genetic linkage map would be invaluable for assembling
Genome Biology 2009, Volume 10, Issue 11, Article R126 Wang et al. R126.11
Genome Biology 2009, 10:R126
the A. millepora genome, the sequencing of which is immi-
nent (DJ Miller, personal communication).
Gamete-specific recombination rates
Differential recombination rates between sexes are wide-
spread in animals and plants, with females often having more
recombination and longer genetic maps than males [54]. Sim-
ilar observations have also been reported in hermaphrodites,
with greater recombination in female than male gametic tis-
sue [41,55,56]. The underlying mechanism remains the sub-
ject of much debate, although several models have been
proposed (for a review, see [57]). In this study, the length of
the female map is 30% longer than that of the male map, sug-
gesting that sex difference in recombination does exist in A.
millepora. However, this difference seems attributable to
only a few (that is, L4, L5, L6, L10 and L11), but not all, link-
age groups. The 'haploid selection' model proposed by recent
studies [58,59] seems to be the most plausible explanation for
our observation. In the 'haploid selection' theory, sex differ-
ences in recombination result from a male-female difference
in gametic selection. In coral Acropora spp., like in most ani-
mals, there is no female haploid phase, because meiosis is
completed only after fertilization [60]. Since some genes (for
example, genes responsible for meiotic drive systems) are
expressed and under selection during the male haploid phase
[61,62], this would tend to reduce recombination in males. If
such genes were located in only a few chromosomes, this
would be expected to reduce the amount of recombination
observed in those chromosomes.
Haploid selection might also explain the low polymorphism
level of linkage group 8 in the male parent. Because the male
parent was genotyped based on the sperm sample, it is possi-
ble that genotypes of some loci inferred from sperm mixtures
are different from genotypes of adult tissues if these loci are
subject to haploid selection. The significant low polymor-
phism level in L8 of the male parent may reflect strong hap-
loid selection (for example, one of the homologous
chromosomes corresponding to L8 might produce functional
sperm, while the other might contain deleterious alleles that
would produce non-functional sperm). Direct validation of
this hypothesis would require tissue samples from the male
parent, which are not available. However, the finding that
more than half of annotated genes in L8 have putative roles in
sexual reproduction supports the idea that this linkage group
may be a target for haploid selection.
Synteny analysis and permutation tests
Synteny is defined as consistent linkage between certain
genes across species. In the most general case, the definition
does not require conservation of gene order or orientation.
Previous comparative genomics studies have revealed syn-
teny between distantly related metazoan taxa [63,64]. Most
studies of genome evolution in animals have focused on bila-
terian taxa for which extensive genomic resources are availa-
ble [16,65-67]. More recently, the draft assemblies of the sea
anemone and placozoan genomes have revealed substantial
synteny between more distantly related metazoan taxa
[68,69]. Our development of a genetic map for coral, which,
to our knowledge, constitutes the first genetic map for a non-
bilaterian metazoan, reveals the conservation of genomic
organization among distantly related animal taxa.
As the simplest free-living animals, placozoans represent a
primitive metazoan form. A recent comprehensive phyloge-
netic study suggests that Placozoa are basal relative to all
other non-Bilaterian animals ([70], but see [71]). Whole
genome analysis of placozoan T. adhaerens shows that the
placozoan genome has the lowest amount of local rearrange-
ment relative to the common placozoan-cnidarian-bilaterian
ancestor [69]. Previous comparative genome analysis
revealed synteny blocks shared between placozoan and
human genomes, which likely reflect ancestral features of the
metazoan genome. In our study, we also found extensive syn-
teny between coral and placozoan genomes (despite the
incomplete assembly of the placozoan genome), suggesting
that the coral genome also preserves many features of ances-
tral genome organization.
Our preliminary synteny analysis identified numerous syn-
teny blocks in each comparison between the coral map and
other metazoan genomes. However, because of the number
and positions of markers and their matching sequences
within the two genomes, a substantial number of synteny
blocks could be expected to arise by chance. Several methods
to test for significant evidence of synteny between two
genomes, based on randomly shuffled permutations of the
real data, have been previously described [72-75]. The exist-
ing implementations of these methods are not well suited for
our data (comparison of genetic maps and genome sequences
across distantly related taxa), but are more applicable to com-
parative genome analysis of closely related species [19],
because they require marker colinearity (that is, conserved
marker order), and/or assume chromosome homology
between chromosomes in comparison (for example, rand-
omize markers only within a chromosome to evaluate signifi-
cance of identified synteny). We followed a similar approach
for our analysis, by randomly shuffling marker positions
across the entire map and evaluating the likelihood that the
number of synteny blocks, and the number of markers in each
block, could have arisen by chance.
Without any statistical tests, a simple analysis of synteny
could be easily misinterpreted; for example, the large number
of synteny blocks found in comparisons between the coral
map and the worm and fly genomes (12 to 13 blocks in each
comparison, with 3 to 10 markers per block) might suggest
that the coral genome shared more structural similarities
with worm and fly than with other animal genomes. However,
permutation tests revealed that, in fact, neither of those com-
parisons found more synteny blocks than expected by chance
(Table 3). There are several characteristics of genomic struc-
Genome Biology 2009, Volume 10, Issue 11, Article R126 Wang et al. R126.12
Genome Biology 2009, 10:R126
ture that would obviously be expected to affect the detection
of synteny blocks by our criteria, including genome size, chro-
mosome numbers, and the completeness of the assembly.
Because the genomes considered in this study differed widely
in these characteristics, this posed an important caveat for
any conclusions drawn from these comparisons. Importantly,
each of the comparisons between the coral map and another
metazoan genome included at least one block that was signif-
icantly larger than expected by chance, based on permutation
tests of block size (the number of markers within each block).
Maintenance of synteny across great evolutionary
distances
If not maintained by natural selection, synteny would be
expected to break down between distantly related taxa. One
obvious factor that would affect this is the rate of genome
rearrangement. Recent studies have shown that rates of chro-
mosomal rearrangement are much higher in invertebrates
than vertebrates [76-78]. For example, the rearrangement
rates of Drosophila and Caenorhabditis are 350 to 850 and
1,400 to 17,000 times higher than those of mammals, respec-
tively [77]. Our finding that the coral map and the worm and
fly genomes share very little conserved synteny is consistent
with these previous reports. Still, the worm and fly genomes
do contain a small number (one and two, respectively) of syn-
teny blocks (each including nine to ten genes), and these are
significantly larger than expected by chance (Table 3).
In general, eukaryotic genomes evolve by random micro- and
macro-rearrangements such as indels, inversions and trans-
locations [79]. Nevertheless, gene distribution in eukaryotic
genomes is not random [80]. Several hypotheses have been
put forward to explain synteny. Early research in genomic
evolution and synteny assumed no selection for synteny, and
suggested that synteny resulted from ancestral linkage groups
that had not yet been disrupted by random chromosomal
rearrangements [81]. The subsequent discovery that certain
groups of co-regulated genes showed strict conservation of
both gene order and linkage across taxa [82] refined this
model by demonstrating that the co-regulation of a group of
genes by local regulatory elements can drive conservation of
synteny blocks containing those genes and their correspond-
ing regulatory elements [83]. Recent studies have suggested
an additional mechanism driving the conservation of syn-
teny: the interdigitation of regulatory elements and their tar-
get genes by other genes with unrelated functions and
regulatory pathways [84,85].
None of those proposed mechanisms provides a clear expla-
nation for our findings. Several metazoan genomes showed
more synteny blocks than expected by chance, but the gene
functions suggested by sequence similarity for these syntenic
markers were not linked in any obvious way. For example, the
map includes one pair of genes that is linked in three species:
LG5 of coral, chromosome 5 of worm, and chromosome 14 of
human ([GenBank:EZ001917
] and [GenBank:EZ012107];
Additional data file 1). There is no clear functional relation-
ship between the genes associated with these markers (serine
palmitoyltransferase 2, and enhancer of rudimentary
homolog). Obviously this does not preclude the possibility of
unknown functional relationships among the mapped genes,
or of functional relationships between the other genes not
included in the coral map. The list of syntenic markers asso-
ciated with known genes also did not include any known
examples of co-regulated genes (Additional data file 1). The
identification of synteny blocks from the coral genetic map
therefore provides no support for either explanation, but
raises a number of interesting questions. Synteny blocks were
distributed differently among taxa; for example, both fly and
placozoan genomes showed conserved synteny with regions
of LG2, but only the placozoan genome did with LG4 (Figure
5). The extent to which these differences are explained by
selective pressures versus rates of genome rearrangements
(for example, [77]) is not clear from our data, but this will
probably become a more tractable question as genome
sequences become available for a broader sampling of meta-
zoan taxa. The extensive rearrangements evident within syn-
teny blocks in the coral map (Figure 5) prompt questions
about what mechanisms might account for conserved linkage
but highly variable order. We speculate that selection might
promote linkage between genes that must be modified in a
correlated fashion to achieve an adaptive advantage (in other
words, exhibit epistatic interactions). Linkage between epi-
statically interacting loci would allow for selection to operate
on haplotypes rather than individual alleles [86], which
would substantially improve the heritability of the evolving
trait and hence the efficiency of selection. There are several
pan-metazoan systems that can be viewed in terms of many
correlated (or anti-correlated) traits determined by genes
with otherwise unrelated functions. Examples include epithe-
lial functions (rigidity, across-epithelial transport, along-epi-
thelial connectivity, cuticle secretion, ciliation), cell-cell
communication and nutrient exchange, and organism-wide
transport and excretion. Future comparative analysis of
genome sequence and function in the basal metazoans like A.
millepora may help to elucidate the evolutionary origin of the
pan-metazoan synteny.
Conclusions
A genetic linkage map, predominantly based on SNP markers
derived from the transcriptome, has been constructed for a
reef-building coral, Acropora millepora. This map has ample
resolution for QTL analysis (3.4 cM) and represents the first
linkage map for a coral, as well as for any non-bilaterian mul-
ticellular organism. The map will become the foundation for
QTL analysis of adaptive traits and population genomics in
the coral, to address the problem of coral evolution response
to climate change, as well as for coral genome assembly. Com-
parative genomic analysis based on this map revealed a few
statistically significant synteny blocks, which may reflect the
features of ancestral metazoan genome organization. The
Genome Biology 2009, Volume 10, Issue 11, Article R126 Wang et al. R126.13
Genome Biology 2009, 10:R126
specific mechanisms underlying such preservation are not yet
clear, but represent an exciting area for future studies.
Materials and methods
Coral mapping family
A full-sibling family was established by crossing of two colo-
nies of A. millepora, which were collected at Magnetic Island,
Queensland, Australia, in 2007. One of the colonies served as
a male parent (that is, only contributed sperm to the cross),
while the other contributed eggs and served as a female par-
ent. The procedures of fertilization and larval culture are
described in [11]. In an effort to use the same material for
expression QTL mapping of heat tolerance in future, larvae
were reared at an elevated temperature of 32°C rather than a
standard culturing temperature (for example, 28°C). Parental
sperm and 5-day post-fertilization larvae were preserved in
pure ethanol and RNALater (Ambion, Foster City, CA, USA),
respectively, for genotyping. In total, 80 larvae were used for
linkage mapping analysis.
DNA extraction and whole-genome amplification
Parental DNA was extracted from the preserved sperm using
DNeasy Blood & Tissue kit (Qiagen, Valencia, CA, USA). We
have developed a protocol for parallel extraction of DNA and
RNA from single coral larva. Each larva was incubated at
room temperature in 100 μl lysis solution from the RNAque-
ous kit (Ambion, Foster City, CA, USA) for 10 minutes and
then centrifuged at 16,000 G for 5 minutes. Supernatant was
transferred for total mRNA extraction using the RNAqueous-
Micro kit (Ambion, Austin, TX, USA). The remaining pellet of
cell debris was washed with 100 μl 1× phosphate-buffered
saline, which was discarded after centrifuging at 16,000 G for
2 minutes, and then digested in 100 μl digest buffer (100 mM
NaCl, 10 mM Tris-Cl (pH 8.0), 25 mM EDTA (pH 8.0), 0.5%
SDS and 0.1 mg/ml proteinase K) at 42°C for 2.5 hours. After
digestion, the solution was centrifuged at 4,000 G for 2 min-
utes, and supernatant was transferred into a new tube. Then
80 μl 100% isopropanol was added to the supernatant in
order to precipitate larval DNA. The solution was held at -
20°C for 30 minutes and then centrifuged at 4°C for 20 min-
utes at 16,000 G. The resulting DNA pellet was washed using
200 μl of 40% isopropanol, which was discarded after centri-
fuging at 4°C for 5 minutes at 16,000 G. After air-drying the
pellets, DNA was dissolved in 15 μl elution buffer (Qiagen).
To make sufficient DNA templates for several hundred PCR
amplifications, we used the REPLI-g Mini kit (Qiagen) for
whole-genome amplification of larval DNA samples. For each
larva, approximately 10 ng larval DNA was used as input DNA
for whole-genome amplification. The REPLI-g Mini kit uti-
lizes a Phi29 DNA polymerase-based multiple displacement
amplification technique, which can produce high fidelity and
near-complete genome representation suitable for high reso-
lution SNP genotyping [87-89].
Microsatellite genotyping
Fifty microsatellite markers were genotyped in this study, of
which 40 were developed by our group [8] and 10 were from
[9]. For each marker, one of the two primers used was fluores-
cently labeled with 6-carboxyfluorescein or hexachlorofluo-
rescein. PCR amplification and fragment analysis by capillary
electrophoresis followed the same procedure as described in
[8].
SNP marker development, genotyping and inter-
populationtransferability
More than 33,000 candidate SNPs were previously identified
in the A. millepora larval transcriptome by sequence analysis
[11]. Of these, 1033 were selected for marker development
using the criteria of at least 3× occurrence of the minority
allele and at least 6× read coverage. Most of the SNP markers
were named as follows: C followed by several numbers refers
to a CAP3-assembled contig number, and then S followed by
several numbers refers to the SNP position (bp) in this contig.
In addition, four SNP markers were developed from introns,
so they were named only by the contig number. We have
developed a cost-effective method for SNP genotyping using
the HRM capability of the Roche (Indianapolis, IN, USA)
LightCycler 480. For one SNP assay, three unmodified oligo-
nucleotides were used, which corresponded to two PCR prim-
ers and one probe. Each SNP locus was first amplified by an
asymmetrical PCR (1:5 in primer concentration) with HRM
fluorescent dye in the PCR master mix and was then interro-
gated by an unlabeled probe with two mismatched bases at its
3' end. Primers were designed based on several principles as
described in [90] so that all PCR amplifications could be
achieved at the same annealing temperature. In an effort to
decrease the chance of amplifying introns, the expected
amplicon lengths were usually restricted to about 100 bp.
Probes were designed according to the following rules: T
m
of
approximately 60°C; probe length between 20 and 35 bases;
SNP sites located near the middle of each probe to maximize
the instability with a mismatched variant; and two mis-
matched bases added to the 3' end of each probe to prevent
extension. PCR amplifications were performed in 384-well
plates in a 15-μl volume composed of approximately 20 ng
amplified genomic DNA, 0.1 μM forward primer, 0.5 μM
reverse primer, 2 mM MgCl
2
, and 1× HRM Master Mix
(Roche) in the Roche LightCycler 480 instrument. All cycling
began with an initial denaturation at 95°C for 10 minutes, fol-
lowed by 65 cycles of 95°C for 40 s, 60°C for 40 s, and 72°C
for 40 s. For primer testing, 1 μl of PCR product was run on a
1.5% agarose gel to determine the success of the PCR. After
PCR amplification, an aliquot of the appropriate probe was
added in each reaction to a final concentration of 5 μM. HRM
genotyping was performed on the Roche LightCycler 480
instrument with an initial denaturation at 95°C for 1 minute,
cooling at a rate of 2.5°C/s to 40°C with a 1-minute hold, and
then continuous melting curve acquisition (25 acquisitions
per °C) during a 0.02°C/s ramp to 95°C. Data were retrieved
and analyzed using the LightCycler 480 Software 1.5, with
Genome Biology 2009, Volume 10, Issue 11, Article R126 Wang et al. R126.14
Genome Biology 2009, 10:R126
manual curation of genotype calls. The primer and probe
sequences for all mapped markers are available in Additional
data file 1. To evaluate the inter-population transferability of
our SNP markers, seven A. millepora colonies were tested
using 48 randomly chosen SNP markers, of which four came
from the Orpheus Island and three from the Great Keppel
Island, which are 80 km (NNW) and 570 km (SSE) away from
Magnetic Island, respectively.
Linkage analysis
Linkage analysis was carried out using JoinMap 4.0 software
[23]. Genotype configurations of markers were categorized
into four types with null-allele allowed: 1:1:1:1 type (female ×
male: AB × CD or AB × AC), 1:2:1 type (AB × AB), 1:1 female
type (AB × AA or CC), and 1:1 male type (AA or CC × AB). For
all segregating loci, goodness-of-fit of the observed with
expected Mendelian ratios were assessed with chi-square test.
A LOD score of 4.5 was initially set as the linkage threshold
for grouping markers. Once 14 linkage groups corresponding
to the known haploid chromosome number for this species
were determined, the rest of the markers were added to their
corresponding groups using a less stringent criterion of LOD
≥2.5. Sex-specific maps were first constructed for each parent
using the two-way pseudo-testcross strategy [24]. Maternal
(1:1 female type) and paternal (1:1 male type) datasets were
created using the function of 'Create Maternal and Paternal
Population Nodes' in the JoinMap program, which also parti-
tioned 1:1:1:1-type data into 1:1 female- and 1:1 male-type
data, but ignored 1:2:1-type data. The JoinMap program uses
G
2
statistic for independence test. The power of this statistic
in determining marker linkage is not influenced by segrega-
tion distortion [23,46]. The regression mapping algorithm
was used for map construction, which is a procedure of build-
ing a map by adding loci one by one when starting from the
most informative pair of loci [91]. The best fitting position of
an added marker was searched on the basis of goodness-of-fit
test for the resulting map. To prevent being trapped in a local
optimum of the goodness-of-fit, 'ripple' was performed each
time after adding one locus. The Kosambi mapping function
[92] was used to convert the recombination frequencies into
map distance (centiMorgans). Once the female and male
maps were established, a consensus map was constructed
using markers with all genotype configurations (the 'CP' pop-
ulation model). Marker orders in the female and male maps
were used as preferred orders (the 'fixed orders' function) in
the consensus map construction. MapChart 2.2 software [93]
was used for graphical visualization of the linkage groups.
Map length and coverage
On the basis of the consensus map, we used two methods to
calculate estimated genome length. The first estimator (G
e1
)
was calculated by adding 2s to the length of each linkage
group to account for chromosome ends [27], where s is the
average spacing between markers, which was calculated by
dividing the total length of all linkage groups by the number
of intervals (number of markers minus number of linkage
groups). The second estimator (G
e2
) was calculated by multi-
plying the length of each linkage group by (m + 1)/(m - 1)
[28], where m is the number of markers in that linkage group.
Genome coverage was estimated by G
o
/G
e
, where G
o
is the
observed genome length and G
e
is the average of G
e1
and G
e2
.
Comparative genome analysis
To enable sequence-based comparisons between the coral
genetic map and other eukaryote genomes, we associated
each of the markers mapped in this study with a previously
annotated cDNA sequence from the coral transcriptome [11].
The annotated sequence corresponding to each marker-con-
taining contig was identified by blastn, with a significance
threshold of bit-scores ≥100. Bit-scores were used instead of
e-values because of the effects of the small database size on e-
values. The markers that matched annotated genes [11] were
assigned gene names based on those annotations. The
mapped cDNA sequences identified by this process were
longer (average = 1,232 bp) than the working CAP3-derived
contigs from which the markers were identified (average = 711
bp), and these longer sequences were used for all subsequent
comparisons between the coral genetic map and genomic
sequences from other organisms.
Mapped coral sequences were compared with other eukaryo-
tic genomes using tblastx (bit-scores ≥50) to identify regions
of synteny (the conserved linkage of genes in different
genomes). This analysis included high-quality assemblies for
three bilaterian animals: release 4 of the human reference
genome assembly, release 5.17 for D. melanogaster, and
release WS202 for C. elegans. Draft assemblies for two non-
bilaterian animals were included to provide a broader taxo-
nomic comparison: assembly 1.0 for the cnidarian N. vecten-
sis and assembly 1.0 for the placozoan T. adhaerens. The
reference yeast genome assembly of S. cerevisiae was also
included as a representative non-metazoan eukaryote.
Synteny blocks conserved between the genomes of coral and
other animals were identified based on the position of each
mapped coral sequence within a linkage group, and the posi-
tion of its best match in the other genome. For each pairwise
comparison (tblastx) between mapped coral sequences and
the other species' genome sequences, we identified synteny
blocks based on the following operational criteria. First,
blocks were required to contain three or more markers within
a single linkage group in the coral map, and those markers
had to match three regions within a single chromosome or
scaffold in the other genome. Second, the nearest neighbor
for each marker within the coral map had to be within ≤10 cM.
Third, the nearest neighbor for each of the matches in the
other genome had to be within ≤10 Mb. Application of these
criteria identified numerous blocks of genes that showed con-
served linkage across genomes, including blocks with sub-
stantial intra-chromosomal rearrangements.
Genome Biology 2009, Volume 10, Issue 11, Article R126 Wang et al. R126.15
Genome Biology 2009, 10:R126
We used permutation tests to evaluate the significance of the
observed synteny. First, marker labels and positions in the
coral map were shuffled for each permutation (n = 1,000),
using the shuffle subroutine of the List::Util module in Perl.
Within each randomly shuffled dataset, the number of syn-
teny blocks and the numbers of markers in each block that
emerged by chance were tabulated. The probability that the
observed synteny blocks (that is, in the original, non-shuffled
data) resulted from random chance was calculated from the
percentage of shuffled datasets that produced at least as many
synteny blocks as the original data. This provided an estimate
for the significance of each between-genome comparison.
These permutations also allowed us to estimate the signifi-
cance of particular block sizes within each comparison (for
example, to evaluate the probability that a block of ten mark-
ers with conserved linkage resulted from random chance).
For each block size within a particular comparison, based on
the number of markers included in that block, we calculated
the probability that a block that large would emerge by ran-
dom chance based on the percentage of blocks that large or
larger in the randomly shuffled datasets. This provided an
estimate for the significance of each block size within each
comparison.
Abbreviations
HRM: high-resolution melting; LOD: logarithm of the odds;
QTL: quantitative trait locus; SNP: single nucleotide poly-
morphism.
Competing interests
The authors declare that they have no competing interests.
Authors' contributions
MVM conceived the study. EM and MVM performed the cross
and larval rearing. SW and LZ conducted DNA preparation,
SNP and microsatellite genotyping, and linkage analysis. EM
conducted comparative genome analysis. SW, EM and MVM
drafted the manuscript. All authors read and approved the
final manuscript.
Additional data files
The following additional data are available with the online
version of this article: an Excel table containing detailed
information of mapped SNP markers (primer and probe
sequences, gene annotation and synteny) (Additional data file
1).
Additional data file 1Detailed information of mapped SNP markers (primer and probe sequences, gene annotation, and synteny)Detailed information of mapped SNP markers (primer and probe sequences, gene annotation, and synteny).Click here for file
Acknowledgements
We thank Carly Kenkel (University of Texas at Austin) for assistance in
SNP marker development. We also thank two anonymous reviewers for
their valuable comments on this paper.
References
1. Foret S, Kassahn KS, Grasso LC, Hayward DC, Iguchi A, Ball EE, Miller
DJ: Genomic and microarray approaches to coral reef con-
servation biology. Coral Reefs 2007, 26:475-486.
2. Schwarz JA, Brokstein PB, Voolstra C, Terry AY, Miller DJ, Szmant
AM, Coffroth MA, Medina M: Coral life history and symbiosis:
functional genomic resources for two reef building Carib-
bean corals, Acropora palmate and Montastraea faveolata.
BMC Genomics 2008, 9:97.
3. Bay LK, Ulstrup KE, Nielsen HB, Jarmer H, Goffard N, Willis BL,
Miller DJ, van Oppen MJH: Microarray analysis reveals tran-
scriptional plasticity in the reef building coral Acropora mille-
pora. Mol Ecol 2009, 18:3062-3075.
4. Meyer E, Davies S, Wang S, Willis BL, Abrego D, Juenger TE, Matz
MV: Genetic variation in responses to settlement cue and
elevated temperature in a reef-building coral Acropora mille-
pora. Mar Ecol Prog Ser in press.
5. Rockman MV, Kruglyak L: Genetics of global gene expression.
Nat Rev Genet 2006, 7:862-872.
6. Gilad Y, Rifkin SA, Pritchard JK: Revealing the architecture of
gene regulation: the promise of eQTL studies. Trends Genet
2008, 24:408-415.
7. Kenyon JC: Models of reticulate evolution in the coral genus
Acropora based on chromosome numbers: parallels with
plants. Evolution 1997, 51:756-767.
8. Wang S, Zhang L, Matz M: Microsatellite characterization and
marker development from public EST and WGS databases
in the reef-building coral Acropora millepora (Cnidaria,
Anthozoa, Scleractinia). J Hered 2009, 100:329-337.
9. Van Oppen MJH, Underwood JN, Muirhead AN, Peplow L: Ten mic-
rosatellites loci for the reef-building coral Acropora millepora
(Cnidaria, Scleractinia) from the Great Barrier Reef, Aus-
tralia. Mol Ecol Notes 2007, 7:436-438.
10. Stinchcombe JR, Hoekstra HE: Combining population genomics
and quantitative genetics: finding the genes underlying eco-
logically important traits. Heredity 2008,
100:158-170.
11. Meyer E, Aglyamova GV, Wang S, Buchanan-Carter J, Abrego D, Col-
bourne JK, Willis BL, Matz MV: Sequencing and de novo analysis
of a coral larval transcriptome using 454 GS-Flx. BMC Genom-
ics 2009, 10:219.
12. Tsumura Y, Kado T, Takahashi T, Tani N, Ujino-Ihara T, Iwata H:
Genome scan to detect genetic structure and adaptive genes
of natural populations of Cryptomeria japonica. Genetics 2007,
176:2393-2403.
13. Namroud MC, Beaulieu J, Juge N, Laroche J, Bousquet J: Scanning
the genome for gene single nucleotide polymorphisms
involved in adaptive population differentiation in white
spruce. Mol Ecol 2008, 17:3599-3613.
14. Hillier LW, Miller RD, Baird SE, Chinwalla A, Fulton LA, Koboldt DC,
Waterston RH: Comparison of C. elegans and C. briggsae
genome sequences reveals extensive conservation of chro-
mosome organization and synteny. PLoS Biol 2007, 5:e167.
15. Kukekova AV, Trut LN, Oskina IN, Johnson JL, Temnykh SV, Khar-
lamova AV, Shepeleva DV, Gulievich RG, Shikhevich SG, Graphodat-
sky AS, Aguirre GD, Acland GM: A meiotic linkage map of the
silver fox, aligned and compared to the canine genome.
Genome Res 2007, 17:387-399.
16. Gross JB, Protas M, Conrad M, Scheid PE, Vidal O, Jeffery WR,
Borowsky R, Tabin CJ: Synteny and candidate gene prediction
using an anchored linkage map of Astyanax mexicanus. Proc
Natl Acad Sci USA 2008, 105:20106-20111.
17. Beldade P, Saenko SV, Pul N, Long AD: A gene-based linkage map
for Bicyclus anynana butterflies allows for a comprehensive
analysis of synteny with the Lepidopteran reference
genome. PLoS Genet 2009, 5:e1000366.
18. Jaari S, Li M-H, Merila J: A first-generation microsatellite-based
genetic linkage map of the Siberian jay (Perisoreus infaustus):
insights into avian genome evolution. BMC Genomics 2009,
10:1.
19. Kaczmarek M, Koczyk G, Ziolkowski PA, Babula-Skowronska D, Sad-
owski J:
Comparative analysis of the Brassica oleracea genetic
map and the Arabidopsis thaliana genome. Genome 2009,
52:620-633.
20. Kucuktas H, Wang S, Li P, He C, Xu P, Sha Z, Liu H, Jiang Y, Baopra-
sertkul P, Somridhivej B, Wang Y, Abernathy J, Guo X, Liu L, Muir W,
Liu Z: Construction of genetic linkage maps and comparative
genome analysis of catfish using gene-associated markers.
Genome Biology 2009, Volume 10, Issue 11, Article R126 Wang et al. R126.16
Genome Biology 2009, 10:R126
Genetics 2009, 181:1649-1660.
21. Kortschak RD, Samuel G, Saint R, Miller DJ: EST analysis of the
cnidarians Acropora millepora reveals extensive gene loss and
rapid sequence divergence in the model invertebrates. Curr
Biol 2003, 13:2190-2195.
22. Technau U, Rudd S, Maxwell P, Gordon PMK, Saina M, Grasso LC,
Hayward DC, Sensen CW, Saint R, Holstein TW, Ball EE, Miller DJ:
Maintenance of ancestral complexity and non-metazoan
genes in two basal cnidarians. TRENDS Genet 2005, 21:633-639.
23. JoinMap4 [ />24. Grattapaglia D, Sederoff R: Genetic linkage maps of Eucalyptus
grandis and Eucalyptus urophylla using a pseudotestcross:
mapping strategy and RAPD markers. Genetics 1994,
137:1121-1137.
25. Downs CA, Mueller E, Phillips S, Fauth JE, Woodley CM: A molecu-
lar biomarker system for assessing the health of coral (Mon-
tastrea faveolata) during heat stress. Mar Biotechnol 2000,
2:533-544.
26. Desalvo MK, Voolstra CR, Sunagawa S, Schwarz JA, Stillman JH, Cof-
froth MA, Szmant AM, Medina M: Differential gene expression
during thermal stress and bleaching in the Caribbean coral
Montastraea faveolata. Mol Ecol 2008, 17:3952-3971.
27. Fishman L, Kelly AJ, Morgan E, Willis JH: A genetic map in the
Mimulus guttatus species complex reveals transmission ratio
distortion due to heterospecific interactions. Genetics 2001,
159:1701-1716.
28. Chakravarti A, Lasher LK, Reefer JE: A maximum likelihood
method for estimating genome length using genetic linkage
data. Genetics 1991, 128:175-182.
29. Marquez LM, MacKenzie JB, Takabayashi M, Smith CR, Chen CA:
Dif-
ficulties in obtaining microsatellites from acroporid corals.
Proc 9th Int Coral Reef Symp 2000, 1:139-143.
30. Syvänen AC: Accessing genetic variation: genotyping single
nucleotide polymorphisms. Nat Rev Genet 2001, 2:930-942.
31. Barbazuk WB, Emrich SJ, Chen HD, Li L, Schnable PS: SNP discov-
ery via 454 transcriptome sequencing. Plant J 2007, 51:910-918.
32. Vera JC, Wheat CW, Fescemyer HW, Frilander MJ, Crawford DL,
Hanski I, Marden JH: Rapid transcriptome characterization for
a nonmodel organism using 454 pyrosequencing. Mol Ecol
2008, 17:1636-1647.
33. Hahn DA, Ragland GJ, Shoemaker DD, Denlinger DL: Gene discov-
ery using massively parallel pyrosequencing to develop ESTs
for the flesh fly Sarcophaga crassipalpis. BMC Genomics 2009,
10:234.
34. Lay MJ, Wittwer CT: Real-time fluorescence genotyping of fac-
tor V leiden during rapid-cycle PCR. Clin Chem 1997,
43:2262-2267.
35. Crockett AO, Wittwer CT: Fluorescein-labeled oligonucle-
otides for real-time PCR: using the inherent quenching of
deoxyguanosine nucleotides. Anal Biochem 2001, 290:89-97.
36. Zhou L, Myers AN, Vandersteen JG, Wang L, Wittwer CT: Closed-
tube genotyping with unlabeled oligonucleotide probes and
a saturating DNA dye. Clin Chem 2004, 50:1328-1335.
37. Liew M, Seipp M, Durtschi J, Margraf RL, Dames S, Erali M, Voelkerd-
ing K, Wittwer C: Closed-tube SNP genotyping without
labeled probes: A comparison between unlabeled probe and
amplicon melting. Am J Clin Pathol 2007, 127:341-348.
38. Ayre DJ, Hughes TP: Genotypic diversity and gene flow in
brooding and spawning corals along the Great Barrier Reef,
Australia. Evolution 2000, 54:1590-1605.
39. Oliver T, Palumbi S: Genetic evidence of dispersal limitation
and local adaptation in Samoan reef corals. ReefBase 2006
[ />load.aspx?type=10&docid=E0000006182_1].
40. Wang S, Bao Z, Pan J, Zhang L, Yao B, Zhan A, Bi K, Zhang Q:
AFLP
linkage map of an intraspecific cross in Chlamys farreri. J Shel-
lifish Res 2004, 23:491-499.
41. Franch R, Louro B, Tsalavouta M, Chatziplis D, Tsigenopoulos CS,
Sarropoulou E, Antonello J, Magoulas A, Mylonas CC, Babbucci M,
Patarnello T, Power DM, Kotoulas G, Bargelloni L: A genetic link-
age map of the hermaphrodite teleost fish Sparus aurata L.
Genetics 2006, 174:851-861.
42. Sekino M, Hara M: Linkage maps for the Pacific abalone (genus
Haliotis) based on microsatellite DNA markers. Genetics 2007,
175:945-958.
43. Moen T, Hayes B, Baranski M, Berg PR, Kjoglum S, Koop BF, Davidson
WS, Omholt SW, Lien S: A linkage map of Atlantic salmon
(Salmo salar) based on EST-derived SNP markers. BMC
Genomics 2008, 9:223.
44. Li Q, Chen L, Kong L: A genetic linkage map of the sea cucum-
ber, Apostichopus japonicus (Selenka), based on AFLP and
microsatellite markers. Anim Genet 2009, 40:678-685.
45. Zhan A, Hu J, Hu X, Hui M, Wang M, Peng W, Huang X, Wang S, Lu
W, Sun C, Bao Z: Construction of microsatellite-based linkage
maps and identification of size-related quantitative trait loci
for Zhikong scallop (Chlamys farreri). Anim Genet 2009,
40:821-831.
46. Maliepaard C, Jansen J, van Ooijen JW: Linkage analysis in a full-
sib family of an outbreeding plant species: overview and con-
sequences for applications. Genet Res Camb 1997, 70:237-250.
47. Musio A, Mariani T, Vezzoni P, Frattini A: Heterogeneous gene
distribution reflects human genome complexity as dected at
the cytogenetic level. Cancer Genet Cytogenet 2002, 134:168-171.
48. Soller M: Marker-assisted selection in animal biotechnology.
In Agricultural Biotechnology Edited by: Altman A. New York: Marcel
Dekker; 1998:387-406.
49. Alonso-Blanco C, Koornneef M, van Ooijen JW: QTL Analysis.
Methods Mol Biol 2006, 323:
79-99.
50. Jensen-Seaman MI, Terrence SF, Payseur BA, Lu Yontao, Roskin KM,
Chen C-F, Thomas MA, Haussler D, Jacob HJ: Comparative
recombination rates in the rat, mouse, and human genomes.
Genome Res 2004, 14:528-538.
51. Singh ND, Arndt PF, Petrov DA: Genomic heterogeneity of
background substitutional patterns in Drosophila mela-
nogaster. Genetics 2005, 169:709-722.
52. The Arabidopsis Information Resource [bidop
sis.org/]
53. Palacios R, Gazave E, Goni J, Piedrafita G, Fernando O, Navarro A,
Villoslada P: Allele-specific gene expression is widespread
across the genome and biological processes. PLoS One 2009,
4:e4150.
54. Hedrick PW: Sex: differences in mutation, recombination,
selection, gene flow, and genetic drift. Evolution 2007,
61:2750-2771.
55. Trivers R: Sex differences in rated of recombination and sex-
ual selection. In The Evolution of Sex Edited by: Michod RR, Levin BR.
MA: Sinauer Associates; 1988:270-286.
56. Labonne JDJ, Hilliker AJ, Shore JS: Meiotic recombination in Turn-
era (Turneraceae): extreme sexual difference in rates, but
no evidence for recombination suppression associated with
the distyly (S) locus. Heredity 2007, 98:411-418.
57. Lenormand T: The evolution of sex dimorphism in recombina-
tion. Genetics 2003, 163:811-822.
58. Joseph SB, Kirkpatrick M: Haploid selection in animals. Trends
Ecol Evol 2004, 19:592-597.
59. Lenormand T, Dutheil J: Recombination difference between
sexes: A role for haploid selection. PLoS Biol 2005, 3:e63.
60. Okubo N, Motokawa T: Embryogenesis in the reef-building
coral Acropora spp. Zool Sci 2007, 24:
1169-1177.
61. Herrmann BG, Koschorz B, Wertz K, McLaughlin KJ, Kispert A: A
protein kinase encoded by the t complex responder gene
causes non-mendelian inheritance. Nature 1999, 402:141-146.
62. Zheng Y, Deng X, Martin-Deleon PA: Lack of sharing of Spam1
(Ph-20) among mouse spermatids and transmission ratio
distortion. Biol Reprod 2001, 64:1730-1738.
63. Coghlan A, Eichler EE, Oliver SG, Paterson AH, Stein L: Chromo-
some evolution in eukaryotes: a multi-kingdom perspective.
Trends Genet 2005, 21:673-682.
64. Ferguson-Smith MA, Trifonov V: Mammalian karyotype evolu-
tion. Nat Rev Genet 2007, 8:950-962.
65. Zdobnov EM, von Mering C, Letunic I, Torrents D, Suyama M, Copley
RR, Christophides GK, Thomasova D, Holt RA, Subramanian GM:
Comparative genome and proteome analysis of Anopheles
gambiae and Drosophila melanogaster. Science 2002,
298:149-159.
66. Pevzner P, Tesler G: Genome rearrangements in mammalian
evolution: lessons from human and mouse genomes. Genome
Res 2003, 13:37-45.
67. Hill MM, Broman KW, Stupka E, Smith WC, Jiang D, Sidow A: The
C. savignyi genetic map and its integration with the reference
sequence facilitates insights into chordate genome evolu-
tion. Genome Res 2008, 18:1369-1379.
68. Putnam NH, Srivastava M, Hellsten U, Dirks B, Chapman J, Salamov
A, Terry A, Shapiro H, Lindquist E, Kapitonov VV, Jurka J, Genikhov-
ich G, Grigoriev IV, Lucas SM, Steele RE, Finnerty JR, Technau U, Mar-
tindale MQ, Rokhsar DS: Sea anemone genome reveals
Genome Biology 2009, Volume 10, Issue 11, Article R126 Wang et al. R126.17
Genome Biology 2009, 10:R126
ancestral eumetazoan gene repertoire and genomic organi-
zation. Science 2007, 317:86-94.
69. Srivastava M, Begovic E, Chapman J, Putnam NH, Hellsten U,
Kawashima T, Kuo A, Mitros T, Salamov A, Carpenter ML, Signoro-
vitch AY, Moreno MA, Kamm K, Grimwood J, Schmutz J, Shapiro H,
Grigoriev IV, Buss LW, Schierwater B, Dellaporta SL, Rokhsar DS:
The Trichoplax genome and the nature of placozoans. Nature
2008, 454:955-960.
70. Schierwater B, Eitel M, Jakob W, Osigus HJ, Hadrys H, Dellaporta SL,
Kolokotronis SO, Desalle R: Concatenated analysis sheds light
on early metazoan evolution and fuels a modern 'Urmeta-
zoan' hypothesis. PLoS Biol 2009, 7:e7.
71. Dunn CW, Hejnol A, Matus DQ, Pang K, Browne WE, Smith SA,
Seaver E, Rouse GW, Obst M, Edgecombe GD, Sorensen MV, Had-
dock SHD, Schmidt-Rhaesa A, Okusu A, Kristensen RM, Wheeler
WC, Martindale MQ, Giribet G: Broad phylogenomic sampling
improves resolution of the animal tree of life. Nature 2008,
452:745-749.
72. Gaut BS: Patterns of chromosome duplication in maize and
their implications for comparative maps of the grasses.
Genome Res 2001, 11:55-66.
73. Vandepoele K, Saeys Y, Simillion C, Raes J, Peer Y Van de: The auto-
matic detection of homologous regions (ADHoRe) and its
application to microcolinearity between Arabidopsis and rice.
Genome Res 2002, 12:1792-1801.
74. Hampson S, McLysaght A, Gaut B, Baldi P: LineUp: statistical
detection of chromosome homology with application to
plant comparative genomics. Genome Res 2003, 13:999-1010.
75. Hampson SE, Gaut BS, Baldi P: Statistical detection of chromo-
somal homology using shared-gene density alone. Bioinformat-
ics 2005, 21:1339-1348.
76. Ranz JM, Casals F, Ruiz A: How malleable is the eukaryotic
genome? Extreme rate of chromosomal rearrangement in
the genus Drosophila.
Genome Res 2001, 11:230-239.
77. Coghlan A, Wolfe KH: Fourfold faster rate of genome rear-
rangement in nematodes than in Drosophila. Genome Res 2002,
12:857-867.
78. Sharakhov IV, Serzain AC, Grushko OG, Dana A, Lobo N, Hillen-
meyer ME, Westerman R, Romero-Severson J, Costantini C, Sagnon
N'F, Collins FH, Besansky NJ: Inversions and gene order shuffling
in Anopheles gambiae and A. funestus. Science 2002,
298:182-185.
79. Eichler EE, Sankoff D: Structural dynamics of eukaryotic chro-
mosome evolution. Science 2003, 301:793-797.
80. Hurst LD, Pal C, Lercher MJ: The evolutionary dynamics of
eukaryotic gene order. Nat Rev Genet 2004, 5:299-310.
81. Nadeau JH, Taylor BA: Lengths of chromosomal segments con-
served since divergence of man and mouse. Proc Natl Acad Sci
USA 1984, 81:814-818.
82. de Rosa R, Grenier JK, Andreeva T, Cook CE, Adoutte A, Akam M,
Carroll SB, Balavoine G: Hox genes in brachiopods and pri-
apulids and protostome evolution. Nature 1999, 399:772-776.
83. Santini S, Boore JL, Meyer A: Evolutionary conservation of regu-
latory elements in vertebrate Hox gene clusters. Genome Res
2003, 13:1111-1122.
84. Engstrom PG, Sui H, Shannan J, Drivenes O, Becker TS, Lenhard B:
Genomic regulatory blocks underlie extensive microsynteny
conservation in insects. Genome Res 2007, 17:1898-1908.
85. Kikuta H, Laplante M, Navratilova P, Komisarczuk AZ, Engstrom PG,
Fredman D, Akalin A, Caccamo M, Sealy I, Howe K: Genomic reg-
ulatory blocks encompass multiple neighboring genes and
maintain conserved synteny in vertebrates. Genome Res 2007,
17:545-555.
86. Neher RA, Shraiman BI: Competition between recombination
and epistasis can cause a transition from allele to genotype
selection. Proc Natl Acad Sci USA 2009, 106:6866-6871.
87. Barker DL, Hansen MST, Faruqi AF, Giannola D, Irsula OR, Lasken RS,
Latterich M, Makarov V, Oliphant A, Pinter JH, Shen R, Sleptsova I,
Ziehler W, Lai E: Two methods of whole-genome amplification
enable accurate genotyping across a 2320-SNP linkage
panel. Genome Res 2004, 14:901-907.
88. Paez JG, Lin M, Beroukhim R, Lee JC, Zhao X, Richter DJ, Gabriel S,
Herman P, Sasaki H, Altshuler D, Li C, Meyerson M, Sellers WR:
Genome coverage and sequence fidelity of phi29 polymer-
ase-based multiple strand displacement whole genome
amplification. Nucleic Acids Res 2004, 32:e71.
89. Jasmine F, Ahsan H, Andrulis IL, John EM, Chang-Claude J, Kibriya
MG: Whole-genome amplification enables accurate genotyp-
ing for microarray-based high-density single nucleotide poly-
morphism array. Cancer Epidemiol Biomarkers Prev 2008,
17:3499-3508.
90. Matz MV: Amplification of representative cDNA pools from
microscopic amounts of animal tissue. Methods Mol Biol 2003,
221:103-116.
91. Stam P: Construction of integrated genetic linkage maps by
means of a new computer package: JOINMAP. Plant J 1993,
3:739-744.
92. Kosambi DD: The estimation of map distance from recombi-
nation values. Ann Eugen 1944, 12:172-175.
93. Voorrips RE: MapChart: Software for the graphical presenta-
tion of linkage maps and QTLs. J Hered 2002, 93:77-78.
94. Fanarraga ML, Parraga M, Aloria K, del Mazo J, Avila J, Zabala JC: Reg-
ulated expression of p14 (cofactor A) during spermatogene-
sis. Cell Motil Cytoskeleton 1999, 43:243-254.
95. Yu H, Jiang D, Guo Z, Saiyin H, Guo J, Wang X, Yu L: TCP10L is
expressed specifically in spermatogenic cells and binds to
death associated protein kinase-3. Int J Androl 2005, 28:163-170.
96. Ariz M, Mainpal R, Subramaniam K: C. elegans RNA-binding pro-
teins PUF-8 and MEX-3 function redundantly to promote
germline stem cell mitosis. Dev Biol 2009, 326:295-304.
97. Zhang P, Kerkela E, Skottman H, Levkov L, Kivinen K, Lahesmaa R,
Hovatta O, Kere J: Distinct sets of developmentally regulated
genes that are expressed by human oocytes and human
embryonic stem cells. Fertil Steril 2007, 87:677-690.
98. Meagher MJ, Schumacher JM, Lee K, Holdcraft RW, Edelhoff S, Dis-
teche C, Braun RE: Identification of ZFR, an ancient and highly
conserved murine chromosome-associated zinc finger pro-
tein. Gene 1999, 228:197-211.
99. Li H, Zhang L, Zhang G, Niu N, Zhu Z: Construction on cDNA
library from fertility-related genes of male sterile wheat with
Aegilops kotschyi cytoplasm by SSH. Acta Agronomica Sinica 2008,
34:965-971.
100. McDaniel IE, Lee JM, Berger MS, Hanagami CK, Armstrong JA: Inves-
tigation of CHD1 function in transcription and development
of Drosophila melanogaster. Genetics 2008, 178:583-587.
101. Feig C, Kirchhoff C, Ivell R, Naether O, Schulze W, Spiess A-N: A
new paradigm for profiling testicular gene expression during
normal and disturbed human spermatogenesis. Mol Hum
Reprod 2007, 13:33-43.
102. Zhou A, Zhou J, Yang L, Liu M, Li H, Xu S, Han M, Zhang J: A nuclear
localized protein ZCCHC9 is expressed in cerebral cortex
and suppresses the MAPK signal pathway. J Genet Genomics
2008, 35:467-472.
103. Miyakoshi K, Murphy MJ, Yeoman RR, Mitra S, Dubay CJ, Hennebold
JD: The identification of novel ovarian proteases through the
use of genomic and bioinformatic methodologies. Biol Reprod
2006, 75:823-835.
104. Ginter-Matuszewska B, Spik A, Rembiszewska A, Koyias C, Kupry-
janczyk J, Jaruzelska J: The SNARE-associated component
SNAPIN binds PUMILIO2 and NANOSI proteins in human
male germ cells. Mol Hum Reprod 2009, 15:173-179.