Association mapping for morphological and physiological traits in Populus simonii
Bạn đang xem bản rút gọn của tài liệu. Xem và tải ngay bản đầy đủ của tài liệu tại đây (364.9 KB, 8 trang )
Wei et al. BMC Genetics 2014, 15(Suppl 1):S3
/>
PROCEEDINGS
Open Access
Association mapping for morphological and
physiological traits in Populus simonii
Zunzheng Wei1,2, Guanyu Zhang1,2, Qingzhang Du1,2, Jinfeng Zhang1,2, Bailian Li1,2*, Deqiang Zhang1,2*
From International Symposium on Quantitative Genetics and Genomics of Woody Plants
Nantong, China. 16-18 August 2013
Abstract
Background: To optimize marker-assisted selection programs, knowledge of the genetic architecture of
phenotypic traits is very important for breeders. Generally, most phenotypes, e.g. morphological and physiological
traits, are quantitatively inherited, and thus detection of the genes underlying variation for these traits is difficult.
Association mapping based on linkage disequilibrium has recently become a powerful approach to map genes or
quantitative trait loci (QTL) in plants.
Results: In this study, association analysis using 20 simple sequence repeat (SSR) markers was performed to detect
the marker loci linked to 13 morphological traits and 10 physiological traits in a wild P. simonii population that
consisted of 528 individuals sampled from 16 sites along the Yellow River in China. Based on a model controlling
for both population structure (Q) and relative kinship (K), three SSR markers (GCPM_616-1 in 31.2 Mb on LG I,
GCPM_4055-2 in 5.7 Mb on LG XV, and GCPM_3142 of unknown location) were identified for seven traits.
GCPM_616-1 was associated with five morphological traits (R2 = 5.14-10.09%), whereas GCPM_3142 (15.03%) and
GCPM_4055-2 (13.26%) were associated with one morphological trait and one physiological trait, respectively.
Conclusions: The results suggest that this wild population is suitable for association mapping and the identified
markers will be suitable for marker-assisted selection breeding or detection of target genes or QTL in the near future.
Background
The development of fast-growing, highly adaptable and
disease-resistant cultivars is a major focus in Populus
breeding programs. To optimize marker-assisted selection
programs, knowledge of the genetic architecture of phenotypic traits is very important for breeders. Generally, most
phenotypes, e.g. morphological and physiological traits, are
quantitatively inherited, and thus detection of the genes
underlying variation for these traits is difficult. Mapping of
quantitative trait loci (QTL) is a well-developed discipline
that dissects the inheritance of complex traits into discrete
Mendelian genetic factors [1]. Association mapping, also
called linkage disequilibrium (LD) mapping, which directly
studies statistical associations between genetic markers and
* Correspondence: ;
1
National Engineering Laboratory for Tree Breeding, College of Biological
Sciences and Technology, Beijing Forestry University, No. 35, Qinghua East
Road, Beijing 100083, P. R. China
Full list of author information is available at the end of the article
phenotypes in natural populations, has recently regarded as
promising approach to mapping QTL in crop plants. It can
exploits all the recombination events that have occurred
during the history of the population, allowing fine-scale
QTL mapping [2-4]. Moreover, it bypasses the expense
and shortens the duration of mapping studies by making
the crossing cycles in population development unnecessary
and enabling the mapping of many traits in one set of genotypes [2,5,6]. A concern about association mapping is that
marker-trait associations may arise from confounding
population structure, which may cause spurious correlations, leading to an elevated both Type I and II errors
between molecular markers and traits of interest. However,
estimates such as population structure (Q) and/or pairwise kinship coefficients (K) were successfully applied to
deal with the issue of false positives generated by population structure [2,3].
Generally, association mapping can be divided into
genome-wide association mapping and candidate gene
© 2014 Wei et al.; licensee BioMed Central Ltd. This is an Open Access article distributed under the terms of the Creative Commons
Attribution License ( which permits unrestricted use, distribution, and reproduction in
any medium, provided the original work is properly cited. The Creative Commons Public Domain Dedication waiver (http://
creativecommons.org/publicdomain/zero/1.0/) applies to the data made available in this article, unless otherwise stated.
Wei et al. BMC Genetics 2014, 15(Suppl 1):S3
/>
association mapping according to the scale (sample
size), pre-known information (gene function and pathways), and purpose (questions to be addressed) of the
studies [3]. Recently, the candidate gene method has
been used to identify trait-marker relationships in
poplar. In a pioneering association mapping study of a
candidate region surrounding the phytochrome B2
(phyB2) locus in European Aspen (Populus tremula),
two non-synonymous single nucleotide polymorphisms
(SNPs) that independently associated with variation in
the timing of bud set were identified and explained
between 1.5 and 5% of the observed phenotypic variation in bud set [7]. Using the same panel, Ma et al [8]
identified multi-SNPs from three genes in the photoperiod pathway (PHYB2, LHY1, and LHY2) associated with
natural variation in growth cessation, which collectively
explained 10-15% of the phenotypic variation. Li et al [9]
conducted association analyses between leaf autumn
senescence and SNPs derived from genes in the photoperiod pathway with naturally regenerated P. tremula
populations. In addition, SNP- and haplotype-based association analysis in 426 P. tomentosa clones showed that
nine SNPs and 12 haplotypes within UDP-glucuronate
decarboxylase (UXS) were significantly associated with
growth and wood property traits with 2.70% to 12.37% of
the phenotypic variation [10]. However, whole-genome
association studies have the advantage of enabling the
entire genome to be assessed for trait-associated variants,
rather than analyzing candidate genes [3-5].
Although more abundant SNP markers have been developed for poplar, genome-wide association mapping in
poplar has rarely been attempted to date. This is largely
because of the impracticality of genotyping large numbers
of entries at the required number of SNP loci and the high
development/detection cost. Compared to a SNP marker
system, simple sequence repeat (SSR) markers remain an
attractive marker system for genome-wide association
mapping of poplar on account of their high variability, ubiquity, co-dominance, and easy availability. In addition, the
most important factor is that a SSR marker system allows
alignment to the black cottonwood (P. trichocarpa) genomic sequence, which provides information for comparative
genomic studies of different species [11,12]. A large number of SSR primers for Populus have been designed from
sequences that were randomly selected based on either
library enrichment or shotgun sequencing strategies from
various Populus species [13]. In addition, 148,428 SSR primers that amplified microsatellites consisting of repetitive
motifs of 2-5 bp recently have been developed from unambiguously mapped sequence scaffolds of the P. trichocarpa
genome [14].
Populus simonii is one of the most important native
tree species in northern China and is widely distributed
from Qinghai to the east coast in longitude and from
Page 2 of 8
the Heilongjiang River to the Yangtze River in latitude
[15]. Owing to its large distribution range, excellent
stress tolerance, rapid growth and regeneration ability,
P. simonii plays an important and pioneering role in the
stability and sustainability of forest ecosystems in northern China. In the present study, we performed association analysis of 20 SSR loci with 13 morphological traits
and 10 physiological traits using 528 wild P. simonii
individuals sampled from 16 sites along the Yellow
River in China (Table S1 in Additional file 1). The
major objectives were (1) to examine the population
structure and familial relatedness of P. simonii and evaluate appropriate statistical models for association analysis, and (2) to identify the marker loci/QTL underlying
the naturally occurring variation in the phenotypic traits.
Results
Phenotypic traits
As shown by the descriptive statistics presented in Table 1
extensive phenotypic variation was observed for all of the
measured morphological and physiological traits in the
P. simonii population. The lateral veins angle, which varied
from 27.333° to 59.833° with an average of 43.359°, had the
lowest change (2.2-fold), whereas leaf petiole length, which
varied from 2.795 mm to 36.792 mm with an average of
10.136 mm, had the highest maximum change of 13.2fold. Higher variation was observed for the 10 physiological traits (mean coefficient of variation 35.78%) than for
the 13 morphological traits (24.06%). All traits were not
normally distributed among the sampled individuals with
two exceptions (lateral veins angle and ChlA content).
Population structure and relative kinship
Coupled with ΔK parameter computation [16], the percentage of admixture of each individual obtained for K = 3
[17] was used in the subsequent association analyses
(Table S2 in Additional file 1). Relative kinship estimates
based on the 20 SSR loci showed that 63.0% of the pairwise kinship estimates equal to 0 suggests that almost
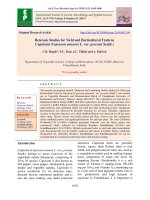
two-thirds of the total pairs of accessions showed no relationship. As many as 99.6% of the relative kinship estimates were less than 0.30, which indicated that few
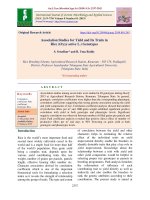
individuals showed strong similarities, and most individuals were weakly related in this wild P. simonii population (Figure 1).
Association mapping and allelic effect
Association mapping using 20 SSRs based on both the Q
model and Q+K model was performed and is summarized in Table 2. For all 23 traits, a model that controlled
for population structure and relative kinship performed
significantly better than the model that merely controlled
for population structure. Compared to the total number
of significant markers identified with the Q model, the
Wei et al. BMC Genetics 2014, 15(Suppl 1):S3
/>
Page 3 of 8
Table 1 Phenotypic variation for 13 morphological traits
and 10 physiological traits in the wild P. simonii
population
Traits
Min
Max
Mean
SD
CV
SW
*
Morphological traits
LL (mm)
26.385
79.652
48.674
8.095
16.63%
LW(mm)
16.682
49.537
29.514
5.653
19.15%
**
LL/LW
1.255
2.977
1.698
0.190
11.21%
**
LA (cm2)
LVL (mm)
3.378
10.157
30.038
37.648
10.621
21.664
4.117
4.093
38.76%
18.89%
**
*
LVA (°)
27.333
59.833
43.359
4.749
10.95%
LBA (°)
18.667
65.833
34.363
6.644
19.33%
**
LTN (n)
3.833
12.833
7.028
1.404
19.98%
**
LT(mm)
0.165
0.370
0.272
0.034
12.67%
*
LPL(mm)
2.795
36.792
10.136
6.603
65.14%
**
IL (mm)
7.313
36.758
21.480
5.899
27.46%
**
H (cm)
D (cm)
23.333
0.090
134.000
0.360
69.610
0.186
19.376
0.046
27.83%
24.83%
**
**
ChlA (mg/L)
2.773
15.443
9.282
2.450
26.39%
ChlB(mg/L)
1.096
10.081
3.515
1.220
34.72%
**
ChlC(mg/L)
1.233
6.671
3.451
0.882
25.54%
**
SAR(μg/g)
10.938
64.964
24.607
10.842
44.06%
**
POD(U/g ▪ min)
0.262
1.111
0.779
0.139
17.81%
**
CAT(mg/ ▪ min)
RCR (%)
0.621
8.528
3.992
34.096
1.533
16.438
0.814
3.999
53.09%
24.33%
**
**
MDA(nmol/g)
5.081
40.276
12.243
6.608
53.98%
**
RRO(μg/g)
1.222
6.420
3.071
0.774
25.20%
**
PAL(U/g ▪ h)
0.094
0.521
0.172
0.091
52.71%
**
Physiological traits
* P < 0.05, ** P < 0.01
total number identified with the Q+K model was severely
reduced by 199, 144 and 101 at P < 0.05, P < 0.01 and
P < 0.001, respectively (Table 2). Despite correction for
multiple tests in the Q model, the total associated marker
number was still 14-fold lower in the Q+K model at
qFDR < 0.05.
Using the Q model, the number of markers associated
with morphological or physiological traits decreased
with the increase in significance level, with a more than
30% decrease from P < 0.05 to P < 0.01, and almost
30% decrease from P < 0.01 to P < 0.001. The loci significant at the adjusted P values after a 50,000 permutation test were similar to those significant at the P <
0.001 level without the permutation test. The highest
number of markers associated at Padj < 0.05 were identified for leaf petiole length (12 SSRs) followed by the
ChlB content (10) and internode length (9), whereas the
lowest number was found for CAT (0), RRO (0) and
PAL (0). For the Q+K model, the number of associated
markers for physiological traits (e.g. ChlA, ChlB, ChlC,
SAR, MDA, and RRO) at P < 0.05, P < 0.01 and P <
0.001 was less stable than for morphological traits. At
qFDR < 0.05, seven traits (LL/LW, LA, LBA, LTN, LPL,
IL, and MDA) were only identified with one marker,
respectively. However, more marker-trait associations
were found for morphological traits than physiological
traits overall regardless of the model.
Table 3 summarizes the significant markers and their
phenotypic effects based on the Q+K model in the wild
P. simonii population. For the six morphological traits, a
total of six marker-trait associations were examined with
two different markers. The SSR locus GCPM_616-1 on
linkage group I was significant for five traits (LL/LW, LA,
LBA, LTN, and IL) and explained a percentage of phenotypic variance that ranged from 5.14% for LA and 10.09%
for LTN. In most instances, the presence of marker
alleles 143 and 147 increased the phenotype value for all
five morphological traits with the exception of the alleles
147 and 143 for LL/LW and LA separately. GCPM_3142
was significant only for LPL and explained the highest
total phenotypic variance (15.03%), which indicated this
SSR marker might be an important main-effect QTL that
contributes to the leaf petiole length in P. simonii. After
removal of rare alleles, six alleles were detected that
showed a similar trend in increasing the leaf petiole
length jointly or independently. Among the entire
P. simonii panel, individuals carrying the allele 227
appeared to have a longer leaf petiole length compared to
other alleles. For physiological traits, GCPM_4055-2 on
linkage group XV was detected for MDA, with a higher
proportion of the variation explained (13.26%). Two markers were associated with reduced malonaldehyde concentration but no significant allele effect was observed.
Discussion
Appropriate statistical model for association mapping
Figure 1 Distribution of the pair-wise relative kinship estimates
between the 528 individuals of P. simonii based on data for 20
SSR markers.
Correction for the confounding effects of population
structure present in plant populations is essential for
association mapping because the complex population
structure may cause spurious correlations, which finally
result in an elevated false-positive rate [4,5,18]. To reduce
the probability of detecting false positive marker-trait
Wei et al. BMC Genetics 2014, 15(Suppl 1):S3
/>
Page 4 of 8
Table 2 Number of significant markers associated with 23 traits using two statistical models (Q and Q+K) at different
significance levels
Tratis
Q
Q+K
P < 0.05
P < 0.01
P < 0.001
Padj < 0.05a
P < 0.05
P < 0.01
P < 0.001
q < 0.05b
8
7
4
4
4
4
0
0
0
0
0
0
0
0
Morphological traits
LL
LW
11
9
LL/LW
6
3
3
1
1
1
0
1
LA
12
10
9
8
1
1
0
1
LVL
6
3
3
3
0
0
0
0
LVA
3
3
1
1
0
0
0
0
LBA
9
7
7
6
1
1
1
1
LTN
9
7
4
4
1
1
1
1
LT
LPL
13
15
12
13
7
12
7
12
0
1
0
1
0
1
0
1
IL
16
10
9
9
1
1
1
1
H
9
4
3
3
0
0
0
0
D
11
6
3
3
0
0
0
0
Physiological traits
ChlA
12
10
7
8
2
0
0
0
ChlB
16
11
10
10
2
1
0
0
ChlC
SAR
14
4
11
3
8
1
9
1
2
1
0
0
0
0
0
0
POD
7
5
2
3
0
0
0
0
CAT
4
2
0
0
1
0
0
0
RCR
12
10
7
7
0
0
0
0
MDA
8
5
2
2
2
1
1
1
RRO
5
2
0
0
1
0
0
0
PAL
5
0
0
0
0
0
0
0
Total
216
152
106
105
17
8
5
7
a
The adjusted P values were obtained after a 50,000 permutation test, and these markers are shown in Table S4 in Additional file 1
b
The false discovery rate (DFR) or q values were obtained with the QVALUE R package, and these markers are shown in Tables 3
Table 3 Significant SSR markers and its phenotypic effects in the wild P. simonii population
Trait
Locusa
LG
Position
(cM/Mb)
P
qFDR
R2
GCPM_616-1
I
-/31.2
0.0014
0.0051
0.0609
b
Allele size (bp)
Allele effect
Morphological traits
LL/LW
LA(cm2)
GCPM_616-1
I
-/31.2
0.007
0.0211
143
−0.1017
147
143
0.0268
0.0514
147
0.2174
143
0.0626
147
0.0607
143
0.9784
GCPM_616-1
I
-/31.2
7.18E-06
4.33E-05
0.0730
LTN(n)
GCPM_616-1
I
-/31.2
7.26E-08
6.57E-07
0.1009
LPL(mm)
GCPM_616-1
GCPM_3142
I
-
-/31.2
-/-
9.75E-05
1.24E-08
0.0004
2.24E-07
0.0002
−0.0010
0.0514
LBA(°)
IL(mm)
143
147
0.0638
0.1503
147
0.4136
215
9.0707
219
223
10.7675
10.1148
227
11.9544
231
9.1360
235
8.9211
Wei et al. BMC Genetics 2014, 15(Suppl 1):S3
/>
Page 5 of 8
Table 3 Significant SSR markers and its phenotypic effects in the wild P. simonii population (Continued)
Physiological traits
MDA(nmol/g)
a
b
GCPM_4055-2
XV
-/5.7
7.14E-06
0.0003
0.1326
217
−3.5305
229
−3.3007
Markers with a significant marker-trait association are reported at qFDR value < 0.05
R2 indicates the percentage of the total variation explained by each locus
associations, one major method, the structured association (SA) [3,18], has been suggested to account for population structure. In this method, the Q matrix estimated
by the program Structure using a set of random markers
is commonly incorporated in a general linear model
(GLM) to test associations. However, Q matrix may not
completely represent the population structure, although
it can efficiently reduce the spurious associations. Yang
et al [19] reported that structure program divides the
panel into a few discrete populations, and the Q matrix
only provides a rough dissection of population differentiation. Consequently, the K matrix [2] calculated using
the SPAGeDi software package for familial relatedness
has been broadened to combine with the Q matrix in a
mixed linear model to improve the false positive detection rate, as described by Yu et al [2]. Additional studies
have demonstrated that the Q+K model controlling for
population structure and genetic relatedness, is better
than the Q model [2,19,20]. The present results agreed
with this finding, but with difference that the number of
significant markers in the Q+K model was sharply
reduced by more than 1100% at different P values compared with the Q model (Table 2). In fact, more than
60% of estimates of pairwise relatedness are around zero
at K = 3, which means that the kinship relationships
might not be important in affecting association mapping.
However, the results show large effects between Q and Q
+K models. The reason may be the P. simonii panel was
derived from a mixture of individuals from 16 sites,
which cause Hardy-Weinberg disequilibrium for single
locus and LD for multiple loci. In addition, the lower
number of SSR markers employed to estimate the kinship
matrix may be another factor [20].
Detection of phenotype-genotype association and
additional perspectives
In the present study, genome-wide association mapping was
applied to detect DNA markers tightly linked to agronomically and adaptively important traits. We detected three SSR
markers, comprising GCPM_616-1, GCPM_4055-2 and
GCPM_3142, for six morphological traits (LL/LW, LA,
LBA, LTN, IL, and LPL) and one physiological trait (MDA)
using the Q+K model. Of these markers, GCPM_616-1 was
simultaneously associated with five morphological traits,
which explained 5.14% to 10.09% of the phenotypic variance. Two possible explanations for this finding are closely
linked genes or pleiotropy [21]. The other two markers
explained more than 13% of the total phenotypic variance,
which suggested that medium-effect QTL might be located
near these SSR loci. The public release of the whole-genome
sequence for P. trichocarpa Nisqually-1 enables alignment
of the three SSR markers with the poplar genome sequence.
The genetic position of each associated SSR marker is
shown in Table 3. GCPM_616-1 and GCPM_4055-2 were
observed on linkage groups I and XV, respectively, whereas
GCPM_3142 was not examined. The physical position on
the linkage group for GCPM_616-1 ranged from 31,165,745
to 31,165,891 bp, whereas the position of GCPM_4055-2
ranged from 5,665,052 to 5,665,276 bp.
To compare published QTL or SSR markers with those
detected in the present study, we undertook a literature
review for QTL reported for these traits in linkage mapping or association mapping studies. However, extremely
limited information is available for this comparison in
spite of the availability of a high-density SSR genetic map
[22,25] derived from P. trichocarpa. The main reasons for
this are probably because: (1) no common integrated
genetic map that includes various types of molecular markers currently exists for Populus [14,21]; (2) the absence of
conservative markers such as SSRs on genetic linkage
maps for comparative mapping between Populus species
[12,22]; and (3) the non-conformity of observed target
traits for QTL mapping.
Understanding of the genetic bases underlying the naturally occurring genetic diversity and detection of genes or
marker loci/QTL in the wild P. simonii population could
assist breeders with MAS in plant breeding programs, thus
making conventional breeding faster and more efficient.
Association mapping is expected to achieve higher mapping resolution as it employs LD based on historical
recombinations [4,5], which is supplemented with markerassisted cloning or direct identification of the target gene
against the genomic sequence [23,24]. Nevertheless, the
power to detect and identify QTL or genes depends on
the strength of the LD between the marker and the QTL
or gene [4,5]. Currently, LD has been characterized to
some extent in P. trichocarpa [25], P. tremula [7,26],
P. nigra [27], and P. balsamifera [28]. Data from 100 short
gene fragments or candidate gene regions of the abovementioned Populus species showed that the LD level was
expected to decay faster even with LD declining to negligible levels in less than several-hundred bases. Although LD
Wei et al. BMC Genetics 2014, 15(Suppl 1):S3
/>
is not constant either across the whole genome or along
single chromosomes [3,4], we should confirm that the
marker density surrounding the GCPM_616-1 and
GCPM_4055-2 markers must be increased greatly so that
the QTL or gene closely linked to traits of interest can be
explored successfully.
Materials and methods
Plant materials and field trials
The 528 individuals sampled from 16 different localities
along the Yellow River basin in China were used in this
study [29]. One-year-old twigs collected from adult trees
during fall and winter of 2007 were transferred to the
greenhouse at Beijing Forestry University, where they
were cut into 15 cm cuttings, placed in plant bags and
stored with sand in a freezer (0°C) until planting in the
following year. The cuttings were planted in a randomized complete block design with three replications
at Xiaotangshan station in Beijing (39.9° E, 116.4° N) on
20 April, 2008. The distance between rows was 1.0 m,
and the spacing between trees within a row was 0.8 m.
Propagation effects such as cyclophysis and topophysis
are known to have important impacts on growth of Populus and could lead to a slightly biased subset of clones
included in the collection [30]. Therefore, we cut the
stems above ground in December after all clones entered
dormancy and started phenotypic measurements in the
following year of growth in the field.
Morphological and physiological traits characterization
and data analysis
A total of 13 morphological traits and 10 physiological
traits, were evaluated in 2009. Most morphological traits
are relevant to leaf characteristics and evaluated following
the methodology developed by He [31]. Three mature
blades on the main stem of each clone in the field
were selected to score leaf traits from July to September.
The measured leaf traits comprised leaf length (LL), leaf
width (LW), leaf area (LA), leaf thickness (LT), leaf petiole
length (LPL), lateral veins length (LVL), lateral veins angle
(LVA), leaf base angle (LBA) and number of leaf teeth
(LTN). The ratios of leaf length to leaf width (LL/LW)
were calculated for each measured leaf. In addition, the
internode length (IL) was estimated by measuring the distance between two adjacent leaf scars along the stem and
was repeated three times for every clone. Furthermore, the
growth traits height (H) and diameter (D) were measured
in November when the leaves were falling. The arithmetic
mean of all individual morphological traits for three or
nine measurements was used for the subsequent data
analysis.
Physiological traits analyses were performed on an
ultraviolet spectrophotometer (UV-2450/2550PC, Shimadzu) and an electrical conductivity meter (EC-4300,
Page 6 of 8
Suntex) using the methods described by Zhang et al [32]
and Gao [33]. Leaves were sampled from clones of each
genotype, then equally mixed and analyzed in the laboratory from August to October. The analyzed traits comprised the following: chlorophyll content (ChlA, ChlB, and
ChlC), superoxide anion radicals content (SAR), peroxidase content (POD), catalase content (CAT), relative conductivity rate (RCR), malondialdehyde content (MDA),
proline content (PRO) and phenylalanine ammonia lyase
content (PAL). For all physiological traits, the same sample
from each genotype was analyzed three times, and the
average was used in the data analysis.
Descriptive statistical parameters such as the mean,
standard deviation (SD), and coefficient of variation (CV)
were determined for each phenotypic trait. Furthermore,
the Shapiro-Wilk normality test (SW), measuring the data
distribution of each trait, was carried out using the univariate procedure in SAS 9.0.
SSR genotyping and physical position assignment
SSR markers were obtained from the International Populus Genome Consortium (IPGC, />ipgc/ssr_resource.htm). Only 19 (14%) of 138 tested SSR
markers showed polymorphisms across a randomly
selected screening panel of 10 individuals [29]. The name,
primer, LG, positions (cM or Mb), repeat motifs, allelic
size and annealing temperature for the 19 polymorphic
SSR markers are listed in Table S3 in Additional file 1. In
addition, an EST-SSR primer within the coding region of
the Dehydration responsive element binding (DREB) gene
developed by Wei et al [34] was also used. Different PCR
amplification conditions were used based on different
annealing temperatures. DNA extraction, PCR amplification, and SSR genotyping followed previously described
protocols [35]. Those alleles with a frequency fewer than
5% in the population were treated as rare alleles.
Assignment of a physical position to the SSR markers followed the method of Ranjan et al [36]. The
SSR sequence information was first obtained from the
PopGenIE In Silico PCR online resource (http://www.
popgenie.org/tool/silico-pcr). Based on BLAST searches
of the SSR primer nucleotide sequence against the genomic sequence, the physical position in the Populus genome was then assigned. In total, 14 markers were
successfully assigned a physical position in the genome.
Phenotype-genotype association analysis
Two covariate parameters, Q and K, were implemented
to evaluate the effects of population structure and relative
kinship, respectively, on phenotypic traits for markertrait associations. The genetic structure (Q) among 528
clones was previously estimated by all 20 SSR markers
(Table S4 in Additional file 1) with the model-based software Structure version 2.3.1 using a burn-in of 100,000
Wei et al. BMC Genetics 2014, 15(Suppl 1):S3
/>
generations, run length of 5,000,000 generations, and 10
independent runs [18]. A model with admixture and correlated allele frequencies was chosen. The tested K values
(equivalent to the number of subpopulations) ranged
from one to 16. Based on the results of these runs, the
ΔK parameter was estimated to identify the optimal
number of clusters as described by Evanno et al [18]. The
relative kinship (K) matrix was also calculated on the
basis of 20 SSR loci using the method proposed by
Ritland [37], which is implemented in the program SPAGeDi version 1.3 [38]. All negative values between individuals were set to 0 [2].
To correct for genetic structure and relatedness in this
P. simonii population, two models were used and compared: (1) the Q model, which controlled for Q; and (2) the
Q+K model, which controlled for both Q and K. The Q
model was performed using a general linear model (GLM),
whereas the Q+K model used a mixed linear model, with
Tassel version 2.1 software [2]. In the Q model, 50,000
time permutations were employed for correction of multiple testing and markers with an adjusted P-value < 0.05
were regarded as significant. In the Q+K model, the
default run parameters with the convergence criterion set
at 1.0 × 10⁻⁴ and the maximum number of iterations set at
200 were used. The qFDR value, an extension of the false
discovery rate (FDR) method [39], was used to correct for
multiple testing. The q values were calculated with the
QVALUE R package using the smoother method [40].
Markers with DFR q < 0.05 were regarded as significant.
Furthermore, to identify superior or inferior alleles that
could be used or ignored in marker-assisted selection
(MAS), allelic effects were estimated in comparison to the
‘’null allele’’ (missing plus rare alleles) for each locus [41].
Funding
Publication of this work was supported by grants from:
the Forestry Public Benefic Research Program (No.
201204306), and Program for Changjiang Scholars and
Innovative Research Team in University (No.
IRT13047), and Projects of the National Natural Science
Foundation of China (No. 30600479, 30872042).
Additional material
Additional file 1: Table S1 Location, sampling site characteristics and
sample sizes for all wild populations of P. simonii. Table S2 Estimates of
the posterior probability of the data for a given K in wild populations of
P. simonii . Table S3 SSR markers used for association mapping in wild
populations of P. simonii . Table S4 Marker loci associated with
morphological and physiological traits among the wild P. simonii
populations based on the Q model
Competing interests
The authors declared that they have no competing interests.
Page 7 of 8
Authors’ contributions
Conceived and designed the experiments: DZ. Performed the experiments:
ZW DZ, QD and GZ. Analyzed the data: ZW, DZ, QD, JZ and BL.
Contributed reagents/materials/analysis tools: ZW and DZ. Wrote the
paper: ZW, QD, and DZ.
This article has been published as part of BMC Genetics Volume 15
Supplement 1, 2014: Selected articles from the International Symposium on
Quantitative Genetics and Genomics of Woody Plants. The full contents of
the supplement are available online at />bmcgenet/supplements/15/S1.
Authors’ details
1
National Engineering Laboratory for Tree Breeding, College of Biological
Sciences and Technology, Beijing Forestry University, No. 35, Qinghua East
Road, Beijing 100083, P. R. China. 2Key Laboratory of Genetics and Breeding
in Forest Trees and Ornamental Plants, College of Biological Sciences and
Technology, Beijing Forestry University, No. 35, Qinghua East Road, Beijing
100083, P. R. China.
Published: 20 June 2014
References
1. Lander ES, Botstein D: Mapping Mendelian factors underlying
quantitative traits using RFLP linkage maps. Genetics 1989, 121:185-199.
2. Yu J, Pressoir G, Briggs WH, Vroh Bi I, Yamasaki M, Doebley JF,
McMullen MD, Gaut BS, Nielsen DM, Holland JB, Kresovich S, Buckler ES: A
unified mixed-model method for association mapping that accounts for
multiple levels of relatedness. Nat Gene 2006, 38:203-208.
3. Zhu C, Gore M, Buckler ES, Yu J: Status and prospects of association
mapping in plants. Plant Genome 2008, 1:5-20.
4. Flint-Garcia SA, Thornsberry JM, Buckler ES: Structure of linkage
disequilibrium in plants. Annu Rev Plant Bio 2003, 54:357-374.
5. Gaut BS, Long AD: The lowdown on linkage disequilibrium. Plant Cell
2003, 15:1502-1506.
6. Du Q, Pan W, Xu B, Li B, Zhang D: Polymorphic simple sequence repeat
(SSR) loci within cellulose synthase (PtoCesA) genes are associated with
growth and wood properties in Populus tomentosa. New Phytol 2013,
197:763-776.
7. Ingvarsson PK, Garcia MV, Luquez V, Hall D, Jansson S: Nucleotide
polymorphism and phenotypic associations within and around the
phytochrome B2 locus in European aspen (Populus tremula, Salicaceae).
Genetics 2008, 178:2217-2226.
8. Ma XF, Hall D, Onge KRS, Jansson S, Ingvarsson PK: Genetic differentiation,
clinal variation and phenotypic associations with growth cessation
across the Populus tremula photoperiodic pathway. Genetics 2010,
186:1033-1044.
9. Wei L, Jansson S, Xiaoyang C: Association analysis between autumn
senescence and SNPs in the candidate genes of Populus tremula. Sci
Silva Sin 2010, 46:42-48.
10. Du Q, Pan W, Tian J, Li B, Zhang D: The UDP-Glucuronate Decarboxylase
Gene Family in Populus: Structure, Expression, and Association Genetics.
PLoS ONE 2013, 8(4):e60880, doi:10.1371/journal.pone.0060880.
11. Yin TM, DiFazio SP, Gunter LE, Zhang XY, Sewell MM, Woolbright SA,
Allan GJ, Kelleher CT, Douglas CJ, Wang MX, Tuskan GA: Genome structure
and emerging evidence of an incipient sex chromosome in Populus.
Genome Res 2008, 18:422-430.
12. Pakull B, Groppe K, Meyer M, Markussen T, Fladung M: Genetic linkage
mapping in aspen (Populus remula L. and Populus tremuloides Michx.).
Tree Genet Genomes 2009, 5:505-515.
13. Tuskan GA, Gunter LE, Yang ZM, Yin TM, Sewell MM, DiFazio SP:
Characterization of microsatellites revealed by genomic sequencing of
Populus trichocarpa. Can J For Res 2004, 34:85-93.
14. Yin TM, Zhang XY, Gunter LE, Li SX, Wullschleger SD, Huang MR, Tuskan GA:
Microsatellite primer resource for Populus developed from the mapped
sequence scaffolds of the Nisqually-1 genome. New Phytol 2009,
181:498-503.
15. Lv W: Populus simonii in North of China. Ningxia, Ningxia People’s Press;
2002.
16. Evanno G, Regnaut S, Goudet J: Detecting the number of clusters of
individuals using the software STRUCTURE: a simulation study. Mol Ecol
2005, 14:2611-2620.
Wei et al. BMC Genetics 2014, 15(Suppl 1):S3
/>
17. Wei ZZ, Du QZ, Zhang JF, Li BL, Zhang DQ: Genetic diversity and
population structure in Chinese indigenous Poplar (Populus simonii)
populations using microsatellite markers. Plant Mol Biol Rep 2013,
31(3):620-632.
18. Pritchard JK, Stephens M, Donnelly P: Inference of population structure
using multilocus genotype data. Genetics 2000, 155:945-959.
19. Yang XH, Yan JB, Shah T, Warburton ML, Li Q, Li L, Gao YF, Chai YC, Fu ZY,
Zhou Y, Xu ST, Bai GH, Meng YJ, Zheng YP, Li JS: Genetic analysis and
characterization of a new maize association mapping panel for
quantitative trait loci dissection. Theor Appl Genet 2010, 121:417-431.
20. Shao YF, Jin L, Zhang G, Lu Y, Shen Y, Bao JS: Association mapping of
grain color, phenolic content, flavonoid content and antioxidant
capacity in dehulled rice. Theor Appl Genet 2011, 122:1005-1016.
21. Sari-Gorla M, Krajewski P, Di Fonzo N, Villa M, Frova C: Genetic analysis of
drought tolerance in maize by molecular markers. II. Plant height and
flowering. Theor Appl Genet 1999, 99:289-295.
22. Yin TM, DiFazio SP, Gunter LE, Riemenschneider D, Tuskan GA: Large-scale
heterospecific segregation distortion in Populus revealed by a dense
genetic map. Theor Appl Genet 2004, 109:451-463.
23. Yin TM, Zhu QH, Huang MR, Wang MX: History and progress of the
genomics studies in the model system of perennial plant species. Acta
Phytotaxo Sin 2004, 42:464-479.
24. Gan SM, Su XH: Progress in research on forest tree genomics. J Plant
Physiol Mol Biol 2006, 32:133-142.
25. Yin TM, DiFazio SP, Gunter LE, Jawdy SS, Boerjan W, Tuskan GA: Genetic
and physical mapping of Melampsora rust resistance genes in Populus
and characterization of linkage disequilibrium and flanking genomic
sequence. New Phytol 2004, 164:95-105.
26. Ingvarsson PK: Nucleotide polymorphism and linkage disequilibrium
within and among natural populations of European aspen (Populus
tremula L. Salicaceae). Genetics 2005, 169:945-953.
27. Chu YG, Su XH, Huang QJ, Zhang XH: Patterns of DNA sequence variation
at candidate gene loci in black poplar (Populus nigra L.) as revealed by
single nucleotide polymorphisms. Genetica 2009, 137:141-150.
28. Olson MS, Robertson AL, Takebayashi N, Silim S, Schroeder WR, Tiffin P:
Nucleotide diversity and linkage disequilibrium in balsam poplar
(Populus balsamifera). New Phytol 2010, 186:526-536.
29. Wei ZZ: Evaluation of genetic resources and identification of SSRs
associated with important traits in Populus Simonii. PhD thesis, Beijing
Forestry University, China 2010.
30. Dunin JM, Heilman PE, Stetixer RF: Genetic variation and productivity of
Populus trichocaqa and its hybrids .V. The influence of ramet position on
year growth variables. Can J For Res 1992, 22:849-857.
31. He CZ: Study on genetic diversity and origin of Populus Tomentosa Carr.
PhD thesis, Beijing Forestry University, China 2005.
32. Zhang ZL, Zhai WJ: Plant physiology laboratory instruction. Higher
Education Press, Beijing; 2003.
33. Gao JF: Experimental guidance for plant physiology. Higher Education
Press, Beijing; 2006.
34. Wei ZZ, Du QZ, Guo Q, Zhang JF, Li BL, Zhang DQ: DREB gene and its
application in analyzing population structure in Populus simonii. Chin Bull
Bot 2010, 45:556-565.
35. Schoot JVD, Pospíšková M, Vosman B, Smulders MJM: Development and
characterization of microsatellite markers in black poplar (Populus nigra
L.). Theor Appl Genet 1999, 101:317-322.
36. Ranjan P, Yin TM, Zhang XY, Kalluri UC, Yang XH, Jawdy S, Tuskan GA:
Bioinformatics-based identification of candidate genes from QTLs
associated with cell wall traits in Populus. Bioenerg Res 2010, 3:172-182.
37. Ritland K: Estimators for pairwise relatedness and individual inbreeding
coefficients. Genet Res 1996, 67:175-185.
38. Hardy OJ, Vekemans X: SPAGEDi: a versatile computer program to
analyze spatial genetic structure at the individual or population levels.
Mol Ecol Notes 2002, 2:618-620.
39. Benjamini Y, Hochberg Y: Controlling the false discovery rate-a practical
and powerful approach to multiple testing. J R Stat Soc B 1995,
57(1):289-300.
40. Storey JD, Tibshirani R: Statistical significance for genome-wide studies.
Proc Natl Acad Sci 2003, 100:9440-9445.
41. Breseghello F, Sorrells ME: Association mapping of kernel size and milling
quality in wheat (Triticum aestivum L.) cultivars. Genetics 2006,
172:1165-1177.
Page 8 of 8
doi:10.1186/1471-2156-15-S1-S3
Cite this article as: Wei et al.: Association mapping for morphological
and physiological traits in Populus simonii. BMC Genetics 2014
15(Suppl 1):S3.
Submit your next manuscript to BioMed Central
and take full advantage of:
• Convenient online submission
• Thorough peer review
• No space constraints or color figure charges
• Immediate publication on acceptance
• Inclusion in PubMed, CAS, Scopus and Google Scholar
• Research which is freely available for redistribution
Submit your manuscript at
www.biomedcentral.com/submit