Báo cáo sinh học: " Mapping of quantitative trait loci for flesh colour and growth traits in Atlantic salmon (Salmo salar)" ppt
Bạn đang xem bản rút gọn của tài liệu. Xem và tải ngay bản đầy đủ của tài liệu tại đây (1.21 MB, 14 trang )
Genetics
Selection
Evolution
Baranski et al. Genetics Selection Evolution 2010, 42:17
/>Open Access
RESEARCH
© 2010 Baranski et al; licensee BioMed Central Ltd. This is an Open Access article distributed under the terms of the Creative Commons
Attribution License ( which permits unrestricted use, distribution, and reproduction in
any medium, provided the original work is properly cited.
Research
Mapping of quantitative trait loci for flesh colour
and growth traits in Atlantic salmon (
Salmo salar
)
Matthew Baranski*
1,3
, Thomas Moen
1,3,4
and Dag Inge Våge
2,3
Abstract
Background: Flesh colour and growth related traits in salmonids are both commercially important and of great
interest from a physiological and evolutionary perspective. The aim of this study was to identify quantitative trait loci
(QTL) affecting flesh colour and growth related traits in an F2 population derived from an isolated, landlocked wild
population in Norway (Byglands Bleke) and a commercial production population.
Methods: One hundred and twenty-eight informative microsatellite loci distributed across all 29 linkage groups in
Atlantic salmon were genotyped in individuals from four F2 families that were selected from the ends of the flesh
colour distribution. Genotyping of 23 additional loci and two additional families was performed on a number of
linkage groups harbouring putative QTL. QTL analysis was performed using a line-cross model assuming fixation of
alternate QTL alleles and a half-sib model with no assumptions about the number and frequency of QTL alleles in the
founder populations.
Results: A moderate to strong phenotypic correlation was found between colour, length and weight traits. In total, 13
genome-wide significant QTL were detected for all traits using the line-cross model, including three genome-wide
significant QTL for flesh colour (Chr 6, Chr 26 and Chr 4). In addition, 32 suggestive QTL were detected (chromosome-
wide P < 0.05). Using the half-sib model, six genome-wide significant QTL were detected for all traits, including two for
flesh colour (Chr 26 and Chr 4) and 41 suggestive QTL were detected (chromosome-wide P < 0.05). Based on the half-
sib analysis, these two genome-wide significant QTL for flesh colour explained 24% of the phenotypic variance for this
trait.
Conclusions: A large number of significant and suggestive QTL for flesh colour and growth traits were found in an F2
population of Atlantic salmon. Chr 26 and Chr 4 presented the strongest evidence for significant QTL affecting flesh
colour, while Chr 10, Chr 5, and Chr 4 presented the strongest evidence for significant QTL affecting growth traits
(length and weight). These QTL could be strong candidates for use in marker-assisted selection and provide a starting
point for further characterisation of the genetic components underlying flesh colour and growth.
Background
Carotenoid uptake and subsequent deposition in the
muscle of fish such as salmon, trout and char is a herita-
ble quantitative trait that is commercially very important
for the aquaculture industry [1-3]. Astaxanthin is an
expensive ingredient in fish feed (5-10% of feed cost) and
muscle deposition of colour in the fish is relatively poor
[4,5]. Market preference for red-fleshed fish has made
flesh colour an important trait for breeding goals in
Atlantic salmon selection programs. However, at present
flesh colour cannot be accurately measured on live adult
individuals. Consequently, no within-family selection can
be performed and only part of the genetic variation of the
trait can be exploited. Marker assisted selection (MAS)
using markers linked to quantitative trait loci (QTL) for
flesh colour represents an excellent way to improve the
efficiency of selection. Heritabilities for flesh colour in
Atlantic salmon tend to be low when subjective colour
card measurements are used and medium when measure-
ments are based on instrumental methods, with a
reported range generally between 0.1 and 0.2 [6,7].
The extent of genetic control of pigmentation in salmo-
nids has not been conclusively demonstrated. A cross
between extremely strong- and weak-coloured popula-
tions of Chinook salmon exhibited a phenotypic distribu-
* Correspondence:
1
Nofima Marin, P.O. Box 5010, 1432 Ås, Norway
Full list of author information is available at the end of the article
Baranski et al. Genetics Selection Evolution 2010, 42:17
/>Page 2 of 14
tion originally explained by a model involving two loci,
each with two alleles [8]. The proposed model could not
explain the anomalous red:white ratios among the prog-
eny of one male parent. A recent study has shown that
this dataset could be fully explained by a model with one
locus and three alleles [9]. In another study [6], a single
locus SCAR marker with a relatively strong association to
flesh colour in Coho salmon has been identified, suggest-
ing that the genetic control of flesh colour may be con-
trolled by relatively few loci with large effects, rather than
a large polygenic effect. A dynamic model of carotenoid
metabolism in salmonids, based on ordinary differential
equations, has identified the uptake process of carotenoid
over the muscle membrane as a potential important
source of genetic variation [10]. Given that this model
mimics the real situation, the existence of key regulatory
sites could possibly suggest the presence of loci with rela-
tively large effects. However this does not necessarily
mean that the trait will be regulated via polymorphisms
with major effects within the genes encoding these sites.
An F2 population is a useful design to detect loci affect-
ing QTL when two phenotypically distinct populations
are crossed [11]. In Atlantic salmon, such populations are
relatively rare, and the production of divergent or inbred
lines is a long term undertaking due to the long genera-
tion interval. However, isolated populations of Atlantic
salmon do exist in Norway, and show clear evidence of
substantial phenotypic differences from production fish
that have been under artificial selection for several gener-
ations. The Bleke salmon is a freshwater Atlantic salmon
population inhabiting the inner part of the Byglandsfjord
in southern Norway. This slow-growing ice age relict was
isolated from sea-migrating populations about 9000 years
ago because of a waterfall barrier (Vigelandsfoss) [12].
Female Bleke salmon become sexually mature after 4-5
years of freshwater life at a size of about 25 cm fork length
[13] compared to that of 70-120 cm in ancestral migra-
tory populations. In 1999, Bleke salmon were crossed to
commercial Norwegian salmon selected for fast growth
and high colour. The resulting F1 were then crossed to
produce an F2 mapping population suitable for the detec-
tion of QTL for flesh colour, growth rate and other traits
diverging between the parental populations. The aim of
our study was to identify QTL affecting flesh colour and
growth traits in this F2 population.
Methods
Mapping population
The mapping population consisted of six F2 families that
originated from a cross between two divergent popula-
tions, the landlocked Byglands Bleke population and a
commercial breeding population under selection (Aqua
Gen AS). In 1995, three Bleke salmon were crossed with
three commercial Norwegian salmon, forming three full-
sib families. Five F1 males from one family and five F1
females from another family were subsequently crossed
to produce five full-sib F2 families, in addition to a sixth
F2 family that was sired by a male from the third F1 fam-
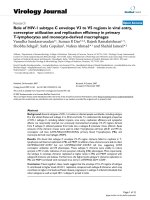
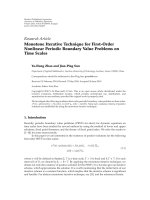
ily. The pedigree is depicted in Figure 1.
Phenotypic data
F2 progeny were slaughtered at three years of age and had
the following traits recorded: length (L), body weight
(BW), slaughter weight (SW), and colour (C) in Salmo-
Fan™ colour units. In addition, Fulton's condition factor
(K), a measure of a fish's girth, was calculated as (BW × L
3
× 100) [14] and dressing percentage (D%) was calculated
as ((BW-SW)/BW × 100). Samples that were paler than
the palest colour value (20) on the SalmoFan were given
the score 19. Not all the individuals had sufficient gonad
developed to be sexed at sampling. For the unsexed prog-
eny, paternal allelic segregation at the microsatellite locus
Ssa202DU, known to be tightly linked to the sex-deter-
mining locus [15], was used to divide the progeny into
males and females. The appropriate marker phase was
established from the sexed progeny in each family.
Genotyping
Fifty progeny from each extreme of the colour distribu-
tion were selected from three F2 families (8B, 9B and
10B), and all 76 progeny from a fourth family (10A) were
selected for genotyping. Corrected values for colour
based on the fish size correlation were not used in this
selection in order to provide sufficient power for QTL
detection for the other traits. Due to differences in prog-
eny numbers between the families, this represented selec-
tive genotyping fractions (both extremes) of 44%, 35%,
35% and 100% respectively for families 8B, 9B, 10B and
10A (Table 1). Following the initial QTL analysis, 384
additional individuals were selected from the remaining
extremes of the colour distribution from families (8B, 9B
Figure 1 Pedigree of the mapping population. Founding genera-
tion (P) consisting of Bleke males (Bleke) and Aqua Gen females (AGen).
P31 P11
'ĞŶ ůĞŬĞ
P34 P14 P35 P15
M1
M2
M3
M5
M6
F6 F4
M4
F5
F3
F2
F1
P
F1
F2
Fam 8B
Fam 9B
Fam 9A
Fam 8A
Fam 10A
Fam 10B
'ĞŶ ůĞŬĞ 'ĞŶ ůĞŬĞ
Baranski et al. Genetics Selection Evolution 2010, 42:17
/>Page 3 of 14
and 10B) as well as 384 individuals from two additional
families (8A and 9A) for subsequent genotyping at puta-
tive QTL.
DNA extraction was carried out from muscle tissue
samples using the DNeasy 96 kit (QIAGEN) following the
manufacturer's protocol. The majority of microsatellite
markers used in this study were chosen from the SAL-
MAP microsatellite map of Atlantic salmon [16], covering
all 29 linkage groups (chromosomes). The nomenclature
of chromosomes follows that introduced by Philips et al.
[17]. In total, 128 informative microsatellite loci were ini-
tially genotyped, including duplicated loci amplified from
the same primer pair (see additional file 1 for names and
female map positions). Following the initial analysis, 23
additional loci were genotyped. The microsatellite mark-
ers were distributed across 32 PCR multiplexes that were
subsequently combined into 16 multiplexes for capillary
electrophoresis. Primer sequences and multiplex infor-
mation are available on request. Polymerase chain reac-
tions (PCR) were performed in volumes of 5 μL, using
0.25 units of AmpliTaq Gold (Applied Biosystems), 250
μM dNTP mix, 1.5 mM MgCl
2
, 0.25-1 pmol of each
primer (depending on amplification efficiency of each
marker in multiplex), 0.25 μL DMSO, and 5 ng DNA tem-
plate. PCR cycling conditions were 95°C for 10 min, 35
cycles at 94°C for 30 seconds, 54°C for 1 min, and 72°C for
1 min, followed by a final extension at 60°C for 45 min.
The lengths of the fluorescent PCR products were deter-
mined relative to the LIZ500 size standard (Applied Bio-
systems) on a 3730 DNA Analyzer (Applied Biosystems),
using GeneMapper 4.0 (Applied Biosystems) software for
allele calls.
Construction of linkage map
Since samples of the F1 parents were not available, geno-
types had to be inferred from the grandparent and prog-
eny genotypes. A custom Visual Basic for Applications
program in Excel was used for this task. In situations
where it was equally likely for a parental genotype to fit
the sire or dam, then, the genotype was arbitrarily
applied, the linkage relationship to adjacent markers
examined, and finally the parental genotypes reversed if
necessary (i.e. if the marker was not linked when it should
have been). Separate male and female maps were con-
structed due to large sex-specific recombination differ-
ences observed in salmonids [18]. Marker grouping and
initial marker ordering was done with Joinmap 3.0 [19]. A
Joinmap input file was made for each mapping parent (in
double haploid format), containing information on alleles
inherited from that parent only. Marker grouping was
performed at a minimum LOD score of 4.0. Following
marker grouping, homologous linkage groups from each
sire and each dam were integrated into single sex-specific
maps. The data was examined for unlikely double recom-
binants and for inconsistencies in marker order between
parents using a custom VBA program in Excel (available
by request from the authors). Occurrences of double
recombinants over small distances were checked for
genotyping errors. After marker orders and potential
genotype errors had been verified, the final maps were
constructed using Joinmap. The Kosambi mapping func-
tion was used.
Interval mapping analyses
Interval mapping using regression methods was applied
to two different genetic models: (1) line-cross analysis fol-
lowing Haley et al. [20] assuming founder lines to be fixed
for different QTL alleles and (2) half-sib model [21], mak-
ing no assumptions about the fixation of QTL alleles in
the founder lines. In the line-cross model, QTL effects are
partitioned into additive and dominance effects. The
additive effect was estimated as half the difference
between the phenotypic values for homozygotes for the
Aqua Gen and Bleke alleles at the QTL, with a positive or
a negative sign indicating that the Aqua Gen or the Bleke
allele, respectively, increased the value of the trait score.
The dominance effect was calculated as the phenotypic
deviation of the heterozygotes from the mean of the two
homozygotes. GridQTL software [22] was used for QTL
analyses. Due to the significant effect of sex on the traits
under study, sex was included as a fixed effect for the
analysis in both models, based on records of sexed indi-
viduals and marker segregation at Ssa202DU. In the ini-
tial QTL analysis including four families, male and female
mapping parents were analysed separately under the half-
sib model. In the subsequent analysis with the larger data
set, a joint analysis of male and female mapping parents
in the half-sib model was performed by duplicating the
dataset prior to analysis, with the designation of parents
as sire or dams inverted in the duplicate. In the initial
Table 1: Number of F2 progeny in each family and selective
genotyping fractions
Family Total indiv. Sel 1 (SG%)
1
Sel 1+2 (SG%)
2
8A 300 - 252 (84)
8B 228 100 (44) 221 (97)
9A 157 - 132 (84)
9B 287 100 (35) 232 (81)
10A 76 76 (100) 76 (100)
10B 286 100 (35) 225 (79)
1
Number of animals selected from each family for initial genome
scan (selective genotyping percentage across both tails)
2
Number of animals selected from each family after extra animals
were added in the second round of genotyping (selective
genotyping percentage across both tails)
Baranski et al. Genetics Selection Evolution 2010, 42:17
/>Page 4 of 14
QTL analysis, length was included as a covariate for the
analysis of colour, however in the subsequent analysis,
body weight was used as the covariate. Full-sib family was
fitted as a fixed effect in the line-cross model in the larger
dataset (but was omitted in the initial analysis).
P values were calculated for all trait-by-chromosome
combinations with the significance of the peak F-statistic
(putative QTL) estimated after 10,000 chromosome-wide
permutation tests [23]. The chromosomal location of the
QTL was taken as the position with the highest F-statis-
tic. Two levels of significance are reported for the
detected QTL. A QTL was found to be genome-wide sig-
nificant if the chromosome-wide significance level was
smaller than 0.05 * 29, a Bonferroni correction based on
the number of linkage groups examined. QTL that were
chromosome-wide significant at P < 0.01 and P < 0.05 but
not genome-wide significant were regarded as 'suggestive'
QTL. Because this was an initial scan, and also for ease of
comparison of the results with those of other studies (as
suggested by [24]), correction for multiple traits was not
performed. The proportion of phenotypic variance
explained by the QTL using the half-sib model was calcu-
lated as 4*(1-MS
full
/MS
reduced
) where MS
full
is the mean
squared error of the full model, accommodating one QTL
effect for each informative mapping parent, while MS
re-
duced
is the corresponding mean squared error of the
reduced model omitting QTL effects [21]. Correction for
overestimation of QTL effects due to selective genotyping
for flesh colour was not performed due to the different
selective genotyping fractions in each family and to the
fact that almost all individuals within each family were
ultimately genotyped for the four linkage groups that
were further investigated. In addition, this correction was
not applied for the other traits due to the fact that prog-
eny were only selected from the extremes of the colour
distribution and not for these traits (however, the positive
correlation between length, weight and colour will mean
that some selective genotyping has taken place, and some
QTL effect overestimation has occurred). Confidence
intervals (CI) were estimated for each genome-wide sig-
nificant QTL using the bootstrap method [25] and 10,000
iterations.
Results
Phenotypic data analysis
Analysis of raw phenotypic data in the F2 population
revealed that all traits exhibited substantial levels of phe-
notypic variation (Table 2), and strong phenotypic corre-
lations were observed between numerous traits (Table 3).
Flesh colour was moderately to strongly correlated to
length (0.76), body weight (0.75) and slaughter weight
(0.74). Colour was also moderately correlated to K factor
(0.60) and weakly correlated to dressing percentage
(0.20). There were significant differences in all trait aver-
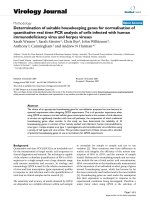
ages between the two sexes (P < 0.001). A total of 6% of all
F2 progeny had flesh colour scores below the minimum
SalmoFan value of 20, and were therefore given the score
19 for this trait (Figure 2).
QTL results - Initial genome scan
An initial genome scan was performed using four of the
six full-sib families, for the traits flesh colour, body
weight and length. Under the across family half-sib
model, genome-wide significant QTL were identified for
flesh colour on Chr 4, for body weight on Chr 4 and for
length on Chr 10 and Chr 4 (Table 4). All QTL were
detected in the sire-based analysis. Under the line-cross
model, genome-wide significant QTL were identified for
flesh colour on Chr 4, for body weight on Chr 5 and Chr 4
and for length on Chr 10 and Chr 4 (Table 4). Numerous
additional suggestive QTL were also detected. Genome-
wide significance in either model was used as criteria to
select chromosomes 10, 5, and 4 for genotyping in addi-
tional samples. In addition, suggestive evidence for a
colour QTL on Chr 26 under both models was used as
criteria for selection of Chr 26 for additional genotyping.
Seven hundred and sixty-two additional animals were
genotyped for markers on chromosomes 10, 5, 4, and 26.
To improve coverage, 23 additional microsatellites were
genotyped for chromosomes 26 and 4 (see Additional File
1).
QTL results - Full dataset with the line-cross model
In total, 13 genome-wide significant QTL were detected
for all traits using the line-cross model (Table 5). Five
QTL were significant at the chromosome-wide P < 0.01
level, and 27 were significant at the chromosome-wide P
< 0.05 level (suggestive QTL). Of the 45 significant or
suggestive QTL detected, 40 had primarily additive
effects, whilst five had larger dominance effects. For flesh
colour, three genome-wide significant QTL were
detected, two with primarily additive (Chr 26 and Chr 4)
and one (Chr 6) with primarily dominance effects.
Numerous linkage groups had multiple QTL mapping to
them, particularly the strongly correlated length, body
weight and slaughter weight traits. Genome-wide signifi-
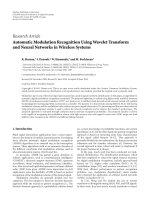
cant QTL for colour mapped uniquely to Chr 26 (Figure
3) and Chr 6, and on Chr 4 a genome-wide significant
QTL peak (Figure 4) was 53 cM away from genome-wide
significant QTL peaks for length and weight (Figure 5).
Genome-wide significant QTL for length, body weight
and slaughter weight were confirmed on Chr 10 (Figure
6) and Chr 5 (Figure 7). Based on the sign of the additive
effect, only three of the 45 QTL were identified where the
allele derived from the Bleke line increased the value of
the trait score (positive additive effect). 95% QTL confi-
dence intervals were large, covering nearly the entire
chromosomes.
Baranski et al. Genetics Selection Evolution 2010, 42:17
/>Page 5 of 14
QTL results - Full dataset with the half-sib model
In total, six genome-wide significant QTL were detected
for all traits using the half-sib model (Table 6). Of the 41
suggestive QTL identified, 16 QTL were significant at the
chromosome-wide P < 0.01 level, and 25 were significant
at the P < 0.05 level. Like the line-cross model, numerous
linkage groups had multiple QTL mapping to them, with
relatively conserved positions for the strongly phenotypi-
cally correlated traits. A genome-wide significant QTL
for flesh colour mapped to Chr 26 (Figure 3), where no
QTL for other traits was detected, and on Chr 4 a
genome-wide significant flesh colour QTL peak (Figure
4) was 56 cM away from QTL peaks for length and
weight. Together, the two genome-wide significant QTLs
for flesh colour on Chr 26 and Chr 4 explained 24% of the
phenotypic variance for this trait. Genome-wide signifi-
cant and suggestive QTL were also detected for length,
body weight and slaughter weight on Chr 10 (Figure 6)
and Chr 5 (Figure 7). The number of parents showing sta-
tistically significant evidence for QTL segregation ranged
from one to six (Table 6 and Additional File 2). In most
cases, 95% QTL confidence intervals covered nearly the
entire chromosome, however the flesh colour QTL inter-
val on Chr 26 was much narrower (38-47 cM).
QTL results - Comparison of two models
All the genome-wide significant QTL mapped using the
line-cross model were genome-wide or chromosome-
wide significant (P < 0.01) under the half-sib model, with
the exceptions of the QTL for flesh colour on Chr 6 and
the QTL for length and body weight on Chr 5. Estimates
for the amount of phenotypic variance explained by each
QTL in the line-cross model were generally much lower
than in the half-sib model: 12.6% vs. 3.7% for colour on
Chr 26; 11.3% vs. 1.3% for colour on Chr 4; 6.2% vs. 1.4%
for body weight on Chr 4; 4.8% vs. 2.3% for length on Chr
10. Numerous suggestive QTL were uniquely detected by
both models (Tables 5 and 6).
Discussion
This study used an F2 resource population to identify
numerous significant and suggestive QTL for flesh
colour, growth and body composition traits in Atlantic
salmon. Using line-cross and half-sib regression analyses,
genome-wide significant QTL for flesh colour were
detected on Chr 6, Chr 26 and Chr 4. Assuming a herita-
bility between 0.1 and 0.2 [6,7,26], these QTL could
underlie a large portion of the genetic variance for the
trait. Salmonids with access to astaxanthin containing
diets accumulate carotenoids as they grow, and this accu-
Table 2: Phenotypic averages of F2 families. Phenotypic averages and standard deviations (in parentheses) for traits
recorded in the six F2 families
Family L (cm) BW (kg) SW (g) K SL (%) C
1
8A 62.6 (8.4) 3.39 (1.34) 3.03 (1.21) 1.38 (0.14) 10.6 (1.6) 25.7 (2.3)
8B 60.0 (8.1) 2.95 (1.25) 2.65 (1.13) 1.36 (0.16) 10.4 (1.8) 25.4 (2.8)
9A 54.8 (11.0) 2.20 (1.44) 2.00 (1.32) 1.3 (0.24) 9.2 (2.0) 23.7 (2.7)
9B 57.6 (9.1) 2.60 (1.29) 2.32 (1.16) 1.4 (0.20) 10.7 (2.2) 24.7 (2.5)
10A 55.7 (10.6) 2.30 (1.55) 2.07 (1.39) 1.3 (0.25) 10.1 (1.8) 23.5 (2.5)
10B 59.3 (8.8) 2.96 (1.26) 2.67 (1.14) 1.4 (0.16) 10.0 (3.3) 25.0 (2.4)
1
SalmoFan colour score units
Table 3: Phenotypic correlations between carcass traits.
Phenotypic correlations between carcass traits
BW SW K D% C
L 0.96 0.96 0.49 0.12 0.76
BW 1.00 0.58 0.10 0.75
SW 0.56 0.06 0.74
K 0.36 0.60
D% 0.20
Figure 2 Colour frequency distribution. Frequency distribution of
colour scores over the six F2 families.
Baranski et al. Genetics Selection Evolution 2010, 42:17
/>Page 6 of 14
mulation in muscle continues till the fish approach sexual
maturity [27]. The ratio of absorbed to non-absorbed car-
otenoid increases as the fish grows, and as a result, the
concentration of fillet astaxanthin normally increases
with increasing fish size, which is consistent with the
strong positive correlation between fish size and flesh
colour observed in this study. Consequently, a large pro-
portion of the observed variance in flesh colour can be
explained by body size, reducing the power of QTL detec-
tion for this trait. Despite this, highly significant QTL
were detected for flesh colour after the inclusion of body
weight as a covariate, indicating that there is measurable
genetic variation present in this population. Relatively
few QTL studies have been carried out on flesh colour
traits in salmonids. Araneda et al. [6] identified a domi-
nant SCAR marker associated with colour in Coho
salmon (Oncorynchus kisutch), and Houston et al. [28]
found suggestive evidence for QTL in Atlantic salmon on
chromosomes 16, 18 and 23. None of these QTL reached
significance in our study, although chromosomes 18 and
23 reached near chromosome-wide significance. Given
the relatively low number of independent loci identified
in these studies, and the small number of genome-wide
significant QTL found in our study, genetic control of
flesh colour in salmonids may be explained by relatively
few loci of large effect. However, further validation of the
suggestive QTL may reveal that they contribute to a more
polygenic effect.
Dahl [12] has reported that the juveniles of the Bleke
strain remain in the rivers for two to four years until they
Table 4: Initial QTL analysis using half-sib and line cross models
Half-sib modela
Line-cross model
Trait Chr F Trait Chr F
Flesh colour 4 18.15*** Flesh colour 4 12.31***
26 3.92** 6 5.64*
5 3.38* 5 5.3*
1 3.13* 26 5.27*
93.02* 75.05*
19 2.85* 2 4.85*
82.78*
13 2.63*
Body weight 4 16.21*** Body weight 4 15.68***
5 3.84** 5 7.91***
16 3.79** 10 7.57**
10 3.59** 7 6.64**
13 3.21* 18 3.95*
23.07*
72.92*
11 2.62*
Length 4 14.41*** Length 4 17.9***
10 4.58*** 10 10.26***
13 4.01** 5 7.91**
16 4.01** 11 5.4**
53.7** 74.83*
11 3.27* 18 3.95*
22.83*
72.81*
a Sire-based analysis
*** Genome-wide significant QTL (P < 0.05)
** Chromosome-wide significant QTL (P < 0.01)
* Chromosome-wide significant QTL (P < 0.05)
Baranski et al. Genetics Selection Evolution 2010, 42:17
/>Page 7 of 14
Table 5: Quantitative trait loci (QTL) mapped using the F2 line cross regression analysis
Trait Chr Pos (cM) F-ratio Additive effect
(SE)
Dominance effect (SE) Det
HS?a
Flesh colour 26 33 22.73*** 0.56 (0.08) 0.02 (0.14) Y
6 109 9.47*** -0.366 (0.151) -0.916 (0.267) Y
b
4 57 8.65*** 0.279 (0.079) -0.254 (0.124) Y
5 16 5.69* 0.266 (0.082) -0.091 (0.131) Y
b
20 41 5.35* -0.428 (0.131) 0 (0.201) Y
b
7 8 4.96* 0.415 (0.133) -0.049 (0.207) Y
1 0 4.94* 0.04 (0.125) -0.57 (0.185) Y
b
10 18 4.92* 0.227 (0.079) -0.156 (0.12)
Body weight 5 19 14.09*** 0.321 (0.064) -0.132 (0.1) Y
10 19 12.22*** 0.345 (0.07) 0.074 (0.106) Y
4 4 8.96*** 0.26 (0.064) 0.152 (0.099) Y
7 4 5.83** 0.332 (0.105) -0.155 (0.157) Y
18 16 4.69* 0.343 (0.128) -0.331 (0.216)
29 0 4.39* 0.294 (0.102) 0.089 (0.152) Y
22 0 4.12* 0.266 (0.1) -0.133 (0.142)
13 58 4.07* 0.15 (0.061) -0.121 (0.091) Y
19 0 3.43* 0.267 (0.102) -0.051 (0.143)
Length 10 19 14.34*** 2.545 (0.479) 0.539 (0.726) Y
4 4 12.05*** 2.049 (0.433) 1.247 (0.673) Y
5 18 11.32*** 1.938 (0.44) -1.03 (0.7) Y
11 17 7.44*** 2.204 (0.605) 0.931 (1.219) Y
13 59 5.12* 1.22 (0.405) -0.554 (0.596) Y
19 0 4.36* 2.055 (0.696) -0.412 (0.979)
2 0 4.15* -0.994 (0.932) 4.016 (1.59)
7 6 4.09* 1.824 (0.727) -1.293 (1.116) Y
29 0 4.07* 1.911 (0.694) 0.739 (1.036)
22 0 3.5* 1.622 (0.681) -1.013 (0.973)
Slaughter weight 5 19 13.56*** 0.285 (0.058) -0.116 (0.091) Y
10 19 12.24*** 0.311 (0.063) 0.069 (0.096) Y
4 4 9.36*** 0.241 (0.057) 0.137 (0.089) Y
7 4 5.92** 0.303 (0.095) -0.135 (0.142) Y
18 16 4.67* 0.313 (0.116) -0.285 (0.195)
13 59 4.43* 0.151 (0.054) -0.066 (0.079)
29 0 4.37* 0.265 (0.092) 0.079 (0.137)
22 0 4.09* 0.242 (0.09) -0.108 (0.128)
K-factor 24 48 6.69** 0.044 (0.016) 0.068 (0.028)
20 52 6.86** -0.052 (0.014) 0.003 (0.02) Y
7 8 6.12** 0.052 (0.015) 0.021 (0.023) Y
5 31 6.15* 0.026 (0.008) -0.017 (0.012)
10 19 5.14* 0.025 (0.01) -0.029 (0.015)
Baranski et al. Genetics Selection Evolution 2010, 42:17
/>Page 8 of 14
reach a length of 12 cm, before migration into the Byg-
landsfjord, an oligotrophic lake with a poor invertebrate
population and no forage fish. In the lake, the Bleke strain
exhibits enhanced growth rates, while the maximum fish
size generally does not exceed 30 cm and 250 g [12]. After
having been landlocked for thousands of years, an adap-
tation to the poor growing conditions may explain the
differences in growth observed between the Bleke and
wild fish from the Vosso river. However, the Bleke strain
exhibits enhanced growth when transferred to lakes with
ample forage fish available [29]. This may suggest that
environment rather than genetic effect is more responsi-
ble for poor growth. Indeed, ecological factors related to
energetics and feeding are almost certainly largely
responsible for the establishment of dwarfism in the pop-
ulation, as was documented for Lake Whitefish popula-
tions [30]. If this is the case, it represents an important
deviation from the assumptions of an F2 population
derived from different lines, which are typically under
strong selection for particular traits (e.g. [31]). In addi-
tion, the trait variance observed in the F2 population,
while large (CV = 48.2%, 16% and 15.7% for body weight,
total length and K-factor respectively), was of comparable
magnitude to other salmon mapping families (45.5%,
17.8% and 9.7% for the same traits) [32] and to outbred
full-sib families in other species such as barramundi
(Lates calcarifer) (CV = 45.9%, 16.4% and 8.1% for the
same traits) [33].
In this study, genome-wide significant QTL for growth
and body form traits were found on Chr 10 (BW, L, SW),
Chr 5 (BW, L, SW) and Chr 4 (BW, L, SW). Other studies
have found evidence for QTL on Chr 4 [32,34], and QTL
have been reported in Arctic charr on linkage groups
homologous to Chr 4 and Chr 5 [35]. In addition, numer-
ous linkage groups harbouring suggestive QTL for body
weight, length and K-factor were replicated from previ-
ous studies. Nevertheless, the large number of different
QTL reported for growth traits in Atlantic salmon, in
particular body weight, suggests that these traits are
highly polygenic (Table 7). Another possible explanation
for the different QTL reported for these traits is that dif-
ferent QTL may be segregating in the European and
23 20 4.81* 0.006 (0.015) 0.068 (0.022)
19 0 3.72* 0.037 (0.014) -0.025 (0.02)
Dressing % 17 2 5.89* -0.537 (0.173) -0.412 (0.243)
13 58 4.71* -0.262 (0.101) -0.272 (0.152)
*** Genome-wide significant QTL (P < 0.05)
** Chromosome-wide significant QTL (P < 0.01)
* Chromosome-wide significant QTL (P < 0.05)
a
Detected using the half-sib analysis
b
QTL peak more than 20 cM from QTL peak in half-sib analysis
Table 5: Quantitative trait loci (QTL) mapped using the F2 line cross regression analysis (Continued)
Figure 3 Line-cross and half-sib interval mapping analysis for
flesh colour on Chr 26. F-statistic profiles for Chr 26 for both line-cross
and half-sib models for flesh colour; diamonds on the top axis repre-
sent marker positions; horizontal dashed lines represent genome-wide
significance thresholds (P < 0.05) for both line-cross (blue) and half-sib
(red) analyses.
Figure 4 Line-cross and half-sib interval mapping analysis for
flesh colour on Chr 4. F-statistic profiles for Chr 4 for both line-cross
and half-sib models for flesh colour; diamonds on the top axis repre-
sent marker positions; horizontal dashed lines represent genome-wide
significance thresholds (P < 0.05) for both line-cross (blue) and half-sib
(red) analyses.
Baranski et al. Genetics Selection Evolution 2010, 42:17
/>Page 9 of 14
North American populations used in these studies. Euro-
pean and North American Atlantic salmon have been
shown to be quite distinct from one another, with F
ST
estimates of 0.27 using microsatellites [36,37] and 0.33
using allozymes (reviewed in [38]). Therefore it is quite
likely that some QTL, such as those affecting body
weight, segregate in one subgroup and not in the other.
The detection of QTL for multiple traits on the same
linkage groups (e.g. Chr 4) can be explained by either the
linkage of two QTL (one for each trait), or the presence of
a single QTL with pleiotropic effects. Reid et al. [34]
detected QTL for both body weight and condition factor
on five linkage groups in Atlantic salmon, and argued that
they may represent different sets of genes due to low
genetic correlations reported between the two traits pre-
viously. For the colour and 'growth' QTL detected on Chr
4 in this study, there is evidence to suggest that these are
two separate QTL, given that the QTL peaks for colour
and weight are some distance apart. However, the large,
overlapping confidence intervals covering these QTL in
both the line-cross and half-sib models means that fur-
ther analyses will be needed to confirm this. Studies on
genetic correlations between flesh colour and growth
have been somewhat inconclusive in salmonids. Withler
and Beacham [39] have found a moderately positive
genetic correlation between final body weight and flesh
colour in Coho salmon, however it was not significantly
different from zero (0.44 ± 0.48). Other studies have
reported stronger evidence for positive genetic correla-
tions between growth and colour in salmonids [2,40],
indicating that the same sets of genes may be involved.
An extremely large QTL for IPN resistance explaining
nearly all the genetic variance for this trait has been iden-
tified on Chr 26 in Atlantic salmon [41], mapping to a
similar position to the flesh colour QTL in this study.
Although there is little published evidence for a strong
genetic correlation between flesh colour and IPN resis-
tance, genotypes at the IPN QTL have been found to be
positively correlated to flesh colour (T. Moen, pers.
comm.). This suggests the possibility that extreme colour
phenotypes represent individuals with alternate IPN QTL
alleles due to an undocumented secondary effect of IPN
infection on flesh colour. One hypothesis is that a non-
lethal infection of a population with IPN could result in
Figure 5 Line-cross and half-sib interval mapping analysis for
length and body weight on Chr 4. F-statistic profiles for Chr 4 for
both line-cross and half-sib models for length and body weight; dia-
monds on the top axis represent marker positions; horizontal solid and
dashed black lines represent the genome-wide significance thresholds
(P < 0.05) for both line-cross and half-sib analyses, respectively.
Figure 6 Line-cross and half-sib interval mapping analysis for
length and body weight on Chr 10. F-statistic profiles for Chr 10 for
both line-cross and half-sib models for length and body weight; dia-
monds on the top axis represent marker positions; horizontal solid and
dashed black lines represent the genome-wide significance thresholds
(P < 0.05) for both line-cross and half-sib analyses, respectively.
Figure 7 Line-cross and half-sib interval mapping analysis for
length, body weight and slaughter weight on Chr 5. F-statistic pro-
files for Chr 5 for both line-cross and half-sib models for length and
body weight; diamonds on the top axis represent marker positions;
horizontal solid and dashed black lines represent the line-cross ge-
nome-wide significance threshold (P < 0.05) and half-sib chromo-
some-wide significance threshold (P < 0.05), respectively.
Baranski et al. Genetics Selection Evolution 2010, 42:17
/>Page 10 of 14
Table 6: Quantitative trait loci (QTL) mapped using the half-sib regression analysis
Trait Chr Pos (cM) F-ratio
Seg parsa PVEb Detect LC?
d
Flesh colour 26 44 7.14*** 6
c
12.64 Y
4576.46***4
c
11.28 Y
1 33 3.69** 2 5.66 Y
e
993.21**24.67
5722.69**3
c
3.56 Y
e
7 11 2.66** 3 3.52 Y
20 1 2.8* 3 3.8 Y
e
6 82 2.71* 2 3.63 Y
e
3 37 2.45* 1 3.08
19 1 2.35* 2 2.86
8 0 2.32* 3 2.81
29 0 2.29* 2 2.73
Body weight 4 1 3.95*** 4
c
6.17 Y
16 62 3.85** 3 6.01
7 10 3.41** 4 5.09 Y
10 15 2.72** 3
c
3.62 Y
13 42 2.83* 2 3.88 Y
25 13 2.67* 1 3.53
5 20 2.59* 3
c
3.35 Y
23 22 2.58* 2 3.34
11 17 2.42* 3 3
2 42 2.34* 2 2.85
Length 4 1 4.31*** 4
c
6.92 Y
10 10 3.28*** 3
c
4.8 Y
16 61 3.85** 3 5.99
13 61 3.69** 5 5.67 Y
11 8 3.42** 2 5.11 Y
7 20 3.02** 3 4.28 Y
25 15 2.96* 1 4.15
23 13 2.77* 2 3.75
24 4 2.68* 2 3.56
Slaughter
weight
4 1 4.00*** 4
c
6.27 Y
16 61 3.91** 3 6.13
7 10 3.43** 4 5.13 Y
13 60 2.83* 2 3.87 Y
10 16 2.69** 3
c
3.58 Y
25 14 2.74* 1 3.69
23 22 2.64* 2 3.48
5 20 2.55* 3
c
3.26 Y
11 19 2.44* 3 3.05
2 42 2.28* 2 2.72
K-factor 20 46 3.89** 4 6.08 Y
7 15 3.52** 3 5.31 Y
Baranski et al. Genetics Selection Evolution 2010, 42:17
/>Page 11 of 14
the more resistant fish processing or depositing pigment
differently to the susceptible fish, resulting in down-
stream differences in flesh colour that can be explained
by the IPN QTL genotype.
Under the line-cross model, the QTL allele with a posi-
tive effect on the trait value (additive effect) almost exclu-
sively originated from the commercial line for all traits.
This is not surprising given that selection has been per-
formed for a number of generations on growth and body
composition traits in this population, while the Bleke
population is a natural population subject to environ-
mental selection influence alone. Although the genome-
wide significant QTL were generally detected in both the
line-cross and half-sib models, a large number of sugges-
tive QTL were uniquely detected by each model. This is
likely due to the underlying assumptions of the models.
Mapping of QTL using F2 populations is very powerful
when the assumption of QTL allele fixation in the found-
ing lines holds true, and is quite robust to limited devia-
tions from this ideal situation [42]. However, when there
is a very large reduction of this contrast, the power of
detecting the QTL using the line-cross model is substan-
tially reduced [42]. In the extreme case where the lines do
not differ with respect to the allele frequency, then the
power will be equal to zero. The half-sib model is more
general, with no assumption on the number and fre-
quency of QTL alleles in the founder populations and is
almost certainly more realistic for the population in this
study, since both lines are outbred. In QTL studies per-
formed in divergent pig populations and their crosses, it
has been shown that even in these selected populations
there is still a considerable amount of genetic variation at
loci affecting traits of interest [24]. Other studies in sal-
monids have also indicated high levels of variability at
QTL within strains. In a QTL mapping study for temper-
ature tolerance in Arctic charr [43], it was unexpectedly
found that multiple QTL were detected in pure strain
parents (Fraser River and Nauyuk Lake). It was hypothe-
sized that, under the assumption that pure strains were
almost fixed for alternate alleles, greater effects would
have been detected in the male F1 hybrid parent due to
segregation of QTL alleles. This was inferred because
these strains descend from populations that are adapted
to very different thermal regimes.
The extent of QTL variability in the founding lines in
our study is also apparent since the half-sib analysis
shows that the QTL segregate in only a fraction of the F1
parents. For the flesh colour QTL on Chr 26 and Chr 4,
the QTL appeared to be segregating in six and four par-
ents respectively, out of 12 parents in total. For the rest of
the suggestive QTL, the number of heterozygous parents
ranged between two and four (out of eight for most link-
age groups). Interestingly, only the sires appeared to be
segregating for colour on Chr 4, which could be explained
by the lack of male recombination enabling detection in
the sires only, when the underlying variation is actually
located some distance away from the nearest marker. One
possible weakness of the across-family half-sib analysis as
undertaken here is that low QTL heterozygosity in the
parents reduces the power of detection [44]. The optimal
solution to the analysis of this F2-type dataset could be a
combined half-sib/line-cross model, as suggested by Kim
et al. [45]. The estimates of the proportion of phenotypic
variance explained by the QTL under the line-cross
model were substantially smaller than under the half-sib
model (the largest QTL for flesh colour explained only
3.7% of the phenotypic variance in the line-cross model
vs. 12.6% in the half-sib model). This is probably due to
the fact that the F0 lines were outbred and therefore the
estimated QTL effects were underestimated [42]. If in
such a situation the data are analysed using a line-cross
model, the estimated additive effect will be reduced by a
3 37 2.92* 2 4.06
1 54 2.9* 2 4.02
16 10 2.89* 2 3.99
14 6 2.76* 3 3.73
12 9 2.68* 2 3.55
Dressing % 11 21 2.79** 3 3.79
*** Genome-wide significant QTL (P < 0.05)
** Chromosome-wide significant QTL (P < 0.01)
* Chromosome-wide significant QTL (P < 0.05)
a
Number of segregating parents
b
Percentage of within family variance explained by the QTL
c
Segregating out of 12 parents (extra families genotyped in these linkage groups)
d
Detected using the line-cross analysis
e
QTL peak more than 20 cM from QTL peak in line-cross analysis
Table 6: Quantitative trait loci (QTL) mapped using the half-sib regression analysis (Continued)
Baranski et al. Genetics Selection Evolution 2010, 42:17
/>Page 12 of 14
fraction (p
H
- p
L
), where p
H
is the frequency in the H line
and p
L
is the frequency in the L line.
Clearly, these results should be further validated with a
denser marker map and additional families, since the
QTL could only be mapped to relatively broad chromo-
somal regions. A relatively dense Atlantic salmon SNP
chip, recently developed at the Centre for Integrative
Genetics (CIGENE) in Norway in collaboration with
international partners and containing 5000-7000 poly-
morphic SNP, may be a useful tool for this purpose.
These SNP arrays offer much more efficient genotyping
and scoring, and can be relatively inexpensive when cou-
pled with methods such as selective DNA pooling [46,47].
The increased marker density of this SNP array will not
only help close the gaps that are present in the current
linkage map, but may facilitate the use of linkage disequi-
librium information to further fine-map QTL.
Nevertheless, this study presents useful evidence for
QTL of the important commercial and biological trait of
flesh colour, and provides additional information on QTL
for commercially important growth traits. There is of
course a risk that QTL segregating in a resource popula-
tion like that used in this study may not be found in com-
mercial populations. However, if this should be the case,
the QTL identified in the present study still contribute to
a better understanding of the genetic control and biologi-
cal mechanisms underlying the metabolism of dietary
pigments in salmon, and the genetic architecture of
growth traits in this species.
Table 7: Summary of significant or suggestive body weight QTL in Atlantic salmon reported from this study and the
literature
Chr This study Reid et al. [34] Boulding et al. [32] Houston et al. [28]
1X
2XXXX
3XX
4XXX
5X
6 X
7X X
8 X
9X
10 X
11 X X
12 X
13 X X
14 X
15 X
16 X
17 X
18 X
20
21 X X
22 X
23 X X
24
25 X
26 X
27
28
29 X
Baranski et al. Genetics Selection Evolution 2010, 42:17
/>Page 13 of 14
Conclusions
A large number of significant and suggestive QTL for
flesh colour and growth traits were found in an F2 cross
between a landlocked and a commercial strain of Atlantic
salmon. Chr 26 and Chr 4 presented the strongest evi-
dence for significant QTL affecting flesh colour, while
Chr 10, Chr 5 and Chr 4 presented the strongest evidence
for significant QTL affecting growth traits (length and
weight). These QTL could be strong candidates for use in
marker-assisted selection and may provide further insight
into the genetic control of flesh colour and growth traits
in this species.
Additional material
Competing interests
The authors declare that they have no competing interests.
Authors' contributions
DIV coordinated and supervised the study. MB performed the laboratory work
with assistance from TM, conducted the data analyses and wrote the manu-
script with contributions from TM and DIV. All authors read and approved the
final manuscript.
Acknowledgements
This study was funded by the Norwegian Research Council (177036/S10) who
provided access to the SALBANK samples. Genomar AS and AKVAFORSK
(Averøy) produced the families and performed the trait recording. We also
thank Bjørn Høyheim and Anna Sonesson for storage and registration of sam-
ples and data, Roy Danzmann for providing microsatellite primer sequences,
Hege Munck and Katrine Hånes for genotyping assistance and Tone Hæg Lind-
holm for DNA extraction and genotyping assistance.
Author Details
1
Nofima Marin, P.O. Box 5010, 1432 Ås, Norway,
2
Department of Animal and
Aquacultural Sciences, Norwegian University of Life Sciences, P.O. Box 5003,
1432 Ås, Norway,
3
The Centre for Integrative Genetics (CIGENE), Norwegian
University of Life Sciences, P.O. Box 5003, 1432 Ås, Norway and
4
Aqua Gen AS,
Postboks 1240, Pirsenteret, 7462 Trondheim, Norway
References
1. Gjerde B, Schaeffer LR: Body traits in rainbow trout: II. Estimates of
heritabilities and of phenotypic and genetic correlations. Aquaculture
1989, 80:25-44.
2. Quinton CD, McMillan I, Glebe BD: Development of an Atlantic salmon
(Salmo salar) genetic improvement program: Genetic parameters of
harvest body weight and carcass quality traits estimated with animal
models. Aquaculture 2005, 247:211-217.
3. Iwamoto RN, Myers JM, Hershberger WK: Heritability and genetic
correlations for flesh coloration in pen-reared coho salmon.
Aquaculture 1990, 86:181-190.
4. Torissen OJ, Hardy RW, Shearer KD: Pigmentation of salmonids-
carotenoid deposition and metabolism. Crit Rev Aquat Sci 1989,
1:209-225.
5. Nickell DC, Bromage NR: The effect of timing and duration of feeding
astaxanthin on the development and variation of fillet colour and
efficiency of pigmentation in rainbow trout (Oncorhynchus mykiss).
Aquaculture 1998, 169:233-246.
6. Araneda C, Neira R, Iturra P: Identification of a dominant SCAR marker
associated with colour traits in Coho salmon (Oncorhynchus kisutch).
Aquaculture 2005, 247:67-73.
7. Gjerde B, Gjedrem T: Estimates of phenotypic and genetic parameters
for carcass traits in Atlantic salmon and rainbow trout. Aquaculture
1984, 36:97-110.
8. Withler RE: Genetic variation in carotenoid pigment deposition in the
red-fleshed and white-fleshed Chinook salmon (Oncorhynchus
tshawytscha) of Quesnel River, British Columbia. Can J Genet Cytol 1986,
28:587-594.
9. Rajasingh H, Gjuvsland AB, Vage DI, Omholt SW: When parameters in
dynamic models become phenotypes: A case study on flesh
pigmentation in the Chinook salmon (Oncorhynchus tshawytscha).
Genetics 2008, 179:1113-1118.
10. Rajasingh H, Oyehaug L, Vage D, Omholt S: Carotenoid dynamics in
Atlantic salmon. BMC Biology 2006, 4:10.
11. Soller M, Brody T, Genizi A: On the power of experimental designs for
the detection of linkage between marker loci and quantitative loci in
crosses between inbred lines. Theor Appl Genet 1976, 47:35-39.
12. Dahl K: The Blege or dwarf-salmon. Skr Utg Av Det Norske
Videnskabsakad, 1927, Oslo 1928.
13. Barlaup BT, Kleiven E, Christensen H, Kile H, Martinsen BO, Vethe A: Bleka I
Byglandsforden bestandsstatus og tiltak for økt naturlig rekruttering.
Volume 72. Direktoratet for naturforvaltning. Trondheim; 2005.
14. Rikardsen AH, Elliott JM: Variations in juvenile growth, energy allocation
and life-history strategies of two populations of Arctic charr in North
Norway. J Fish Biol 2000, 56:328-346.
15. Artieri CG, Mitchell LA, Ng SHS, Parisotto SE, Danzmann RG, Hoyheim B,
Phillips RB, Morasch M, Koop BF, Davidson WS: Identification of the sex-
determining locus of Atlantic salmon (Salmo salar) on chromosome 2.
Cytogenet Genome Res 2006, 112:152-159.
16. ASalBase []
17. Phillips R, Keatley K, Morasch M, Ventura A, Lubieniecki K, Koop B,
Danzmann R, Davidson W: Assignment of Atlantic salmon (Salmo salar)
linkage groups to specific chromosomes: Conservation of large
syntenic blocks corresponding to whole chromosome arms in rainbow
trout (Oncorhynchus mykiss). BMC Genet 2009, 10:46.
18. Moen T, Hoyheim B, Munck H, Gomez-Raya L: A linkage map of Atlantic
salmon (Salmo salar) reveals an uncommonly large difference in
recombination rate between the sexes. Anim Genet 2004, 35:81-92.
19. Stam P, Van Ooijen JW: JoinMap Version 2.0: Software for the
Calculation of Genetic Linkage Maps. CPRO-DLO, Wageningen; 1995.
20. Haley CS, Knott SA, Elsen JM: Mapping Quantitative Trait Loci in Crosses
Between Outbred Lines Using Least Squares. Genetics 1994,
136:1195-1207.
21. Knott SA, Elsen JM, Haley CS: Methods for multiple marker mapping of
quantitative trait loci in half-sib populations. Theor Appl Genet 1996,
93:71-80.
22. Seaton G, Haley CS, Knott SA, Kearsey M, Visscher PM: QTL Express:
Mapping quantitative trait loci in simple and complex pedigrees.
Bioinformatics 2002, 18:339-340.
23. Churchill GA, Doerge RW: Empirical threshold values for quantitative
trait mapping. Genetics 1994, 138:963-971.
24. de Koning DJ, Janss LLG, Rattink AP, van Oers PAM, de Vries BJ, Groenen
MAM, van der Poel JJ, de Groot PN, Brascamp EW, van Arendonk JAM:
Detection of Quantitative Trait Loci for Backfat Thickness and
Intramuscular Fat Content in Pigs (Sus scrofa). Genetics 1999,
152:1679-1690.
25. Visscher PM, Thompson R, Haley CS: Confidence intervals in QTL
mapping by bootstrapping. Genetics 1996, 143:1013-1020.
26. Norris AT, Cunningham EP: Estimates of phenotypic and genetic
parameters for flesh colour traits in farmed Atlantic salmon based on
multiple trait animal model. Livest Prod Sci 2004, 89:209-222.
27. Bjerkeng B, Storebakken T, Liaaen-Jensen S: Pigmentation of rainbow
trout from start feeding to sexual maturation. Aquaculture 1992,
108:333-346.
28. Houston RD, Bishop SC, Hamilton A, Guy DR, Tinch AE, Taggart JB, Derayat
A, McAndrew BJ, Haley CS: Detection of QTL affecting harvest traits in a
commercial Atlantic salmon population. Anim Genet 2009, 40:753-755.
Additional file 1 Markers used and map positions. List of markers and
female map positions used in this study.
Additional file 2 QTL effects for segregating parents. Allele substitution
effects and absolute t-values for segregating parents (QTL at least chromo-
some-wide significant at P < 0.01).
Received: 23 December 2009 Accepted: 4 June 2010
Published: 4 June 2010
This article is available from: 2010 Bara nski et al; licens ee BioMed Central Ltd. This is an Open Access article distributed under the terms of the Creative Commons Attribution License ( ), which permits unrestricted use, distribution, and reproduction in any medium, provided the original work is properly cited.Genetic s Selecti on Evolutio n 2010, 42:17
Baranski et al. Genetics Selection Evolution 2010, 42:17
/>Page 14 of 14
29. Jensen KW: Reliktlaks. In Sportsfiskerens leksikon Edited by: Jensen KW.
Oslo; 1984.
30. Trudel M, Tremblay A, Schetagne R, Rasmussen JB: Why are dwarf fish so
small? An energetic analysis of polymorphism in lake whitefish
(Coregonus clupeaformis). Can J Fish Aquat Sci 2001, 58:394-405.
31. Nones K, Ledur MC, Ruy DC, Baron EE, Melo CMR, Moura ASAMT, Zanella
EL, Burt DW, Coutinho LL: Mapping QTLs on chicken chromosome 1 for
performance and carcass traits in a broiler × layer cross. Anim Genet
2006, 37:95-100.
32. Boulding EG, Culling M, Glebe B, Berg PR, Lien S, Moen T: Conservation
genomics of Atlantic salmon: SNPs associated with QTLs for adaptive
traits in parr from four trans-Atlantic backcrosses. Heredity 2008,
101:381-391.
33. Wang C, Lo L, Zhu Z, Yue G: A genome scan for quantitative trait loci
affecting growth-related traits in an F1 family of Asian seabass (Lates
calcarifer). BMC Genomics 2006, 7:274.
34. Reid DP, Szanto A, Glebe B, Danzmann RG, Ferguson MM: QTL for body
weight and condition factor in Atlantic salmon (Salmo salar):
comparative analysis with rainbow trout (Oncorhynchus mykiss) and
Arctic charr (Salvelinus alpinus). Heredity 2005, 94:166-172.
35. Moghadam H, Poissant J, Fotherby H, Haidle L, Ferguson M, Danzmann R:
Quantitative trait loci for body weight, condition factor and age at
sexual maturation in Arctic charr (Salvelinus alpinus): comparative
analysis with rainbow trout (Oncorhynchus mykiss) and Atlantic salmon
(Salmo salar). Mol Genet Genomics 2007, 277:647-661.
36. King TL, Kalinowski ST, Schill WB, Spidle AP, Lubinski BA: Population
structure of Atlantic salmon (Salmo salar L.): a range-wide perspective
from microsatellite DNA variation. Mol Ecol 2001, 10:807-821.
37. King TL, Verspoor E, Spidle AP, Gross R, Phillips RB, Koljonen M-L, Sanchez
JA, Morrison CL: Biodiversity and Population Structure. In The Atlantic
Salmon - Genetics, Conservation and Management Edited by: Verspoor E,
Stradmeyer L, Nielsen JL. Blackwell Publishing Ltd.; 2007.
38. Verspoor E, Beardmore JA, Consuegra S, García de Leániz C, Hindar K,
Jordan WC, Koljonen ML, Mahkrov AA, Paaver T, Sánchez JA, et al.:
Population structure in the Atlantic salmon: insights from 40 years of
research into genetic protein variation. J Fish Biol 2005, 67:3-54.
39. Withler RE, Beacham TD: Genetic variation in body weight and flesh
colour of the coho salmon (Oncorhynchus kisutch) in British Columbia.
Aquaculture 1994, 119:135-148.
40. Rye M, Gjerde B: Phenotypic and genetic parameters of body
composition traits and flesh colour in Atlantic salmon, Salmo salar L.
Aquac Res 1996, 27:121-133.
41. Houston RD, Haley CS, Hamilton A, Guy DR, Tinch AE, Taggart JB,
McAndrew BJ, Bishop SC: Major Quantitative Trait Loci Affect Resistance
to Infectious Pancreatic Necrosis in Atlantic Salmon (Salmo salar).
Genetics 2008, 178:1109-1115.
42. Alfonso L, Haley CS: Power of different F
2
schemes for QTL detection in
livestock. Anim Sci 1998, 66:1-8.
43. Somorjai IML, Danzmann RG, Ferguson MM: Distribution of temperature
tolerance quantitative trait loci in arctic charr (Salvelinus alpinus) and
inferred homologies in rainbow trout (Oncorhynchus mykiss). Genetics
2003, 165:1443-1456.
44. Massault C, Bovenhuis H, Haley C, De Koning DJ: QTL mapping designs
for species in aquaculture. Aquaculture 2007, 272:S289-S289.
45. Kim J-J, Zhao H, Thomsen H, Rothschild MF, Dekkers JCM: Combined line-
cross and half-sib QTL analysis of crosses between outbred lines. Genet
Res 2005, 85:235-248.
46. Darvasi A, Soller M: Selective DNA pooling for determination of linkage
between a molecular marker and a quantitative trait locus. Genetics
1994, 138:1365-1373.
47. Macgregor S, Zhao ZZ, Henders A, Martin NG, Montgomery GW, Visscher
PM: Highly cost-efficient genome-wide association studies using DNA
pools and dense SNP arrays. Nucl Acids Res 2008, 36:e35.
doi: 10.1186/1297-9686-42-17
Cite this article as: Baranski et al., Mapping of quantitative trait loci for flesh
colour and growth traits in Atlantic salmon (Salmo salar) Genetics Selection
Evolution 2010, 42:17