Identification of QTL underlying physiological and morphological traits of flag leaf in barley
Bạn đang xem bản rút gọn của tài liệu. Xem và tải ngay bản đầy đủ của tài liệu tại đây (997.29 KB, 10 trang )
Liu et al. BMC Genetics (2015) 16:29
DOI 10.1186/s12863-015-0187-y
RESEARCH ARTICLE
Open Access
Identification of QTL underlying physiological and
morphological traits of flag leaf in barley
Lipan Liu1, Genlou Sun1,2, Xifeng Ren1, Chengdao Li3 and Dongfa Sun1,4*
Abstract
Background: Physiological and morphological traits of flag leaf play important roles in determining crop grain yield
and biomass. In order to understand genetic basis controlling physiological and morphological traits of flag leaf, a
double haploid (DH) population derived from the cross of Huaai 11 × Huadamai 6 was used to detect quantitative
trait locus (QTL) underlying 7 physiological and 3 morphological traits at the pre-filling stage in year 2012 and 2013.
Results: Total of 38 QTLs distributed on chromosome 1H, 2H, 3H, 4H, 6H and 7H were detected, and explained
6.53% - 31.29% phenotypic variation. The QTLs flanked by marker Bmag829 and GBM1218 on chromosome 2H were
associated with net photosynthetic rate (Pn), stomatal conductance (Gs), flag leaf area (LA), flag leaf length (FLL),
flag leaf width (FLW), relative chlorophyll content (SPD) and leaf nitrogen concentration (LNC).
Conclusion: Two QTL cluster regions associated with physiological and morphological traits, one each on the
chromosome 2H and 7H, were observed. The two markers (Bmag829 and GBM1218) may be useful for marker
assisted selection (MAS) in barley breeding.
Keywords: Barley, Net photosynthetic rate, Stomatal conductance, Flag leaf area, Flag leaf length, Flag leaf width,
Relative chlorophyll content, Leaf nitrogen concentration
Background
Barley (Hordeum vulgare L.) is the fourth cereal crop in
world production [1]. High yield is always one of the important barley breeding aims [2]. However, grain yield
was controlled by complex biochemical and physiological processes, and closely related to physiological and
morphological traits [3-7]. The top three leaves on a
stem, especially the flag leaf, absorb most irradiation
light, and were the primary source of carbohydrate production [8]. In barley, importance of flag leaf on increasing grain yield has widely been studied [6,7,9]. However,
previous studies have mainly focused on either morphological traits [10-12] or physiological traits of flag leaf
[13-18] determining grain yield. Few QTLs associated with
these traits have been applied to barley breeding due to
complicated measurement procedure, inconsistency and
dynamic process of physiological and morphological traits
* Correspondence:
1
College of Plant Science and Technology, Huazhong Agricultural University,
Wuhan 430070, China
4
Hubei Collaborative Innovation Center for Grain Industry, Wuhan 430070,
China
Full list of author information is available at the end of the article
in barley developmental stage. Thus, comprehensive understanding the role of physiological and morphological
traits of flag leaf on yield will provide a new insight in crop
growth and development. Meanwhile, application of molecular marker and genetic map made it possible to map
the region controlling quantitative traits [11,19,20].
Increasing photosynthetic capacity of leaf is one of the
most important approaches to increase crop biomass [21].
It was estimated that leaf photosynthesis contributing 30%
biomass [2]. Photosynthesis is an essential process to
maintain crop growth and development. Photosynthetic
capacity during reproductive stage is positively correlated
with crop yield [22]. Four main physiological parameters:
net photosynthetic rate, stomatal conductance, intercellular CO2 concentration and transpiration rate, have been
used to evaluate photosynthetic capacity. Teng et al. [2]
reported that net photosynthetic rate in rice was controlled by multiple genes. In barley, QTL underlying net
photosynthetic rate has been analyzed in two DH populations [18]. According to Jiang et al. [23], stomatal conductance significantly affected net photosynthetic rate, and is a
key parameter to assess limitation of photosynthesis in barley. Rybiński et al. [24] found significant linear relationship
© 2015 Liu et al.; licensee BioMed Central. This is an Open Access article distributed under the terms of the Creative Commons
Attribution License ( which permits unrestricted use, distribution, and
reproduction in any medium, provided the original work is properly credited. The Creative Commons Public Domain
Dedication waiver ( applies to the data made available in this article,
unless otherwise stated.
Liu et al. BMC Genetics (2015) 16:29
between transpiration rate and net photosynthetic rate in
different irradiated times under laser light. However, the
QTLs underlying stomatal conductance, intercellular CO2
concentration and transpiration rate have not been reported in barley.
Chlorophyll absorbs light energy and converts it into
chemical energy. Maintaining higher level of chlorophyll
content in leaf is one of the strategies for increasing
photosynthesis and crop production [14]. The structure
and function of chloroplasts determine photosynthetic
activity [25]. Von Kroff et al. [26] reported a positive
correlation between relative chlorophyll fluorescence in
leaf and grain yield. The chlorophyll content was suggested as a reliable indicator for evaluating metabolic
balance between photosynthesis and yield performance
[27]. Recently, chlorophyll content in barley leaf has
widely been studied [11,14,26,28].
Nitrogen uptake and metabolism of flag leaf at the prefilling stage provide main energy source to grain yield
[15]. The photosynthetically active leaf cells of chloroplasts contain most nitrogen [29]. The most of assimilated
nitrogen mainly come from photosynthesis. Leaf CO2 assimilation rate and nitrogen content per unit area was
highly correlated [30]. Depending on physiological status,
nitrogen can be stored and assimilated in both leaves and
roots [31]. In fully developed leaves, about 75% nitrogen is
allocated to chloroplasts, and mostly used for synthesizing
components of photosynthetic apparatus [32]. A positive
correlation was found between photosynthetic capacity of
leaves and their nitrogen content [33]. In past few years,
some studies have reported that nitrogen content in leaves
was quantitative trait and controlled by multiple genes in
barley. Stable QTLs were detected, but phenotypic contribution from each QTL was small [12,15,29].
Plant water status plays an important role in plant
growth, development, and keeping yield stability [34]. The
physiological and morphological traits such as photosynthesis, transpiration of flag leaves and grain yield are
closely correlated with plant water status [35,36]. In water
deficit environment, crop must increases water use efficiency to resist drought, and sustains normal growth [37].
Relative water content (RWC) was widely used to measure
water status in barley [38]. RWC is an important determinant of leaf metabolic activity, and reflects water balance in tissues [39]. Maintenance of certain level of RWC
can increase yield and its stability in cereals [38]. As RWC
is related to plant water-status, it can be used to evaluate
water level in plant at a specific growth stage. It has been
reported that RWC has a positive relationship with yield
in cereals [36]. QTLs associated with RWC were detected
on chromosome 6H in different water conditions and developmental stages [16,40,41].
In present study, a DH population derived from the
cross of Huaai 11 × Huadamai 6 was used to identify
Page 2 of 10
QTLs underlying physiological and morphological traits
of flag leaf at the pre-filling stage. The identified QTLs
can be used for molecular assisted selection (MAS) in
barley breeding.
Results
Phenotype analysis of the double population and parents
The statistics of 7 physiological and 3 morphological
traits of flag leaf at the pre-filling stage were shown in
Table 1. The values of Pn, Gs, Ci, Tr, RWC, SPD and
LNC in Huaai 11 were higher than those in Huadamai 6.
The values of LA, FLL and FLW were higher in Huadamai
6 than those in Huaai 11. The t-test showed that two parents were significant difference on all traits (p < 0.05). All
traits displayed a normal distribution with the skewness
and kurtosis among −1 and 1 (Table 1). Analysis of variance
showed that genotype effects were significant (P < 0.01) for
all traits studied. Effects between years were not significant
(P > 0.05) except Pn, Gs and Tr traits. Genotype × year interactions were significant (P < 0.05) for all traits except
LA, FLL and FLW (Table 2). In addition, all 7 physiological
and 3 morphological traits at the pre-filling stage showed
highly phenotypic variation in the DH population. The variable coefficients ranged from 5.22% to 30.91% in 2012, and
11.50% to 28.50% in 2013. Transgressive segregation in
both directions was observed for all traits (Table 1). Heritability (Table 1) ranged from 44.13% to 80.67% and 52.66%
to 85.57% in 2012 and 2013, respectively.
Correlation analysis
Correlations among Pn, Gs, Ci, and Tr were significant
positive (P < 0.01, Table 3). Three morphological traits,
LA, FLL and FLW, were also significantly positive correlated with each other (P < 0.01, Table 3). Significant positive correlation between Pn and SPD was detected with
correlation coefficient of 0.335 in 2012 and 0.265 in 2013
(P < 0.01). LNC was significantly correlated with SPD (r =
0.283 in 2012 and 0.381 in 2013, P < 0.01). A negative correlation between Pn and LA was observed with r = −0.515
(year 2012) and −0.225 (year 2013) (P < 0.05). RWC was
not significantly (P > 0.05) correlated with other traits except LA in 2013.
QTL analysis
A total of 38 QTLs for 7 physiological and 3 morphological traits were detected and mapped (Figure 1; Table 4).
18 and 15 QTLs were detected in 2012 and 2013, respectively. Five QTLs based on mean value of each trait were
detected for LA, FLL and FLW. The detected QTLs
accounted for 7.14% - 24.58% and 6.53% - 25.36% phenotypic variation in 2012 and 2013, respectively. The QTLs
based on mean values of LA, FLL and FLW explained
14.23% - 31.29% phenotypic variation.
Liu et al. BMC Genetics (2015) 16:29
Page 3 of 10
Table 1 The statistics of the 122 lines from DH population and parents for the 7 physiological and 3 morphological
traits based on data from each year (2012 and 2013)
Trait
Pn
Year
2012
Gs
Ci
Tr
LA
FLL
FLW
RWC
SPD
LNC
Huadamai6
Huaai11
ST
DH lines
Mean
SD
Mean
SD
Max
Min
Mean
SD
Skewness
Kurtosis
CV (%)
H (%)
26.00 ± 1.17
2.87
29.38 ± 0.55
1.35
0.041*
32.56
19.72
25.15 ± 0.24
2.62
0.23
−0.13
10.41
44.13
*
2013
22.77 ± 0.10
1.17
25.03 ± 2.71
4.69
0.031
27.77
14.44
20.31 ± 0.21
2.33
0.26
0.39
11.50
56.85
2012
0.43 ± 0.03
0.06
1.03 ± 0.03
0.07
0.000**
1.02
0.21
0.56 ± 0.02
0.17
0.19
−0.53
30.91
53.34
2013
0.46 ± 0.01
0.01
0.83 ± 0.07
0.12
0.036*
0.93
0.20
0.41 ± 0.01
0.14
1.00
1.00
33.05
58.56
2012
255.83 ± 2.70
6.62
308.67 ± 1.09
2.66
0.000**
316.51
197.1
266.84 ± 2.38
26.24
−0.78
0.19
9.84
60.76
2013
261.32 ± 1.87
3.23
294.89 ± 0.42
0.73
0.005**
315.71
216.3
268.01 ± 1.77
19.55
0.14
−0.31
7.29
65.23
2012
6.45 ± 0.30
0.73
9.28 ± 0.16
0.39
0.001**
12.83
4.87
8.21 ± 0.14
1.59
0.04
−0.38
19.32
47.65
2013
7.47 ± 0.04
0.08
9.86 ± 1.00
1.73
0.028
10.41
3.78
6.27 ± 0.13
1.44
0.38
−0.34
22.95
52.66
2012
27.18 ± 0.88
2.80
12.02 ± 0.83
2.63
0.000**
30.42
9.66
17.89 ± 0.37
4.08
0.69
0.19
22.82
78.98
**
*
2013
26.66 ± 1.80
4.76
18.05 ± 1.43
3.80
0.002
37.79
10.37
21.52 ± 0.47
5.18
0.63
0.55
24.10
83.56
2012
26.62 ± 1.08
3.41
14.36 ± 0.81
2.57
0.000**
28.02
13.04
17.94 ± 0.24
2.66
0.28
−0.43
14.84
80.67
2013
22.31 ± 0.88
2.34
15.84 ± 0.88
2.33
0.000**
27.39
12.86
19.09 ± 0.26
2.88
0.44
0.21
15.08
85.57
2012
2.03 ± 0.13
0.40
1.48 ± 0.05
0.16
0.003**
2.20
1.22
1.67 ± 0.02
0.19
0.56
0.27
11.60
69.34
*
2013
1.97 ± 0.04
0.11
1.56 ± 0.06
0.15
0.012
2.18
1.21
1.74 ± 0.02
0.18
0.10
0.13
10.53
76.56
2012
80.96 ± 0.52
1.65
87.13 ± 0.95
3.01
0.015*
92.26
73.53
82.68 ± 0.39
4.31
0.11
−0.59
5.22
50.56
2013
82.62 ± 3.90
8.71
86.05 ± 3.59
8.02
0.050*
94.23
72.08
83.38 ± 0.41
4.49
−0.24
−0.16
5.38
57.67
2012
52.50 ± 1.23
2.13
65.87 ± 0.79
1.37
0.007**
71.93
51.17
62.33 ± 0.38
4.17
−0.27
−0.15
6.69
49.56
2013
51.63 ± 3.17
5.49
62.83 ± 1.79
3.10
0.035
66.33
48.33
59.07 ± 0.33
3.67
−0.48
0.41
6.22
57.89
2012
2.90 ± 0.07
0.17
4.70 ± 0.25
0.60
0.002**
7.88
1.41
4.79 ± 0.12
1.38
−0.39
−0.53
28.76
70.45
0.51
**
7.96
1.68
4.89 ± 0.13
1.39
−0.38
−0.38
28.50
62.45
2013
3.84 ± 0.18
0.43
5.01 ± 0.21
*
0.000
*, **
: Significant at 0.05, 0.01 level, respectively.
ST: Significant; CV: Coefficient of variation; H: Heritability.
detected in 2012 and mapped on chromosome 2H, 3H
and 7H, and accounted for 7.78%, 12.58% and 13.92% total
phenotypic variation, respectively. In 2013, one QTL
qGs2-13 was detected on chromosome 2H, and accounted
for 7.47% total phenotypic variation. All these QTLs have
alleles from Huaai 11 to increase stomatal conductance,
their values ranged from 0.04 to 0.07 (Figure 1; Table 4).
Net photosynthetic rate
Three QTL underlying Pn trait were detected. Two
QTLs, qPn2-10 and qPn4-17, were detected on chromosome 2H and 4H in 2012. They accounted for 8.66% and
12.63% total phenotypic variation, respectively. The
QTL, qPn7-8 on chromosome 7H was detected in 2013,
and accounted for 13.56% total phenotypic variation.
Both qPn2-10 and qPn7-8 QTLs have alleles from Huaai
11 to increase net photosynthetic rate, the QTL qPn4-17
has allele from Huadamai 6 to increase net photosynthetic rate (Figure 1; Table 4).
Intercellular CO2 concentration
Three QTLs for Ci trait were detected. Of them, two
QTLs, qCi2-16 and qCi7-3, were mapped on chromosome 2H and 7H in 2012, and accounted for 13.75% and
13.98% total phenotypic variation, respectively. One
QTL qCi2-14 was identified in 2013, and accounted for
10.69% total phenotypic variation. These QTLs have
Stomatal conductance
Four QTLs associated with Gs trait were detected. Of
them, three QTLs, qGs2-10, qGs3-13 and qGs7-6, were
Table 2 Variance analysis of 7 physiological and 3 morphological traits of 122 barley DH lines, sum of squares was
shown
Source
Pn
Gs
Ci
Tr
LA
FLL
FLW
RWC
SPD
LNC
Genotype
7055.203**
16.755**
495793.084**
1796.972**
28542.641**
7344.367**
31.652**
13868.241**
14379.196**
757.609**
Year
3651.228**
6.290*
289.943
703.441**
317.510
161.339
1.813
73.509
603.316
3.493
Genotype × Year
2593.407**
6.803*
52994.676*
646.039**
1371.505
671.623
3.679
2100.091*
2570.247*
96.884*
*, **
: Significant at 0.05 and 0.01 level, respectively.
Liu et al. BMC Genetics (2015) 16:29
Page 4 of 10
Table 3 Correlation analysis among 7 physiological and 3 morphological traits based on data from each year
Trait
Pn
Pn
Gs
0.657**
Ci
0.373**
Gs
Ci
Tr
LA
FLL
FLW
RWC
SPD
0.655**
0.474**
0.675**
−0.515**
−0.416**
−0.562**
0.088
0.335**
0.002
**
**
0.918
−0.454
−0.407
−0.450
0.067
**
0.527
0.160
0.767**
−0.482**
−0.477**
−0.422**
−0.044
0.499**
0.171
−0.498
−0.422
−0.517
0.055
**
0.612
0.120
0.864**
0.861**
0.171
−0.472**
−0.082
0.055
**
−0.392
−0.025
0.165
−0.420**
−0.017
−0.050
0.088
0.892
0.891**
**
**
**
**
**
**
Tr
0.701**
0.930**
0.830**
LA
−0.225*
−0.376**
−0.417**
−0.497**
FLL
−0.188*
−0.390**
−0.428**
−0.504**
0.942**
FLW
−0.213*
−0.336**
−0.390**
−0.440**
0.863**
RWC
0.017
0.021
0.006
−0.097
0.183*
0.127
0.144
SPD
0.265**
0.193*
0.274**
0.253**
−0.392**
−0.377**
−0.355**
−0.003
LNC
0.011
0.110
0.201*
0.144
−0.216*
−0.231*
−0.144
−0.011
0.585
**
0.684**
LNC
0.283**
0.381**
*, **
: Significant at 0.05, 0.01 level, respectively.
Values above the diagonal are correlation coefficients in 2012; values below the diagonal are correlation coefficients in 2013.
alleles from Huaai 11 to increase intercellular CO2 concentration (Figure 1; Table 4).
Transpiration rate
Two QTLs underlying Tr trait were identified in 2012.
The QTL qTr3-13 and qTr7-6 accounted for 14.00% and
14.02% total phenotypic variation, respectively. The additive effects of the two QTLs were 0.69 and 0.71, respectively, indicating that the alleles from Huaai 11 increased
transpiration rate (Figure 1; Table 4).
Flag leaf area
Four QTLs underlying LA trait were detected on chromosome 2H and 3H. The QTL, qLA2-12 close to the marker
GBM1218, was detected in both years and mean value,
and accounted for 18.80% (year 2012), 12.48% (year 2013)
and 29.83% (mean value from two years) phenotypic variation. The alleles from Huadamai 6 increased flag leaf
area. Another QTL qLA3-9 detected in 2013 accounted
for 8.72% phenotypic variation. The allele of QTL qLA3-9
from Huaai 11 increased flag leaf area (Figure 1; Table 4).
Flag leaf length
Seven QTLs associated with FLL trait were detected.
The QTL, qFLL2-12 close to the marker GBM1218 on
chromosome 2H, was detected in both years and mean
value, and accounted for 24.58% (year 2012), 25.36%
(year 2013) and 31.29% (mean value from two years)
phenotypic variation. The alleles of the QTL, which increased flag leaf length, came from Huadamai 6. Other
four QTLs, qFLL7-10, qFLL3-11, qFLL7-6 and qFLL7-8,
accounted for 13.04%, 9.76%, 7.07% and 16.66% total
phenotypic variation, respectively. The positive alleles of
QTL qFLL7-10, qFLL3-11, qFLL7-6 and qFLL7-8 from
Huadamai 6 contributed to the increase in flag leaf
length by 1.06, 0.98, 0.79 and 1.14, respectively (Figure 1;
Table 4).
Flag leaf width
For FLW trait, five putative QTLs were identified. The
QTL, qFLW2-12 close to the marker GBM1218 on
chromosome 2H, was detected in both years and mean
value, and accounted for 13.63% (year 2012), 20.93%
(year 2013) and 14.23% (mean value from two years)
total phenotypic variation. The positive alleles of QTL
qFLW2-12 from Huadamai 6 increased flag leaf width.
Another QTL qFLW4-18 detected in 2013 and mean
value was located on chromosome 4H, and accounted
for 7.11% and 22.06% total phenotypic variation, respectively. The alleles of qFLW4-18 from Huaai 11 contributed to the increase in flag leaf width (Figure 1; Table 4).
Relative water content
Three QTLs underlying RWC were found. The QTL
qRWC6-6 nearby the marker GMS6 on chromosome 6H
was detected in both years, and accounted for 21.43%
(year 2012) and 11.76% (year 2013) phenotypic variation.
Their alleles from Huadamai 6 increased relative water
content. Another QTL, qRWC7-9 was detected in year
2012 and mapped on chromosome 7H, which accounted
for 15.31% phenotypic variation. The allele from Huaai 11
increased relative water content (Figure 1; Table 4).
Relative chlorophyll content
Four QTLs underlying SPD trait were found. The QTL
qSPD2-10 was detected in both years and close to the
marker Bmag829 on chromosome 2H, and accounted
for 17.28% (year 2012) and 15.44% (year 2013) total
phenotypic variation. Two QTLs, qSPD7-7 and qSPD79, were mapped on chromosome 7H and close to the
marker Bmac167 (year 2012) and Bmag746 (year 2013).
They accounted for 10.78% and 10.64% total phenotypic
variation in year 2012 and 2013, respectively. All these
QTLs have alleles from Huaai 11 contributed to the increase in relative chlorophyll content (Figure 1; Table 4).
Liu et al. BMC Genetics (2015) 16:29
Page 5 of 10
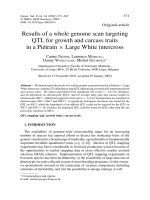
Figure 1 Chromosome location of QTL associated with 7 physiological (2012, 2013) and 3 morphological traits (2012, 2013 and mean
values) detected in the Huaai 11 × Huadamai 6 DH population. Genetic distance scales in centiMorgans (cM) are placed at left margin.
Location of QTL is indicated for year 2012 (white bar), year 2013 (black bar) and mean values (red bar). The head type trait was shown on linkage
map (red marker).
Total nitrogen content
Three QTLs associated with LNC trait were detected. Of
them, one QTL, qLNC1-10 on chromosome 1H, was detected in 2012 and accounted for 7.14% phenotypic variation. Two QTLs qLNC1-8 and qLNC2-10 were
mapped on chromosome 1H and 2H in 2013, and
accounted for 8.46% and 6.53% phenotypic variation, respectively. All these QTLs have alleles from Huaai 11
contributed to the increase in total nitrogen content
(Figure 1; Table 4).
Discussion
QTL analysis is a useful approach to discover and identify favorable alleles in barley [42]. Ren et al. [43] have
studied the correlation and QTL of agronomic and quality traits associated with grain yield in a barley DH
Liu et al. BMC Genetics (2015) 16:29
Page 6 of 10
Table 4 QTL detected for 7 physiological and 3 morphological traits based on data form year 2012, 2013 and mean
value form two years
Trait
Year
QTL
Chromosome
Nearest marker
Position (cM)
Interval (cM)
LOD
Explained variance (%)
Additive effect
Pn
2012
qPn2-10
2
Bmag829
75.9
73.9 - 79.2
3.43
8.66
−0.94
2012
qPn4-17
4
EBmac788
96.1
86.8 - 100.1
4.64
12.63
1.09
2013
qPn7-8
7
Bmag571
53.5
48.1 - 66.2
4.86
13.56
−1.19
2012
qGs2-10
2
Bmag829
75.9
73.9 - 80.2
3.49
7.78
−0.05
2012
qGs3-13
3
Bmag13
97.6
94.2 - 105.7
5.44
12.58
−0.07
2012
qGs7-6
7
Bmac31
47.1
37.5 - 50.3
5.95
13.92
−0.07
2013
qGs2-13
2
Bmac93
80.2
77.2 - 82.6
3.04
7.47
−0.04
2012
qCi2-16
2
GBM1119
87.1
84.0 - 90.0
4.93
13.75
−9.62
2012
qCi7-3
7
Bmag914
42.4
37.4 - 45.4
5.01
13.98
−9.78
2013
qCi2-14
2
Bmag518
81.5
78.1 - 84.4
3.75
10.69
−7.78
2012
qTr3-13
3
Bmag13
103.6
99.1 - 113.5
4.51
14.00
−0.69
2012
qTr7-6
7
Bmac31
47.1
44.1 - 48.4
5.58
14.02
−0.71
Gs
Ci
Tr
LA
FLL
FLW
RWC
SPD
LNC
2012
qLA2-12
2
GBM1218
77.2
75.9 - 78.9
7.09
18.80
2.17
2013
qLA2-12
2
GBM1218
77.2
75.9 - 80.2
5.22
12.48
2.00
2013
qLA3-9
3
Bmac129
56.3
55.5 - 57.3
3.77
8.72
−1.81
Mean
qLA2-12
2
GBM1218
77.2
75.9 - 79.2
14.17
29.83
2.53
2012
qFLL2-12
2
GBM1218
77.2
75.9 - 80.2
9.98
24.58
1.52
2012
qFLL7-10
7
GMS46
72.4
64.4 - 80.4
4.59
13.04
1.06
2013
qFLL2-12
2
GBM1218
79.2
76.2 - 83.6
10.16
25.36
1.53
2013
qFLL3-11
3
Bmag225
83.4
82.9 - 94.0
3.53
9.76
0.98
2013
qFLL7-6
7
Bmac31
47.1
45.6 - 49.2
3.22
7.07
0.79
Mean
qFLL2-12
2
GBM1218
79.2
76.2 - 81.1
14.98
31.29
1.55
Mean
qFLL7-8
7
Bmag571
55.5
52.6 - 58.3
8.81
16.66
1.14
2012
qFLW2-12
2
GBM1218
77.2
75.9 - 80.2
5.57
13.63
0.08
2013
qFLW2-12
2
GBM1218
77.2
75.9 - 80.2
7.86
20.93
0.09
2013
qFLW4-18
4
GBM1220
93.8
89.8 - 95.8
3.19
7.11
−0.05
Mean
qFLW2-12
2
GBM1218
77.2
75.9 - 80.2
7.31
14.23
0.08
Mean
qFLW4-18
4
GBM1220
93.8
88.2 - 95.8
8.90
22.06
−0.09
2012
qRWC6-6
6
GMS6
57.8
51.5 - 65.8
6.35
21.43
2.03
2012
qRWC7-9
7
Bmag746
62.3
60.5 - 74.2
5.77
15.31
−1.74
2013
qRWC6-6
6
GMS6
53.8
47.5 - 61.8
3.15
11.76
1.72
2012
qSPD2-10
2
Bmag829
75.9
73.9 - 79.4
6.97
17.28
−2.08
2012
qSPD7-7
7
Bmac167
47.5
46.1 - 49.5
4.57
10.78
−1.57
2013
qSPD2-10
2
Bmag829
75.9
73.9 - 78.9
6.27
15.44
−1.56
2013
qSPD7-9
7
Bmag746
58.9
57.6 - 61.5
4.48
10.64
−1.34
2012
qLNC1-10
1
EBmac501
48.1
45.4 - 49.3
3.27
7.14
−0.24
2013
qLNC1-8
1
Bmag211
41.1
39.7 - 45.3
3.37
8.46
−0.29
2013
qLNC2-10
2
Bmag829
75.9
73.9 - 78.9
3.12
6.53
−0.17
population. However, QTL associated with physiological
and morphological traits of flag leaf at the pre-filling
stage have not been systematically analyzed.
Leaf net photosynthetic rate was easily affected by environment factors. It was reported the net photosynthetic
rate was different in different environments including illumination intensity, temperature, content of CO2 and
moisture in the air [44]. In our experiment, we selected
9:00–11:00 am and 2:00–4:00 pm to measure photosynthesis based on the daily change rule of photosynthesis
Liu et al. BMC Genetics (2015) 16:29
and our operational experience that photosynthesis was
stable at these two time periods. In plant developmental
stage, the four traits Pn, Gs, Ci and Tr index reflect plant
photosynthetic capacity. The all four traits were closely related to grain yield. QTLs underlying Pn, Gs and Tr have
been analyzed in rice [2]. Wójcik-Jagła et al. [18] analyzed
QTL underlying net photosynthetic rate in barley, and
found one QTL nearby the marker bPb-8013 on chromosome 4H in the Suweren × MOB12055 population, one
QTL on chromosome 5H in the STH754 × STH836 population. In our study, we detected one QTL nearby the
marker EBmac788 on chromosome 4H. The consensus
map of Wenzl et al. [20] showed that the marker bPb8013 is far from EBmac788, indicating that the qPn4-17
was a new QTL identified here. In rice, QTL analysis of
several physiological traits related to photosynthesis had
been performed [2]. In our study, 9 QTLs controlling Gs,
Ci and Tr traits in barley flag leaf were detected. The identified QTLs may be useful for MAS in barley breeding.
To sustain crop growth and development, crop must
produce abundant nutrition. The amount of nutrition
produced mainly depends on flag leaf associated with
Pn, SPD, LNC and LA, which were closely related to
grain yield and biomass [3,7,9]. Four QTLs associated
with relative chlorophyll content were detected. QTL
qSPD2-10 was detected at 75.9 cM in 2012 and 2013, indicating this QTL was stable and less affected by environments. In barley, This et al. [17] detected 12 QTLs
underlying chlorophyll content on chromosome 2H, 4H,
5H, 6H and 7H. Xue et al. [11] detected two QTLs
underlying chlorophyll content on chromosome 2H.
One QTL related to SPD trait has mapped on chromosome 2H [26]. The high density consensus map [42] indicated the qSPD2-10 was close to the QTL (qFC2.2)
[11], between marker Bmag0518 and Bmac0093. The
QTL qSPD7-7 and qSPD7-9 were close to the centromere of chromosome 7H, and different from the QTL
on chromosome 7H reported previously [17,28]. Five
QTLs controlling nitrogen content of flag leaf were detected on chromosome 2H, 3H, 5H and 7H [12]. Mickelson et al. [15] detected 19 QTLs on chromosome 3H,
4H, 5H, 6H and 7H associated with nitrogen concentration in flag leaf. Three QTLs underlying LNC trait were
detected on chromosome 1H and 2H in our study, indicating that the two QTLs on chromosome 1H may be
new QTL underlying nitrogen concentration in flag leaf.
The QTL qLNC2-10 on centromere region of chromosome
2H is different from the QTL on chromosome 2H reported
previously [12]. Four QTLs associated with flag leaf area
were identified. The QTL qLA2-12 on chromosome 2H located at 77.2 cM was detected in both years and mean
value. Previous studies reported QTL underlying leaf area
on chromosome 1H, 2H, 3H, 4H, 5H and 7H [12,45]. The
qLA2-12 on 2HL is different from the QTL reported on
Page 7 of 10
2HS [12]. In our study, one region on chromosome 2H
flanked by Bmag829 and GBM1218 contained the qPn2-10,
qLA2-12, qSPD2-10 and qLNC2-10 (Figure 1), suggesting
that there might be QTL cluster for controlling grain yield
on chromosome 2H, and these molecular makers can be
used for MAS to improve breeding efficiency.
Since year effects and genotype × year interactions
were not significant (p > 0.05) for three morphological
traits (LA, FLL, FLW), QTL analysis was performed for
data from each year and mean value of two years. In our
study, 16 QTLs associated with the 3 morphological
traits (LA, FLL and FLW) were identified in two years
and mean values, which located on chromosome 2H,
3H, 4H and 7H, respectively. Elberse et al. [46] detected
6 QTLs underlying leaf length on chromosome 1H, 2H,
4H and 5H, 3 QTLs controlling leaf width on chromosome 2H, 4H and 6H. Li et al. [45] reported a chromosome region on 3HS underlying leaf length and leaf area.
Gyenis et al. [10] reported 3 QTLs controlling flag leaf
length on chromosome 3H, 5H and 7H, and 3 QTLs
underlying flag leaf width on 2H, 4H and 5H. Xue et al.
[11] detected 2 QTLs controlling flag leaf length on
chromosome 5H and 7H, and 2 QTLs controlling flag
leaf width on chromosome 5H. The QTL qFLL2-12 located on chromosome 2HL, and is different from the
QTL reported on 2HS [46]. The QTL, qFLW2-12 located on chromosome 2HL, and is different from those
QTLs reported on 2HS [10,46]. The 3 morphological
traits were significantly correlated with each other
(Table 3), a common QTL close to the marker
GBM1218 on chromosome 2H controlled these traits
(Figure 1; Table 4). Phenotypic correlations among traits
and identification of QTL were generally in good agreement. QTLs controlling LA, FLL and FLW were detected on the same region of chromosome 2H in both
years and mean values. This region was close to the
marker GBM1218, and contained the qLA2-12, qFLL212 and qFLW2-12 (Figure 1), indicating that this region
is important for controlling morphological trait in barley. Moreover, all QTL positive alleles except qLA3-9
and qFLW4-18 were contributed by Huadamai 6.
Photosynthesis process assimilates H2O and CO2 to
produce carbohydrates, and can be influenced by plant
water status. Relative water content of flag leaf is one
important assessment criterion about plant water status
[47]. In our study, one common QTL on the chromosome 6H is close to marker GMS6. Teulat et al. [40] detected one QTL on the chromosome 6H under two
different water treatments. Another study also detected
two QTLs on the long arm of chromosome 6H [16].
Previous studies on QTL underlying RWC trait of barley
flag leaf found 2 genome regions on the chromosome
6H associated with RWC, which were close to BCD348B
and BCD1, respectively [13,16,40,41]. These suggested
Liu et al. BMC Genetics (2015) 16:29
that there might be a QTL cluster in this region.
Chromosome 7H have 3 genome regions associated with
RWC, which are nearby RZ123, Acl3 and Bass1B, respectively [13,16,40,41]. The QTL qRWC6-6 detected in
present study was close to the marker BCD348B, and
the QTL qRWC7-9 was close to the marker RZ123.
In our study, two QTL cluster regions associated with
physiological and morphological traits, one each on the
chromosome 2H and 7H, were observed (Figure 1). The
head type trait was mapped on chromosome 2H between marker GBM1218 and Bmac93, which is close to
the QTL cluster region (Figure 1). The heading date trait
was also mapped on chromosome 2H close to marker
GBM1218 in the QTL cluster region [43]. The dwarfing
gene was mapped on chromosome 7H in the QTL cluster region [48]. The head type, heading date and plant
height traits were considered to be significantly associated
with grain yield [43,49,50]. The vrs1 locus controlling head
type was mapped on chromosome 2H [51,52]. From
we found that
the marker GBM1218 was close to vrs1 locus. Considering
all information here, we suggested that the head type,
heading date and plant height traits might be highly associated with these physiological and morphological traits,
and could be considered as important factors to control
grain yield. Pleiotropy and linkage were present in some
important traits associated with yield parameters [53]. In
present study, there exist widely co-localized QTL between physiological and morphological traits, such as Pn,
Gs, SPD, LNC traits on chromosome 2H nearby the
marker Bmag829, and LA, FLL, FLW traits on chromosome 2H nearby the marker GBM1218, where the vrs1
locus was mapped to. There is always a concentration of
QTL effects in the vrs1 locus. The co-localization of these
QTL is most likely due to pleiotropic effect or gene linkage. Distinguishing linkage from pleiotropy is important
for breeding purposes, especially if both desirable and undesirable traits are associated with the same locus or QTL
region [13]. Thus, in order to distinguish linkage and pleiotropy, further study is needed.
Conclusions
In this study, physiological and morphological traits
showed significant difference in two parents Huaai 11
and Huadamai 6. We found that chromosome 2H and 7H
each contained a QTL cluster region controlling grain
yield. The molecular makers (Bmag829 and GBM1218)
identified here can be used for marker assisted selection
to improve breeding efficiency.
Methods
Plant materials and field experiments
A barley DH population consisting of 122 DH lines was
derived from a cross between dwarfing barley cultivar
Page 8 of 10
Huaai 11 (six-rowed and dwarfing) and common feed barley cultivar Huadamai 6 (two-rowed and tall plant) using
anther culture. The two parents Huaai 11 and Huadamai
6 are significant difference in plant height [48], physiological and morphological traits of flag leaf. Experiment
was conducted in a rain shelter of the Huazhong Agricultural University, Wuhan, China. Side window of the rain
shelter was open to make inside temperature and radiation similar to outside condition. The experiments were
performed in year 2012 and 2013. The DH lines and parents were grown in a plot of 1.5 m long with interval of
0.6 m and 3 replications using a randomized complete
block design. Twenty seeds from each DH line and parent
were sown in two rows per plot. Prior to seeding, compound fertilizer (60 g/m2) was applied, and 20 g/m2 of
urea were applied at the elongation stage. At the prefilling stage, fully expanded flag leaves from main spike
were sampled and used to measure 7 physiological and 3
morphological traits.
Quantification of physiological traits of flag leaf at the
pre-filling stage
Four physiological traits, net photosynthetic rate (Pn,
umol CO2 m−2 s−1), stomatal conductance (Gs, mol H2O
m−2 s−1), intercellular CO2 concentration (Ci, μmol CO2
mol−1) and transpiration rate (Tr, mmol H2O m−2 s−1),
were measured using LI6400 XT Portable photosynthesis
system according to the methods described in [54].
Measuring time was selected during 9:00–11:00 am and
2:00–4:00 pm. Three fully expanded and sun-exposed
topmost flag leaves on main stem from each replication
were measured. The parameters were set as follow: LeafFan at Fast, Flow at 500 μmols−1, Mixer at 400 ppm,
Temp at off and Lamp according to the light intensity.
The data was recorded after these parameters reading
became relatively stable (usually about 1 min).
RWC quantification
Weighing method was applied to measure relative water
content (RWC) in flag leaves [16]. A flag leaf was sampled from each replication and measured 3 times. After
fresh leaves weighted (fw), leaves were immersed in a
sealed bag containing distilled water, and kept for
24 hours to achieve completely rehydration. Then the
turgid leaves were weighted (tw), and dried to constant
weight (dw). RWC was calculated as: RWC = (fw-dw)/
(tw-dw) × 100%.
SPD quantification
SPAD-502 chlorophyll photometer was used to measure
relative chlorophyll content (SPD) of flag leaves at the prefilling stage. Four flag leaves from each replication were
measured. SPD values in the top, medium and bottom part
of flag leaf were averaged from three replications.
Liu et al. BMC Genetics (2015) 16:29
LNC quantification
Leaf nitrogen concentration (LNC) was measured using
the Kjeldahl Nitrogen determination method. Ten flag
leaves from each replication were collected at the prefilling stage, immediately dried at 105°C in an oven for
at least 4 h and then ground into powder using Whirlwind grinding JFS-13A, and stored at 80°C until use.
Hanon SH220 was used to digest 0.2 g flag leaf powder.
The digestive juice was put in distillation Hanon K9840
Kjeldahl Auto Analyzer to measure consumed volume of
standard HCL. Total nitrogen in flag leaf (%) was calculated using the formula:
LNC %ị ẳ
C V V 0ị 14 Â 100
 100
M Â 10 Â 1000
Where: C is concentration of standard HCL in the titration (mol/L); V is consumed volume of standard HCL
in the titration sample (ml); V0 is consumed volume of
standard HCL in the titration blank group (ml); 14 is the
atomic mass of nitrogen (g); 100 is total volume of digestive juice (ml); 10 is extract volume of digestive juice
(ml); M is powder weight of sample (g).
Quantification of morphological traits
Flag leaf area (LA, area of total leaf, in cm2), flag leaf
length (FLL, from base of ligula to tip of leaf, in cm) and
flag leaf width (FLW, widest part of leaf, in cm) were measured using LI-3000C Portable Area Meter. Four flag
leaves of main spike from each replication were measured.
Data analysis
Statistics, correlation and QTL analyses were performed for
the data from each year. Mean value from two years was
also used for QTL analysis if genotype × year interaction
did not reach significant level for that trait. Homogeneity of
variance and normality of distribution were tested before
analysis of variance (ANOVA). Heritability was calculated
for each trait using ANOVA analysis. The General Linear
Model was used for analysis of variance. All analyses were
performed using IBM SPSS Statistics 19 software. P value
less than 0.05 was considered as significance.
Linkage map was constructed using the software MAPMAKER version 3.0 [55]. Genetic distance (centiMorgans,
cM) was derived from Kosambi function. The software
MapChart 2.2 was used to draw QTL location on the map.
Total of 153 SSR markers evenly distributed on 7 barley
chromosomes were used to construct a barley linkage map
as previous described [43,48]. The most likely location of
QTL and their genetic effects were detected by composite
interval mapping (CIM) using QTL Cartographer version
2.5 [56]. After performing 1000 permutation test, a LOD
threshold of 3.0 was used to declare presence of a putative
QTL in a given genomic region [57]. Composite interval
Page 9 of 10
mapping (CIM) was employed to identify QTL using
Model 6 of the Standard module. Cofactors were chosen
using the forward-backward method of stepwise regression.
The genome was scanned at 2 cM intervals and the window size set at 10 cM. Percentage of phenotypic variation
explained and additive effect of each QTL were also calculated by QTL Cartographer 2.5. QTL name was composed
of q, the abbreviation of trait, the location of chromosome
and the marker position on chromosome.
Abbreviations
DH: Double haploid; QTL: Quantitative trait locus; MAS: Marker assisted
selection; Pn: Net photosynthetic rate; Gs: Stomatal conductance;
Ci: Intercellular CO2 concentration; Tr: Transpiration rate; LA: Flag leaf area;
FLL: Flag leaf length; FLW: Flag leaf width; RWC: Relative water content;
SPD: Relative chlorophyll content; LNC: Leaf nitrogen concentration.
Competing interests
The authors declare that they have no competing interests.
Authors’ contributions
LL performed this study, statistical analysis and manuscript writing. XR
assisted in phenotyping and software analysis. DS and GS conceived this
study, coordinated the experiments, and wrote the manuscript. CL produced
the Huaai 11 and Huadamai 6 DH population. All authors have read and
approved the final version of this manuscript.
Acknowledgements
This project was supported in part by the National Natural Science
Foundation of China (31301310 and 31228017) and the earmarked fund for
China Agriculture Research System (CARS-5).
Author details
1
College of Plant Science and Technology, Huazhong Agricultural University,
Wuhan 430070, China. 2Biology Department, Saint Mary’s University, 923
Robie Street, Halifax, NS B3H 3C3, Canada. 3Department of Agriculture and
Food/Agricultural Research Western Australia, 3 Baron-Hay Court, South
Perth, WA 6155, Australia. 4Hubei Collaborative Innovation Center for Grain
Industry, Wuhan 430070, China.
Received: 10 December 2014 Accepted: 6 March 2015
References
1. Horsley RD, Franckowiak JD, Schwarz PB. Barley. In: Carena MJ, editor.
Cereals. US: Springer; 2009. p. 227–50.
2. Teng S, Qian Q, Zeng D, Kunihiro Y, Fujimoto K, Huang D, et al. QTL analysis
of leaf photosynthetic rate and related physiological traits in rice (Oryza
sativa L). Euphytica. 2004;135:1–7.
3. Berdahl JD, Rasmusson DC, Moss DN. Effects of leaf area on photosynthetic
rate, light penetration, and grain yield in barley. Crop Sci. 1972;12:177–80.
4. Flood PJ, Harbinson J, Aarts MG. Natural genetic variation in plant
photosynthesis. Trends Plant Sci. 2011;16:327–35.
5. Sarrafi A, Planchon C, Ecochard R, Sioud Y. Inheritance of some
physiological factors of productivity in barley. Genome. 1987;29:846–9.
6. Tungland L, Chapko LB, Wiersma JV, Rasmusson DC. Effect of erect leaf
angle on grain yield in barley. Crop Sci. 1987;27:37–40.
7. Yap TC, Harvey BL. Relations between grain yield and photosynthetic parts
above the flag leaf node in barley. Can J Plant Sci. 1972;52:241–6.
8. Sicher RC. Assimilate partitioning within leaves of small grain cereals. In:
Abrol YP, Mohanty P, Govindjee, editors. Photosynthesis: Photoreactions to
Plant Productivity. Netherlands: Springer; 1993. p. 351–60.
9. Thorne GN. Photosynthesis of ears and flag leaves of wheat and barley. Ann
Bot. 1965;29:317–29.
10. Gyenis L, Yun SJ, Smith KP, Steffenson BJ, Bossolini E, Sanguineti MC, et al.
Genetic architecture of quantitative trait loci associated with morphological
and agronomic trait differences in a wild by cultivated barley cross.
Genome. 2007;50:714–23.
Liu et al. BMC Genetics (2015) 16:29
11. Xue D, Chen M, Zhou M, Chen S, Mao Y, Zhang G. QTL analysis of flag leaf
in barley (Hordeum vulgare L.) for morphological traits and chlorophyll
content. J Zhejiang Uni Sci B. 2008;9:938–43.
12. Yin X, Kropff MJ, Stam P. The role of ecophysiological models in QTL analysis:
the example of specific leaf area in barley. Heredity. 1999;82:415–21.
13. Diab AA, Teulat-Merah B, This D, Ozturk NZ, Benscher D, Sorrells ME. Identification
of drought-inducible genes and differentially expressed sequence tags in barley.
Theo Appl Genet. 2004;109:1417–25.
14. Guo P, Baum M, Varshney RK, Graner A, Grando S, Ceccarelli S. QTLs for
chlorophyll and chlorophyll fluorescence parameters in barley under postflowering drought. Euphytica. 2008;163:203–14.
15. Mickelson S, See D, Meyer FD, Garner JP, Foster CR, Blake TK, et al. Mapping
of QTL associated with nitrogen storage and remobilization in barley
(Hordeum vulgare L.) leaves. J Exp Bot. 2003;54:801–12.
16. Teulat B, Zoumarou-Wallis N, Rotter B, Salem MB, Bahri H, This D. QTL for
relative water content in field-grown barley and their stability across
Mediterranean environments. Theor Appl Genet. 2003;108:181–8.
17. This D, Borries C, Souyris I, Teulat B. QTL study of chlorophyll content as a
genetic parameter of drought tolerance in barley. Barley Genet Newsl.
2000;30:20–3.
18. Wójcik-Jagła M, Rapacz M, Tyrka M, Kościelniak J, Crissy K, Żmuda K.
Comparative QTL analysis of early short-time drought tolerance in
Polish fodder and malting spring barleys. Theor Appl Genet. 2013;126:3021–34.
19. Qi X, Stam P, Lindhout P. Comparison and integration of four barley genetic
maps. Genome. 1996;39:379–94.
20. Wenzl P, Li H, Carling J, Zhou M, Raman H, Paul E, et al. A high-density
consensus map of barley linking DArT markers to SSR. RFLP and STS loci
and agricultural traits. BMC Genomics. 2006;7:206.
21. Horton P. Prospects for crop improvement through the genetic
manipulation of photosynthesis: morphological and biochemical aspects of
light capture. J Exp Bot. 2000;51:475–85.
22. Rawson HM, Constable GA. Carbon production of sunflower cultivars in field
and controlled environments. I. Photosynthesis and transpiration of leaves,
stems and heads. Funct Plant Biol. 1980;7:555–73.
23. Jiang Q, Roche D, Monaco TA, Hole D. Stomatal conductance is a key
parameter to assess limitations to photosynthesis and growth potential in
barley genotypes. Plant Biol. 2006;8:515–21.
24. Rybiński W, Garczyński S. Influence of laser light on leaf area and parameters
of photosynthetic activity in DH lines of spring barley (Hordeum vulgare L.).
Int Agrophys. 2004;18:261–8.
25. Rhodes MJC, Yemm EW. The development of chloroplasts and photosynthetic
activities in young barley leaves. New Phytol. 1966;65:331–42.
26. Von Korff M, Grando S, Del Greco A, This D, Baum M, Ceccarelli S.
Quantitative trait loci associated with adaptation to Mediterranean dryland
conditions in barley. Theor Appl Genet. 2008;117:653–69.
27. Araus JL, Amaro T, Voltas J, Nakkoul H, Nachit MM. Chlorophyll fluorescence
as a selection criterion for grain yield in durum wheat under Mediterranean
conditions. Field Crops Res. 1998;55:209–23.
28. Siahsar BA, Aminfar Z. Mapping QTLs of physiological traits associated with
salt tolerance in ‘Steptoe’ × ‘Morex’ doubled haploid lines of barley at
seedling stage. J Food Agric Environ. 2010;8:751–9.
29. Yang L, Mickelson S, See D, Blake TK, Fischer AM. Genetic analysis of the
function of major leaf proteases in barley (Hordeum vulgare L.) nitrogen
remobilization. J Exp Bot. 2004;55:2607–16.
30. Sinclair TR, Horie T. Leaf nitrogen, photosynthesis, and crop radiation use
efficiency: a review. Crop Sci. 1989;29:90–8.
31. Lewis OAM, James DM, Hewitt EJ. Nitrogen assimilation in barley (Hordeum
vulgare L. cv. Mazurka) in response to nitrate and ammonium nutrition. Ann
Bot. 1982;49:39–49.
32. Shangguan Z, Shao M, Dyckmans J. Effects of nitrogen nutrition and water
deficit on net photosynthetic rate and chlorophyll fluorescence in winter
wheat. J Plant Physiol. 2000;156:46–51.
33. Sage RF, Pearcy RW. The nitrogen use efficiency of C3 and C4 plants II. Leaf
nitrogen effects on the gas exchange characteristics of Chenopodium album
(L.) and Amaranthus retroflexus (L.). Plant Physiol. 1987;84:959–63.
34. Teulat B, Monneveux P, Wery J, Borries C, Souyris I, Charrier A, et al.
Relationships between relative water content and growth parameters under
water stress in barley: a QTL study. New Phytol. 1997;137:99–107.
35. Johnson RR, Frey NM, Moss DN. Effect of water stress on photosynthesis
and transpiration of flag leaves and spikes of barley and wheat. Crop Sci.
1974;14:728–31.
Page 10 of 10
36. González A, Martín I, Ayerbe L. Yield and osmotic adjustment capacity of
barley under terminal water‐stress conditions. J Agron Crop Sci.
2008;194:81–91.
37. Zhao J, Sun H, Dai H, Zhang G, Wu F. Difference in response to drought
stress among Tibet wild barley genotypes. Euphytica. 2010;172:395–403.
38. Matin MA, Brown JH, Ferguson H. Leaf water potential, relative water
content, and diffusive resistance as screening techniques for drought
resistance in barley. Agron J. 1989;81:100–5.
39. Sinclair TR, Ludlow MM. Who taught plants thermodynamics? The
unfulfilled potential of plant water potential. Aust J Plant Physiol.
1985;12:213–7.
40. Teulat B, This D, Khairallah M, Borries C, Ragot C, Sourdille P, et al. Several
QTLs involved in osmotic-adjustment trait variation in barley (Hordeum
vulgare L.). Theor Appl Genet. 1998;96:688–98.
41. Teulat B, Borries C, This D. New QTLs identified for plant water status, watersoluble carbohydrate and osmotic adjustment in a barley population grown
in a growth-chamber under two water regimes. Theor Appl Genet.
2001;103:161–70.
42. Varshney RK, Marcel TC, Ramsay L, Russell J, Röder MS, Stein N, et al. A high
density barley microsatellite consensus map with 775 SSR loci. Theor Appl
Genet. 2007;114:1091–103.
43. Ren X, Sun D, Sun G, Li C, Dong W. Molecular detection of QTL for
agronomic and quality traits in a doubled haploid barley population. Aust J
Crop Sci. 2013;7:878–86.
44. Murchie EH, Pinto M, Horton P. Agriculture and the new challenges for
photosynthesis research. New Phytol. 2009;181:532–52.
45. Li JZ, Huang XQ, Heinrichs F, Ganal MW, Röder MS. Analysis of QTLs for
yield components, agronomic traits, and disease resistance in an advanced
backcross population of spring barley. Genome. 2006;49:454–66.
46. Elberse IAM, Vanhala TK, Turin JHB, Stam P, van Damme JMM, van
Tienderen PH. Quantitative trait loci affecting growth-related traits in wild
barley (Hordeum spontaneum) grown under different levels of nutrient
supply. Heredity. 2004;93:22–33.
47. Forster BP, Ellis RP, Moir J, Talame V, Sanguineti MC, Tuberosa R, et al.
Genotype and phenotype associations with drought tolerance in barley
tested in North Africa. Ann Appl Biol. 2004;144:157–68.
48. Ren X, Sun D, Guan W, Sun G, Li C. Inheritance and identification of
molecular markers associated with a novel dwarfing gene in barley. BMC
Genet. 2010;11:89.
49. Cuesta-Marcos A, Casas AM, Hayes PM, Gracia MP, Lasa JM, Ciudad F, et al.
Yield QTL affected by heading date in Mediterranean grown barley. Plant
Breed. 2009;128:46–53.
50. Garcı́a del Moral LF, Garcı́a del Moral MB, Molina-Cano JL, Slafer GA. Yield
stability and development in two-and six-rowed winter barleys under
Mediterranean conditions. Field Crops Res. 2003;81:109–19.
51. Pourkheirandish M, Wicker T, Stein N, Fujimura T, Komatsuda T. Analysis of
the barley chromosome 2 region containing the six-rowed spike gene vrs1
reveals a breakdown of rice–barley micro collinearity by a transposition.
Theor Appl Genet. 2007;114:1357–65.
52. Komatsuda T, Li W, Takaiwa F, Oka S. High resolution map around the vrs1
locus controlling two- and six-rowed spike in barley, Hordeum vulgare.
Genome. 1999;42:248–53.
53. Marquez-Cedillo LA, Hayes PM, Kleinhofs A, Legge WG, Rossnagel BG, Sato
K, et al. QTL analysis of agronomic traits in barley based on the doubled
haploid progeny of two elite North American varieties representing
different germplasm groups. Theor Appl Genet. 2001;103:625–37.
54. Rapacz M, Kościelniak J, Jurczyk B, Adamska A, Wójcik M. Different patterns
of physiological and molecular response to drought in seedlings of maltand feed-type barleys (Hordeum vulgare). J Agron Crop Sci. 2010;196:9–19.
55. Lander ES, Green P, Abrahamson J, Barlow A, Daly MJ, Lincoln SE, et al.
MAPMAKER: an interactive computer package for constructing primary genetic
linkage maps of experimental and natural populations. Genomics. 1987;1:174–81.
56. Wang S, Basten CJ, Zeng ZB. Windows QTL Cartographer 2.5. Raleigh, NC:
Department of Statistics, North Carolina State Univ; 2007.
57. Churchill GA, Doerge RW. Empirical threshold values for quantitative trait
mapping. Genetics. 1994;138:963–71.