Extreme expansion of NBS-encoding genes in Rosaceae
Bạn đang xem bản rút gọn của tài liệu. Xem và tải ngay bản đầy đủ của tài liệu tại đây (803 KB, 12 trang )
Jia et al. BMC Genetics (2015) 16:48
DOI 10.1186/s12863-015-0208-x
RESEARCH ARTICLE
Open Access
Extreme expansion of NBS-encoding genes
in Rosaceae
YanXiao Jia†, Yang Yuan†, Yanchun Zhang, Sihai Yang* and Xiaohui Zhang*
Abstract
Background: Nucleotide binding site leucine-rich repeats (NBS-LRR) genes encode a large class of disease resistance
(R) proteins in plants. Extensive studies have been carried out to identify and investigate NBS-encoding gene
families in many important plant species. However, no comprehensive research into NBS-encoding genes in the
Rosaceae has been performed.
Results: In this study, five whole-genome sequenced Rosaceae species, including apple, pear, peach, mei, and strawberry,
were analyzed to investigate the evolutionary pattern of NBS-encoding genes and to compare them to those of
three Cucurbitaceae species, cucumber, melon, and watermelon. Considerable differences in the copy number of
NBS-encoding genes were observed between Cucurbitaceae and Rosaceae species. In Rosaceae species, a large
number and a high proportion of NBS-encoding genes were observed in peach (437, 1.52%), mei (475, 1.51%),
strawberry (346, 1.05%) and pear (617, 1.44%), and apple contained a whopping 1303 (2.05%) NBS-encoding genes,
which might be the highest number of R-genes in all of these reported diploid plant. However, no more than 100
NBS-encoding genes were identified in Cucurbitaceae. Many more species-specific gene families were classified and
detected with the signature of positive selection in Rosaceae species, especially in the apple genome.
Conclusions: Taken together, our findings indicate that NBS-encoding genes in Rosaceae, especially in apple, have
undergone extreme expansion and rapid adaptive evolution. Useful information was provided for further research on
the evolutionary mode of disease resistance genes in Rosaceae crops.
Keywords: NBS-encoding gene, Rosaceae, Cucurbitaceae, Expansion, Rapid evolution
Background
The battle between plants and pathogens has gone on
since they first emerged in the Earth’s ecosystem. This
ongoing battle against pathogens has led to two types
of immune responses in plants: a basal response to
pathogen-associated molecular patterns (PAMPs) and a
gene-for-gene response specific to a pathogen [1-4]. The
former is present constitutively and the latter is induced
upon exposure to pathogens. The latter, which is mediated
by plant resistance (R) genes, is better studied. Plants have
R genes whose products can recognize the complementary
avirulence genes of pathogens. This defense mechanism
has aroused people’s great interest, because it is possible
to exploit the natural inducible defenses to engineer
* Correspondence: ;
†
Equal contributors
State Key Laboratory of Pharmaceutical Biotechnology, School of Life
Sciences, Nanjing University, 210023 Nanjing, China
broad-spectrum pathogen resistance. It will be of great
significance in crop breeding.
Numerous R genes from many plants have been
cloned and characterized over the past few decades.
Most cloned R genes belong to a large gene family. In
this family, the genes encode proteins with nucleotide
binding sites and leucine rich repeats (NBS-LRR) domain [5]. Moreover, according to the N-terminal of proteins, the NBS-LRR gene family can be further classified
into two types, TIR-NBS-LRR (TIR) genes with a Toll/
Interleukin-1 (TIR) receptor domain and non-TIR-NBSLRR (non-TNL) genes that lack the TIR domain. These
often have a coiled-coil (CC) domain instead [6,7].
When a genome sequence is available, the analysis of
large gene families is helpful to understand the major
events responsible for their molecular evolution. In recent
years, lots of plant species have been whole-genome sequenced and these provide abundant materials for investigating the evolutionary patterns of R genes. Studies of the
© 2015 Jia et al.; licensee BioMed Central. This is an Open Access article distributed under the terms of the Creative Commons
Attribution License ( which permits unrestricted use, distribution, and
reproduction in any medium, provided the original work is properly credited. The Creative Commons Public Domain
Dedication waiver ( applies to the data made available in this article,
unless otherwise stated.
Jia et al. BMC Genetics (2015) 16:48
NBS gene family has been performed in many monocots
and dicots, such as Oryza sativa, Zea mays, Populus
trichocarpa, Malus domestica, Arabidopsis thaliana, Brassica rapa, Citrus sinensis, and Solanum tuberosum [8-18].
All the results have shown that the size of the NBS gene
family differs in each species. In general, approximately
0.2–1.6% of genes predicted in plant genomes are NBSencoding genes. They also have diverse evolutionary
characters. Frequent gene duplications and gene loss of
NBS-encoding genes in different species have been observed, indicating a rapid evolution of this gene family.
A few studies focused on comparative analysis of NBS
genes among closely related species provide more information that can be used to assess the evolutionary
process and identify unique and identical evolutionary
patterns of R genes. Comparative analysis of NBS-LRR
genes in four gramineous species, rice, maize, sorghum,
and brachypodium, showed considerable copy number
variation and a tendency of gene loss in grass species
[19]. Similarly, Luo et al. also investigated the R genes in
four Poaceae species and observed frequent deletions
and translocations [20]. A survey of R genes in different
Cucurbitaceae species has indicated that Cucurbitaceae
species harbor a limited number of R gens. It can be
inferred that the reasons for the low copy number of R
genes are frequent loss and infrequent duplications [21].
Recently, four species of the legume family, including
Medicago truncatula, soybean, common bean, and
pigeon pea, also have been studied in genome-wide to
investigate the NBS-LRR genes [12]. This study indicated
differential NBS gene loss and frequent duplications
during legume evolution and ectopic duplications were
supposed to create many novel NBS gene loci in individual legume genomes.
As more genomic data have been available for some
angiosperm families, NBS-LRR genes should be further investigated among phylogenetically similar related species
to fill the gaps in the understanding of their evolutionary
patterns. The Rosids comprise a very large group of
eudicots, containing 16 orders and splitting between the
Fabids (Euroside I) and the Malvids (Euroside II). The
Fabids contains many plants of great agricultural importance, such as members of the Rosaceae, Cucurbitaceae
and Fabaceae. Rosaceae comprises approximately 3400
species and it grows throughout the world. The family is
important, because it includes many economically important genera such as Malus (apples), Pyrus (pears), Prunus
(plums, cherries, almonds, apricots), Rubus (raspberries,
blackberries), and Fragaria (strawberries). The rose family
is also a source of ornamental plants. The Rosaceae
constantly face threats from various pathogens, including
bacteria, fungi, nematodes, and viruses. However, few
functional R genes in Rosaceae have been identified and
cloned [22,23]. Therefore, it would be interesting to
Page 2 of 12
investigate the R gene repertoire among different Rosaceae
species. The gourd family (Cucurbitaceae) also contains
many useful species of food and ornamental plants. It
includes the gourds, melons, squashes, and pumpkins.
Like other plants, the gourd family also faces an extensive
damage in productivity because of lots of diseases. It is
reported that NBS genes in Rosaceae have experienced
expansion and more than 1000 NBS-LRRs have been detected in apple [8,24], whereas Cucurbitaceae species have
been found to contain a limited number of R genes (<100)
[21]. The distinct features of R genes in the two families of
Euroside I provide an interesting topic for comparing and
uncovering the different evolutionary patterns of R genes
in the two families of Rosids.
Here, five genomes of representative species in various
Rosaceae genera, Prunus persica, Prunus mume, Fragaria
vesca, Pyrus bretschneideri Rehd, and Malus domestica,
were used for a comprehensive analysis of R genes
[24-28]. Meanwhile, we reannotated R genes from three
sequenced genomes in the gourd family, including Cucumis sativus, Cucumis melo, and Citrullus lanatus [29-32].
A comparative analysis of R genes was performed between
Rosaceae and Cucurbitaceae. Considerable copy number
variations of NBS-encoding genes were observed between
the Cucurbitaceae and Rosaceae species. Fewer than 100
NBS-encoding genes were identified in Cucurbitaceae
while 346-1303 NBS genes were found in Rosaceae. Many
more species-specific gene families were detected in Rosaceae species, especially in the apple genome, suggesting a
recent expansion of R genes in these genomes. The possible reason for the differentiation in the gene copy number is discussed.
Results
Numbers of NBS-encoding gene in different plant
genomes
Eight plant species from Cucurbitaceae and Rosaceae were
selected to identify and compare NBS-encoding genes in
their genomes (Figure 1). Three of the eight species were
from the Cucurbitaceae: cucumber (Cucumis sativus),
melon (Cucumis melo) and watermelon (Citrullus lanatus),
while the other five were from the Rosaceae, peach (Prunus
persica), mei (Prunus mume), strawberry (Fragaria vesca),
pear (Pyrus bretschneideri) and apple (Malus domestica).
Additionally, Cannabis (Cannabis sativa) was selected as
an outer group species of the Rosaceae [33], while poplar
(Populus trichocarpa), soybean (Glycine max) and grape
(Vitis vinifera) were chosen as examples of the Salicaceae,
Leguminosae, and Vitaceae families [34-36].
Different patterns in NBS-encoding gene numbers
were observed between Cucurbitaceae and Rosaceae.
Fewer than 100 NBS-encoding genes were identified in
all of these cucurbitaceous species (Table 1). Three sequenced genomes of cucumber (V1,V2 and VW) had 59,
Jia et al. BMC Genetics (2015) 16:48
Page 3 of 12
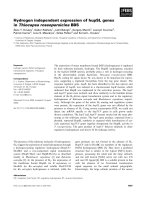
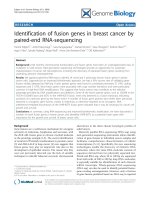
Figure 1 Species tree of plant species used in this study. Stars indicate the occurrence of recent whole genome duplication (WGD). Numbers in
the figure indicate species divergence time. Units: MYA (million years ago). The data were downloaded from NCBI Common Tree in the Taxonomy
section ( and the tree was constructed using TreeView.
62, and 71 NBS-encoding genes, respectively, while
melon and watermelon contained 80 and 45 NBSencoding genes, respectively. The proportions of NBSencoding genes in the whole genome were also low
(0.19%–0.27%), which may be the lowest level reported
so far, indicating that the cucurbitaceous species may
have other mechanisms of disease resistance that reduced their need to have as many NBS-encoding genes
as other plants [30,31].
On the contrary, the rosaceous species had a large
number and a high proportion of NBS-encoding genes.
Peach, mei, strawberry and pear each had 437, 475, 346,
and 617 NBS-encoding genes, while apple even contained 1303 NBS-encoding genes, which might have the
highest R-gene numbers in all of these reported diploid
plants (Table 1). These NBS-encoding genes accounted
for about 1.05–2.05%, of all predicted genes in the five
rosaceous species. Only 234 NBS-encoding genes were
identified in the outgroup, Cannabis, suggesting a common expansion of NBS-encoding genes after the split
between cannabis and the ancestor of Rosaceae species.
Moreover, NBS-encoding genes in the five Rosaceae species might have different evolutionary patterns after their
split from the common ancestors due to that their copy
numbers of NBS-encoding genes varied great differently.
For example, although pear and apple are both Maloideae
species and diverged from each other not long ago, the
number of NBS-encoding genes in apple was 2-fold
greater than in pear. Meanwhile, pear and apple contained
1.3-3.8 times of NBS genes than their relative species. The
other three species, poplar, grape and soybean, which are
evolutionarily distant from the Cucurbitaceae and Rosacea
in the phylogenetic tree, contained 402, 341, and 392
NBS-encoding genes, respectively.
Table 1 NBS-encoding genes among surveyed plant species
Family
Species
Sequenced
length (Mb)
Genome
size (Mb)
Estimated
gene number
Number of
NBS-encoding
genes
Percentage of
NBS-encoding
genes
Reference
Cucurbitaceae
Cucumber V1
243.5
367
26682
59
0.22%
30
Cucumber V2
203
367
25600
62
0.24%
30
Rosaceae
Cucumber VW
224
367
26548
71
0.27%
32
Melon
375
450
27427
80
0.23%
29
Watermelon
353.5
425
23440
45
0.19%
31
Peach
224.6
265
27852
437
1.52%
25
Mei
237
280
31390
475
1.51%
27
Strawberry
240
240
34809
346
1.05%
28
Pear
512
527
42812
617
1.44%
26
Apple
604
742
57386
1303
2.05%
22
Cannabis
534
818/843
~30,000
234
0.78%
33
Poplar
485
550
45654
402
0.88%
35
Grape
487
475
30434
341
1.12%
34
Soybean
950
1,115
46430
392
0.84%
36
Jia et al. BMC Genetics (2015) 16:48
Classification of TIR and non-TIR NBS-encoding genes
The NBS-encoding genes usually can be further classified
into two types based on the structures of N-terminus: the
TIR subclass and the non-TIR subclass. Based on Pfam results and the phylogenetic tree (Figures 2, Additional file 1:
Figure S1, Additional file 2: Figure S2, and Additional
file 3: Figure S3), we divided all NBS-encoding genes
into TIR and non-TIR NBS-encoding genes. A total of
1705 TIR genes and 1754 non-TIR genes were detected.
In general, each genome had similar numbers of TIR
genes and non-TIR genes (41% to 55%, Table 2).
To further classify these TIR genes and non-TIR genes,
we categorized them into different groups based on N and
C terminal domains. Of the TIR-NBS-encoding genes,
four sub-types, TIR-NBS-LRR (TNL), TIR-NBS (TN),
X-NBS-LRR (XNL), and X-NBS (XN) were identified
(Table 2). Over 60% TIR genes had the LRR domains
(1028/1705). In each genome, TNL genes made up the
greatest proportion of all genes detected. Similarly, nonTIR genes were also classified into four types, including
158 CC-NBS (CN), 799 CC-NBS-LRR (CNL), 214 X-NBS
(XN), and 608 X-NBS-LRR (XNL) (Table 2).
Although the number of TIR and non-TIR genes in each
species was almost identical, the average exon number
was greatly different (Additional file 4: Table S1). TIR
genes were predicted to have 6.2 exons in average, which
is significantly larger than the average number of non-TIR
genes, 2.9 (t-test, P < 0.001). For each plant, the average
numbers of TIR exons were 1.5–2.8-fold greater than
non-TIRs. This was consistent with the results of a
previous study in the Arabidopsis, poplar and grapevine
genomes, which may support the idea that CNLs tend to
be encoded by a single exon while TNLs gravitate towards
multiple exons [9,37]. Results showed both the exon
numbers of TIR and non-TIR genes in strawberry were
the largest.
Identification of different types of gene families and
genome organization analysis
All NBS-encoding genes were classified into families based
on the sequence similarity >60% and coverage >60%. A
total of 1006 gene families were identified, including 828
species-specific gene families and 178 multi-species gene
families (Tables 3, 4 and 5). Different features of speciesspecific and multi-species gene families were observed in
different species. About 70–100% of species-specific gene
families are single gene families. All peach-specific and
watermelon-specific gene families contained exactly one
member each. The average gene number of speciesspecific gene families ranged from 1–1.7 (Table 3). The
proportions of genes in species-specific gene families
focused on and mostly resided in 14.2–31.1%. The proportions of species-specific genes were oddly high in strawberry (84.4%) and cannabis (99.1%). Meanwhile, only 9
Page 4 of 12
and 5 large families (family members ≥5) were identified
in strawberry and cannabis, respectively. These results
indicate that the two species have a relatively distant relationship with other Rosaceae species and have experienced
few recent duplication events.
For Cucurbitaceae, most lineage-specific families contained genes from all the three species, suggesting that
most NBS-encoding genes in multi-species gene families
are present in the ancestor and retained after the split of
the three species (Table 4). Then, the cucumber-melonlineage-specific gene families occupied the second largest proportions, far exceeding to the other types. This
is consistent with the fact that cucumber is more similar
to melon than to watermelon.
Although 16 types of multi-species families were classified
in Rosaceae and Cannabis, only 12 types had no more than
three families (Table 5). The four main types of gene families are Apple-Mei-Peach-Pear-Strawberry (AMPcPrS, 14),
Apple-Mei-Peach-Pear (AMPcPr, 28), Apple-Pear (APr, 37),
and Mei-Peach (MPc, 48). The 14 AMPcPrS-type gene
families containing 453 genes are relatively conserved and
ancient. The average number of genes for 14 families is
11.1 in apple, 5.9 in mei, 6.3 in peach, 6.1 in pear and 3 in
strawberry. In these ancient gene families, gene duplication and gene loss events have occurred frequently in
these species. Similar results could be inferred from other
three types of families. There are 28 AMPcPr-type large
families that lack any genes from strawberry and the mean
number of genes in each family of the four species ranged
from 5.3–17.8, which suggested that these families were
produced in the progenitor of the four species but after
the divergence from strawberry. The average number of
genes per family in apple was always at least 2-fold larger
than other species, and the average number in mei and
peach was similar. Together with the fact that more than
1000 NBS-encoding genes were found in apple but their
sister species, pear, only contained about 600 NBS genes,
it is reasonable that large scale of gene duplications have
occurred in the apple genome after it is raised up. Additionally, there is a family of Apple -Pear-Strawberry
(APrS)-specific, containing 99 members, 49 apple genes,
45 pear genes, and 5 strawberry genes. It indicates that
some ancient genes had been lost in mei and peach, and
new genes emerged and spread in the progenitors of apple
and pear.
To estimate and compare the evolutionary characters of
genes in different types of families, the average nucleotide
divergence was calculated and their selection force was estimated. Families that had fewer than 3 members were excluded from further study. On the whole, the average
nucleotide divergence of genes in each species-specific
gene family was much lower than in multi-species gene
families (Table 4). In species-specific gene families, melon
and watermelon-specific genes have lowest nucleotide
Jia et al. BMC Genetics (2015) 16:48
Page 5 of 12
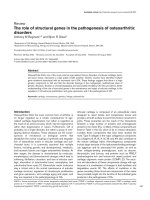
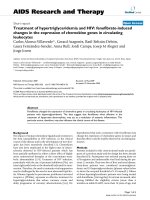
Figure 2 Phylogenetic tree based on NBS domain of NBS-encoding genes in cucumber, melon and watermelon. Red lines represent TIR genes
and black lines represent non-TIR genes. NBS-encoding genes from cucumber, melon and watermelon are shown as light green circles, green
circles and brown circles, respectively. The brackets denote species-specific gene clades.
Jia et al. BMC Genetics (2015) 16:48
Page 6 of 12
Table 2 Numbers of TIR and non-TIR NBS-encoding genes
Species
TIR genes
Cucumber.V1
Non-TIR genes
XN
XNL
TN
TNL
Sum
CN
CNL
XN
XNL
Sum
1
9
5
12
27
4
12
6
10
32
Cucumber.V2
0
8
3
15
26
1
16
3
16
36
Cucumber.VW
4
6
2
21
33
2
17
7
12
38
Melon
2
8
4
21
35
5
14
12
14
45
Watermelon
0
5
3
12
20
0
8
7
10
25
Peach
10
23
15
133
181
9
112
27
101
249
Mei
10
27
32
155
224
22
104
28
93
247
Strawberry
6
15
15
117
153
9
94
19
71
193
Pear
22
54
25
241
342
23
152
24
76
275
Apple
88
184
91
301
664
83
270
81
205
639
Sum
143
339
195
1028
1705
158
799
214
608
1754
divergence and strawberry and cannabis, which have large
number of species-specific gene families, show higher
nucleotide divergence. The average nucleotide divergence
of multi-species gene families ranged from 0.109 to
0.548. Although all the average values of Ka/Ks <1 were
observed, according to the result of PAML, 117 of 154
(76.0%) gene families were detected with significant positive selection sites and about 82.4% species-specific gene
families and 72.8% multi-species gene families were significant under a positive selection (P < 0.05).
Gene expansions are common in NBS-encoding genes.
Here, the phenomenon is also observed in Rosaceae species. It is reported that both tandem and large-scale block
duplication contributed to the expansion of this gene
group [38]. To check the genome organization of these
expanded genes in Rosaceae species, tandem duplicated
and segmental duplicated NBS-encoding genes were identified (see Methods for details). The apple genome has not
been assembled into chromosomes or large scaffolds but
into metacontigs and small scaffolds. Therefore, according
to our definitions of tandem duplication, only 34 of 1100
NBS-endoing genes were identified as tandem duplication
genes, because most genes in a gene family reside in the
different scaffolds. Under the same reason, it is impossible
to identify the segmental duplication events in the apple
genome. Except the apple genome, we successfully identify
the tandem duplication and segmental duplication in
other four Rosaceae species. If the definition of physical
length for tandem duplication is 100 kb, about 83.6, 73.3,
74.3 and 54.1% of NBS-encoding genes in peach, pear,
plum and strawberry were respectively detected in tandem
duplicated manners. These values become slight lower
(75.8, 65.6, 65.9 and 49.7%, respectively) when 50 kb is
used for defining the tandem duplicated genes. Conversely, in peach, pear, plum and strawberry, only 22, 36,
29 and 11 segmentally duplicated blocks with syntenically
homoelogous NBS-encoding genes and their flanking
genes were detected, containing 22.9, 31.7, 32.6 and 27.5%
NBS-encoding genes. These results suggested that tandem
duplication, but not segmental duplication, played a
Table 3 Analysis of species-specific gene families in Cucurbitaceae and Rosaceae
Species
Number
of family
Number
of genes
Average gene
member
Members of
largest family
Average nucleotide
divergence
Ave_Ka/Ks
PAML (* + **|All)
Cucumber
13
14
1.1
2
0.223
0.519
-
Melon
21
26
1.2
2
0.071
0.772
-
Watermelon
14
14
1
1
-
-
-
Apple
215
287
1.3
12
0.087
0.836
11|13
Peach
63
63
1
1
-
-
-
Pear
72
88
1.2
4
0.099
0.617
3|4
Mei
93
95
1
2
0.119
0.453
-
Strawberry
200
292
1.5
22
0.207
0.667
16|16
Cannabis
137
232
1.7
11
0.148
0.501
12|18
*P < 0.01; **P <0.05.
Jia et al. BMC Genetics (2015) 16:48
Page 7 of 12
Table 4 Analysis of multi-species gene families in Cucurbitaceae
Type of
gene family
Average number of members
Number
of gene
family
Number
of genes
Members
of largest
family
Average
nucleotide
divergence
Ave_Ka/Ks
PAML
(* + **|All)
C
M
W
CM
1.2
1.3
-
11
27
4
0.424
0.548
4|4
CW
1.0
-
1.0
1
2
2
0.231
0.414
-
MW
-
1.0
1.0
1
2
2
0.148
0.295
-
CMW
1.6
2.1
1.5
19
99
18
0.189
0.397
5|10
C: Cucumber; M: Melon; W: Watermelon.
*P < 0.01; **P <0.05.
major role in NBS-encoding gene expansion in the four
Rosaceae species.
Phylogenetic analysis of NBS-encoding genes in
Cucurbitaceae and rosacea
To analyze the evolutionary relationships of NBS genes in
these relatives, three phylogenetic trees were constructed,
one cucurbitaceae-specific tree, one tree containing genes
from peach, mei and strawberry and an apple-pear tree
(Figures 2, Additional file 1: Figure S1, Additional file 2:
Figure S2, and Additional file 3: Figure S3). TIR NBS
genes and non-TIR NBS genes were clearly separated in
all of the three trees. To survey how many NBS genes
were produced after each species splitting, the speciesspecific clades were defined if the gene number of speciesspecific genes are larger than 2, the minimum nucleotide
similarity >80% and the bootstrap value >50%. These defined clades indicated the genes experienced recent expansion in each species.
No cucumber-specific clade was detected in cucurbitaceaespecific tree (Figure 2 and Additional file 1: Figure S1).
Except for several clades that contained exactly two cucumber genes each, cucumber genes always clustered with
melon genes. Two watermelon-specific clades, each containing three genes, were found and all the three copies
were very similar (nucleotide similarity >95%), suggesting
that genes in the two clades expanded recently. One large
melon-specific clade was found to have eight members,
which was the largest species-specific clade in the cucurbitaceae tree. Only 0–13.0% of all the NBS genes in cucurbitaceae were supposed to expand recently, which states
that there have been very few duplications of NBS genes
Table 5 Analysis of multi-species gene families in Rosaceae
Type of
gene family
Average number of members
A
M
Pc
Pr
S
C
Number
of gene
family
Number
of genes
Members
of largest
family
Average
nucleotide
divergence
Ave_Ka/Ks
PAML
(* + **|All)
APc
1
-
1
-
-
-
1
2
2
0.341
0.463
-
APcPr
2
-
1
1
-
-
1
4
4
0.169
0.660
1|1
AMPcPr
17.8
5.6
5.3
9.2
-
-
28
1060
189
0.251
0.525
14|18
AMPcPrS
11.1
5.9
6.3
6.1
3
-
14
453
119
0.269
0.396
7|10
APcPrS
1
-
1
1
1
-
1
4
4
0.157
0.216
0|1
AMPc
1.5
1
1
-
-
-
2
7
4
0.197
0.481
1|2
APr
8.1
-
-
3.5
-
-
37
427
131
0.150
0.649
20|26
AMPr
1.7
1.3
-
1.7
-
-
3
14
6
0.167
0.374
1|3
APrS
49
-
-
45
5
-
1
99
99
0.534
0.577
-
PcPr
-
-
1
1
-
-
1
2
2
0.238
0.534
-
MPcPr
-
5
3.5
1
-
-
2
19
12
0.310
0.529
1|2
MPc
-
2.4
2.5
-
-
-
48
235
36
0.109
0.637
19|20
MPcS
-
2
1.7
-
1
-
3
14
6
0.234
0.499
1|3
MPr
-
1
-
1
-
-
1
2
2
0.228
0.374
-
AMPcPrSC
1
1
1
1
1
1
1
6
6
0.207
0.091
0|1
MPcSC
-
1
1
-
1
1
1
4
4
0.225
0.199
0|1
A: Apple; M: Mei; Pc: Peach; Pr: Pear; S: Strawberry; C: Cannabis.
*P < 0.01; **P <0.05.
Jia et al. BMC Genetics (2015) 16:48
after speciation of cucumber, melon and watermelon. Another 13 clades of single-copy alleles retained gene order
in three-way genome comparisons were defined. All the
cucumber genes in these clades were found to be closer to
melons genes. This was consistent with the genetic relationship among these three species. Outside of these 13
clades, others were present in only one or two genomes,
showing presence and absence polymorphism among different species. This low number of species-specific clades
in cucurbitaceae tree demonstrated that the three species
split not long ago.
At the bottom of the cucurbitaceae tree (Figure 2),
more than 10 melon NBS genes, including TIR and nonTIR genes, with long branch were found. This and the
phenomena that no genes were very similar between cucumber and watermelon, these results indicated that the
melon genes were relative ancient and retained from
ancestors but lost in cucumber and watermelon. For the
phylogenetic tree of peach, mei and strawberry, 8 peachspecific, 15 mei-specific and 26 strawberry-specific clades
were defined (Additional file 2: Figure S2). The average
member of genes in the three types of clades was 3.4,
3.1, and 4.8. The two largest clades both contained
strawberry-specific genes. One had 12 members and the
other had 13 genes. Strawberry had more new produced
NBS genes. Although strawberry had the lowest number
of NBS genes of any of the least in the three genomes,
there were many other large strawberry-specific gene
clades that showed considerable higher nucleotide divergence. The species-specific gene clades found in applepear tree were much more numerous (Additional file 3:
Figure S3). Here, 84 apple-specific clades and 30 pearspecific clades were identified, including 330 (25.3%) and
113 (18.3%) genes, respectively. There were more applespecific clades but they had lower bootstrap values due to
the large number of sequences. Apple contained more
than twice as many NBS genes as pear. This very strongly
indicated that after the split of apple and pear, apple experienced a large gene duplication event.
Discussion
Small numbers of NBS-encoding genes in Cucurbitaceae
Compared with other reported reports, the numbers of
cucurbitaceous NBS-encoding genes are relatively small
[21]. In the current study, the three cucurbitaceous genomes, cucumber, melon and watermelon only harbor
45-80 NBS-encoding genes (0.19–0.27% of total genes).
All the sequenced plant genomes except Carica papaya
were found to contain more than 100 NBS-encoding
genes [11]. The average percentage of NBS genes among
all the genes in surveyed plant genomes ranged from
0.6% to 1.8% [16]. Compared the genome size and the
whole genome gene number of the cucurbitaceous species with the other plants, the cucurbitaceous species
Page 8 of 12
did not stand out in either genome size or number of
genes in the genome. Their lack of NBS-encoding genes
is most possibly due to the loss of NBS-encoding genes
after their split from other species.
To Cucurbitaceae, grape is an outer group species and
Rosaceae is a parallel group, whereas all these plants have
many more NBS-encoding genes (>300) than Cucurbitaceae. The Cucurbitaceae species are annual herbaceous
plants, having short generation time. Herbaceous species
are often regarded as faster evolving than woody species.
Compared with wood perennial plants, short life history
might benefit these annual plants to catch the evolutionary rates of pathogens [37,39,40]. Unlike the perennial
species, for instance, the Rosaceae species, few recent gene
duplications of R genes are found in Cucurbitaceae. This
indicates that few duplication events of NBS genes have
happened after speciation of cucumber, melon and watermelon. Whole-genome sequences of cucumber, melon
and watermelon revealed that the three genomes are absence of recent whole-genome duplications [29-31]. These
duplications are very common in angiosperms and this
process provides raw materials for gene genesis. However,
the evolutionarily important recent and recurrent wholegenome duplication is absent in the three Cucurbitaceae
species. Due to a mass of loss and little duplication of
NBS genes, the Cucurbitaceae have very low copy numbers of NBS-encoding genes. It is reported that there is
fitness cost of resistance gene [41]. High copy numbers of
resistance genes might be not benefit for plants in absence
of corresponding pathogens. As a cost, the plants might
grow slowly, have low seed productions or taste not good
enough. Cucumber, melon and watermelon are all economically important crops and products of human selection.
In order to cater to human needs, these cucurbitaceous
plants are reserved as what they now look like.
Actually, cucumber, melon and watermelon suffer
from a range of fungal and viral diseases, such as downy
mildew, angular leaf spot, bacterial wilt, and anthracnose. The Cucurbitaceae may have other specific defense
mechanisms beyond NBS-encoding genes. One possible
mechanism is the lipoxygenase (LOX) genes. The LOX
gene family creates the oxidized fatty acid catalyzer and
is considered involved in plant defense and pest resistance [42]. Usually, plant LOXs provide front-line
defense against pathogens in plant immunity. Recent
studies have shown that the LOX gene family in rice
plays an important role in blast pathogen infection [43].
It is reported that the LOX gene family has been notably
expanded in the cucumber and watermelon genomes
[30,31]. This indicates that the expanded LOX gene family may be a complementary or candidate mechanism by
which plants to deal with pathogens. However, expansion of the LOX gene family in the melon genome has
not been found [29]. The number of NBS genes in
Jia et al. BMC Genetics (2015) 16:48
melon is larger than in cucumber and watermelon. It is
not necessary for melon to produce large number of
LOX genes as cucumber and watermelon.
The LOX gene family cannot completely replace
NBS-encoding genes with respect to disease resistance.
Rice, grapevine, poplar and many other plants also have
some LOX genes [30], but they still have more than
400 NBS-encoding genes. The reason for the deficient
NBS-encoding genes in cucurbitaceous plants needs
further study.
Expansion of NBS-encoding genes in the apple genome
Although Rosaceae has a worldwide range and is thriving, it is subject to many various pathogens, such as the
bacterial disease fire blight, and the fungal diseases, rust
and powdery mildew. Genome-wide analysis of R genes
in Rosaceae revealed that the rose family contained a
relatively large number of R genes. Meanwhile, the number of genes and the proportions of R genes in the five
surveyed Rosaceae species were not totally identical.
According to the species relationships of the five species, peach and mei are similar to each other, pear and
apple are more closer and strawberry is relatively more
distant to them. Peach and mei have numbers of genes
and similar proportions of NBS genes. There are 48
peach-mei lineage gene families, containing 235 genes.
It is obvious that these two species have the identical
evolutionary patterns in R genes after they split from
common ancestor. Among the five species, strawberry is
the most different from the others. This is because it is
a woodland and herbaceous species with a short generation time while the others are tree species. Strawberry
has the fewest R genes of any Rosaceae species, which
might owe to the specific characters of strawberry
plants, especially the short generation time. Strawberry
might rely on their rapid breeding and reproduction to
escape from the invading of pathogens. The strawberry
genome is the only plant genome sequenced to date
with that shows no evidence of whole genome duplication, which is found in all other rosid genomes. This
might be the direct reason for the small number of the
strawberry genome.
A recent whole genome duplication (WGD) event was
shared by apple and pear, but peach, mei and strawberry
has not undergone recent WGD (Figure 1). It is therefore not strange that the genomes and number of genes
of apple and pear are much larger than those of the
three relatives. The R gene numbers found in pear and
apple are also larger than the other three species. However, the number of R genes found in pear is much lower
(2 fold lower) than that of the closely related apple
genome. Even though the sequenced genome of apple is
larger than that of other plants within the Rosaceae, the
relative number of NBS-encoding gene is still highest
Page 9 of 12
(2%), which is the largest proportion reported so far in
any plant, except bread wheat [44].
Based on the phylogenetic tree of pear and apple,
large number of apple-specific clades was found. And
the results of classification of gene families show high
number of apple-specific gene families while for applepear lineage gene families, the average numbers of gene
in apple was 2.3 times higher than that of pear. It can
reasonably be inferred that many NBS-encoding genes
in the apple genome might be produced after apple-pear
differentiation. It has been reported that the WGD
events and tandem duplications are responsible for the
high number of NBS genes in the apple genome [8,10].
These and the present results suggest that recent WGD
might contribute to the expansion of R genes in the
common ancestor of apple and pear, resulting in more R
genes in Maloideae. After the split between apple and
pear, more small-scale duplications have taken place in
the apple genomes, leading to a great increase in the
number of R genes. It is not clear why so many more R
genes were retained in apple because pear and apple are
close cousins species and they might have diverged from
each other 5.4–21.5 million years ago (MYA). Pear has a
cultivation history of 3000 years and domesticated apple
appeared around 4000 years ago. Their habitats are also
similar. The retention of so many R genes in apple
might be the result of selection during domestication.
Apple might encounter more diseases than pear, such as
some rust. These R genes might be kept as a library to
cope with uncertain and unknown pathogens. The real
reason for the huge number of R genes in apple requires
more materials and evidence.
Conclusion
This study provides a genomic framework for the identification of NBS-encoding genes in Rosaceae and Cucurbitaceae through comparative genomics. Considerable
differences in the copy number of NBS-encoding genes
were observed between Cucurbitaceae and Rosaceae species. In Rosaceae species, a large number and a high proportion of NBS-encoding genes were observed in peach
(437, 1.52%), mei (475, 1.51%), strawberry (346, 1.05%)
and pear (617, 1.44%), and apple (1303, 2.05%). The
number of apple NBS genes might be the largest number
in all of the reported diploid plants. However, only 45-80
NBS-encoding genes (0.19–0.27%) were identified in
Cucurbitaceae. Comprehensive analysis of NBS-encoding
genes, including phylogenetic analyses, calculation of
nucleotide divergence and estimation of selection forces,
indicates that NBS-encoding genes in Rosaceae crops,
especially in apple, have undergone extreme expansion
and rapid adaptive evolution. This research could contribute to a better understanding of the evolutionary history
of NBS-encoding genes in Rosaceae.
Jia et al. BMC Genetics (2015) 16:48
Methods
Sequence retrieval and identification of NBS-encoding
genes
Nine whole-genome sequenced plants were used in
the present study, including three Cucurbitaceae, cucumber (Cucumis sativus, />index.cgi, .
doe.gov/pz/portal.html#!info?alias=Org_Csativus), melon
(Cucumis melo, and
watermelon (Citrullus lanatus, />ICuGI/index.cgi); five Rosaceae, peach (Prunus persica,
mei (Prunus
mume, strawberry
(Fragaria vesca, />phytozome/v9.0/Fvesca/), pear (Pyrus bretschneideri
Rehd, ), and apple (Malus
domestica, />v9.0/Mdomestica/. Cannabis (Cannabis sativa, http://
www.ncbi.nlm.nih.gov/nuccore/JP449145) served as an
outgroup.
A three-step process was used to identify the greatest
possible number of candidate NBS-encoding genes in the
surveyed species. First, the predicted protein sequences in
the given annotation data were used. All the candidate
genes that presented NB-ARC domains (Pfam: PF00931)
from Pfam results (E value cut-off of 10-4) were selected
and considered as candidate NBS-encoding genes. Second,
to find NBS genes that might be ignored in the intergenic
regions, the amino acid sequence of the NB-ARC domain
was used as a query to BLASTp against the genome sequences. All BLAST hits, together with flanking regions of
5000 base pairs on both sides, were annotated using the
gene-finding programs FGENESH with the training set
of the closest species ( To
exclude potentially redundant candidate NBS-encoding
genes, all candidate NBS genes were orientated by
BLASTn, and sequences located in the same location were
eliminated. Last, all non-redundant NBS-encoding genes
were surveyed to further confirm whether they encoded
NBS or LRR motifs using the Pfam database v23.0
( SMART protein motif analyses
( CC motifs were detected using COILS program with a threshold of 0.9 in the
first 200 amino acids ( />COILS_form.html).
Alignment and analysis of gene families
To facilitate calculation of genetic parameters and identify the different characteristics of various genes, all
NBS-encoding genes were classified into families based
on the sequence similarity >60% and coverage >60%.
Multiple alignments of amino acid sequences were
performed using ClustalW with default options. The
resulting alignments were then used to guide the
Page 10 of 12
alignment of nucleotide coding sequences using MEGA
6.0 [45].
For each gene family, the average nucleotide diversity or
divergence (π or Dxy) was estimated with the Jukes and
Cantor correction using DnaSP v5.0. The number of nonsynonymous substitutions per nonsynonymous site is here
denoted by Ka while the number of synonymous substitution per synonymous site is denoted by Ks. The ratio of
nonsynonymous to synonymous nucleotide substitutions
(Ka/Ks) among paralogs were evaluated using MEGA 6.0
based on the Nei-Gojobori method with Jukes–Cantor
correction. Diversifying selection or positive selection was
investigated using PAML [46,47]. Models M7 and M8 in
program ‘codeml’ of PAML were run for all gene families
with more than two members. Positive selection was confirmed using a likelihood-ratio test by comparing the likelihood calculated using models M8 and M7.
Determining tandem duplication genes and segmental
duplication genes
Tandem duplicated NBS-encoding genes are defined as
those closely related genes in the same family falling with
50 kb or 100 kb of one another. To investigate the segmental duplication events containing NBS-encoding genes,
all NBS-encoding genes in a gene family were oriented on
the chromosomes or scaffolds by using BLASTn. Thirty
genes on the same chromosomes or scaffolds, including
the NBS-encoding gene and 15 flanking genes on each
side, were then compared by pairwise BLAST analysis to
identify duplicated genes between two independent segmental blocks. If more than five gene pairs with syntenic
relationships (BLAST E-value < 10-10) were detected, the
two blocks were defined as segmentally duplicated regions.
Phylogenetic analysis of NBS-encoding genes
Generally, for NBS-encoding genes, the regions that follow the NBS, such as LRR regions, have high variability
and not included for phylogenetic construction. For this
reason, only the NBS regions were used to build phylogenetic tree. All proteins of NBS-encoding genes were
trimmed to extract the NBS domain sequences according to Pfam results. Then, multiple alignments of these
amino acid sequences were performed using ClustalW
with a default option. The aligned amino acid sequences
were transferred to nucleotide sequences again and used
to construct a phylogenetic tree using MEGA 6.0,
based on neighbor-joining (NJ) method. A Kimura twoparameter model and the internal node stability were
explored with 1000 replicates.
Availability of supporting data
The phylogenetic data has been deposited in TreeBase
( />
Jia et al. BMC Genetics (2015) 16:48
Page 11 of 12
Additional files
Additional files 1: Figure S1. Phylogenetic tree based on NBS domain
of NBS-encoding genes in cucumber, melon and watermelon.
13.
Additional files 2: Figure S2. Phylogenetic tree based on NBS domain
of NBS-encoding genes in peach, mei and strawberry. Red lines represent
TIR genes and black lines represent non-TIR genes. NBS-encoding genes
in peach, mei and strawberry are shown as pink circles, purple circles,
and dark green circles, respectively. The vertical bars with different colors
beside the tree are used to represent species-specific gene clades of
three different species.
14.
Additional files 3: Figure S3. Phylogenetic tree based on NBS domain
of NBS-encoding genes in apple and pear. Red lines represent TIR genes
and black lines represent non-TIR genes. Apple NBS genes are shown as
red circles and pear NBS genes are shown as green circles. The red
brackets and green brackets respectively indicate the apple-specific gene
clades and pear-specific gene clades.
16.
Additional files 4: Table S1. Exon statistics in TIR and non-TIR
NBS-encoding genes.
18.
Competing interests
The authors declare that they have no competing interests.
Authors’ contributions
SY and XZ designed the study. YJ, YY and YZ contributed extensively to the
bioinformatic analyses. YY, SY and XZ wrote the manuscript. SY, YJ and XZ
prepared and revised the manuscript. All authors read and approved the
final manuscript.
Acknowledgements
This work was supported by National Natural Science Foundation of China
(91331205, J1103512 and J1210026), NSFC of Jiangsu province (BK2011015),
Program for Changjiang Scholars and Innovative Research Team in University
(IRT_14R27).
15.
17.
19.
20.
21.
22.
23.
24.
Received: 6 April 2015 Accepted: 24 April 2015
25.
References
1. Jones JD, Dangl JL. The plant immune system. Nature. 2006;444(7117):323–9.
2. Mcdowell JM, Simon SA. Recent insights into R gene evolution. Mol Plant
Pathol. 2006;7(5):437–48.
3. Bent AF, Mackey D. Elicitors, effectors, and R genes: The new paradigm and
a lifetime supply of questions. Annu Rev Phytopathol. 2007;45:399–436.
4. Flor HH. Current Status of Gene-for-Gene Concept. Annu Rev Phytopathol.
1971;9:275. +.
5. McHale L, Tan X, Koehl P, Michelmore RW. Plant NBS-LRR proteins:
adaptable guards. Genome Biol. 2006;7(4):212.
6. Dangl JL, Jones JD. Plant pathogens and integrated defence responses to
infection. Nature. 2001;411(6839):826–33.
7. Meyers BC, Dickerman AW, Michelmore RW, Sivaramakrishnan S, Sobral BW,
Young ND. Plant disease resistance genes encode members of an ancient
and diverse protein family within the nucleotide-binding superfamily.
Plant J. 1999;20(3):317–32.
8. Arya P, Kumar G, Acharya V, Singh AK: Genome-Wide Identification and
Expression Analysis of NBS-Encoding Genes in Malus x domestica and
Expansion of NBS Genes Family in Rosaceae. Plos One. 2014;9(9):e107987.
9. Meyers BC, Kozik A, Griego A, Kuang H, Michelmore RW. Genome-wide
analysis of NBS-LRR-encoding genes in Arabidopsis. Plant Cell.
2003;15(4):809–34.
10. Perazzolli M, Malacarne G, Baldo A, Righetti L, Bailey A, Fontana P, Velasco R,
Malnoy M: Characterization of Resistance Gene Analogues (RGAs) in Apple
(Malus x domestica Borkh.) and Their Evolutionary History of the Rosaceae
Family. Plos One. 2014;9(2):e86844.
11. Porter BW, Paidi M, Ming R, Alam M, Nishijima WT, Zhu YJ. Genome-wide
analysis of Carica papaya reveals a small NBS resistance gene family.
Mol Genet Genomics. 2009;281(6):609–26.
12. Shao ZQ, Zhang YM, Hang YY, Xue JY, Zhou GC, Wu P, et al. Long-Term
Evolution of Nucleotide-Binding Site-Leucine-Rich Repeat Genes:
26.
27.
28.
29.
30.
31.
32.
33.
34.
35.
Understanding Gained from and beyond the Legume Family. Plant Physiol.
2014;166(1):217–34.
Tan S, Wu S. Genome Wide Analysis of Nucleotide-Binding Site Disease
Resistance Genes in Brachypodium distachyon. Comp Funct Genomic.
2012;2012:418208.
Yang S, Feng Z, Zhang X, Jiang K, Jin X, Hang Y, et al. Genome-wide
investigation on the genetic variations of rice disease resistance genes.
Plant Mol Biol. 2006;62(1-2):181–93.
Jupe F, Pritchard L, Etherington GJ, MacKenzie K, Cock PJA, Wright F,
Sharma SK, Bolser D, Bryan GJ, Jones JDG et al: Identification and
localisation of the NB-LRR gene family within the potato genome.
BMC genomics. 2012;13:75.
Lozano R, Ponce O, Ramirez M, Mostajo N, Orjeda G. Genome-wide
identification and mapping of NBS-encoding resistance genes in Solanum
tuberosum group phureja. PLoS One. 2012;7(4), e34775.
Zhang X, Feng Y, Cheng H, Tian D, Yang S, Chen JQ. Relative evolutionary
rates of NBS-encoding genes revealed by soybean segmental duplication.
Mol Genet Genomics. 2011;285(1):79–90.
Mun JH, Yu HJ, Park S, Park BS. Genome-wide identification of NBS-encoding
resistance genes in Brassica rapa. Mol Genet Genomics. 2009;282(6):617–31.
Li J, Ding J, Zhang W, Zhang Y, Tang P, Chen JQ, et al. Unique evolutionary
pattern of numbers of gramineous NBS-LRR genes. Mol Genet Genomics.
2010;283(5):427–38.
Luo S, Zhang Y, Hu Q, Chen J, Li K, Lu C, et al. Dynamic nucleotide-binding
site and leucine-rich repeat-encoding genes in the grass family. Plant
Physiol. 2012;159(1):197–210.
Lin X, Zhang Y, Kuang H, Chen J. Frequent loss of lineages and deficient
duplications accounted for low copy number of disease resistance genes in
Cucurbitaceae. BMC Genomics. 2013;14:335.
Lee SY, Lee DH. Expression of MbR4, a TIR-NBS type of apple R gene,
confers resistance to bacterial spot disease in Arabidopsis. J Plant Biol.
2005;48(2):220–8.
Bai SSX, Zhang Y, Dai H. Identification of Three Apple NBS Genes and Their
Expression Responding to Exogenous Phytohormones. Plant Physiol J.
2014;50(2):178–84.
Velasco R, Zharkikh A, Affourtit J, Dhingra A, Cestaro A, Kalyanaraman A,
et al. The genome of the domesticated apple (Malus x domestica Borkh.).
Nat Genet. 2010;42(10):833–9.
Verde I, Abbott AG, Scalabrin S, Jung S, Shu SQ, Marroni F, et al. The
high-quality draft genome of peach (Prunus persica) identifies unique
patterns of genetic diversity, domestication and genome evolution.
Nat Genet. 2013;45(5):487–U447.
Wu J, Wang ZW, Shi ZB, Zhang S, Ming R, Zhu SL, et al. The genome of the
pear (Pyrus bretschneideri Rehd.). Genome Res. 2013;23(2):396–408.
Zhang QX, Chen WB, Sun LD, Zhao FY, Huang BQ, Yang WR, Tao Y,
Wang J, Yuan ZQ, Fan GY et al: The genome of Prunus mume.
Nat Commun. 2012;3:1318.
Shulaev V, Sargent DJ, Crowhurst RN, Mockler TC, Folkerts O, Delcher AL,
et al. The genome of woodland strawberry (Fragaria vesca). Nat Genet.
2011;43(2):109–16.
Garcia-Mas J, Benjak A, Sanseverino W, Bourgeois M, Mir G, Gonzalez VM,
et al. The genome of melon (Cucumis melo L.). Proc Natl Acad Sci U S A.
2012;109(29):11872–7.
Huang S, Li R, Zhang Z, Li L, Gu X, Fan W, et al. The genome of the
cucumber, Cucumis sativus L. Nat Genet. 2009;41(12):1275–81.
Guo S, Zhang J, Sun H, Salse J, Lucas WJ, Zhang H, et al. The draft genome
of watermelon (Citrullus lanatus) and resequencing of 20 diverse accessions.
Nat Genet. 2013;45(1):51–8.
Woycicki R, Witkowicz J, Gawronski P, Dabrowska J, Lomsadze A, Pawelkowicz M,
et al. The genome sequence of the North-European cucumber (Cucumis sativus L.)
unravels evolutionary adaptation mechanisms in plants. PLoS One.
2011;6(7):e22728.
van Bakel H, Stout JM, Cote AG, Tallon CM, Sharpe AG, Hughes TR, Page JE:
The draft genome and transcriptome of Cannabis sativa. Genome Biology.
2011;12:R102.
Velasco R, Zharkikh A, Troggio M, Cartwright DA, Cestaro A, Pruss D, et al. A
high quality draft consensus sequence of the genome of a heterozygous
grapevine variety. PLoS One. 2007;2(12):e1326.
Kohler A, Rinaldi C, Duplessis S, Baucher M, Geelen D, Duchaussoy F, et al.
Genome-wide identification of NBS resistance genes in Populus trichocarpa.
Plant Mol Biol. 2008;66(6):619–36.
Jia et al. BMC Genetics (2015) 16:48
Page 12 of 12
36. Schmutz J, Cannon SB, Schlueter J, Ma J, Mitros T, Nelson W, et al. Genome
sequence of the palaeopolyploid soybean. Nature. 2010;463(7278):178–83.
37. Yang S, Zhang X, Yue JX, Tian D, Chen JQ. Recent duplications dominate
NBS-encoding gene expansion in two woody species. Mol Genet Genomics.
2008;280(3):187–98.
38. Leister D. Tandem and segmental gene duplication and recombination
in the evolution of plant disease resistance genes. Trends Genet.
2004;20(3):116–22.
39. Terefe-Ayana D, Kaufmann H, Linde M, Debener T: Evolution of the Rdr1
TNL-cluster in roses and other Rosaceous species. BMC genomics.
2012;13:409.
40. Germain H, Seguin A. Innate immunity: has poplar made its BED? New
Phytol. 2011;189(3):678–87.
41. Tian D, Traw MB, Chen JQ, Kreitman M, Bergelson J. Fitness costs of R-genemediated resistance in Arabidopsis thaliana. Nature. 2003;423(6935):74–7.
42. Schwab W, Davidovich-Rikanati R, Lewinsohn E. Biosynthesis of plantderived flavor compounds. Plant J. 2008;54(4):712–32.
43. Marla SS, Singh VK. LOX genes in blast fungus (Magnaporthe grisea)
resistance in rice. Funct Integr Genomics. 2012;12(2):265–75.
44. Gu L, Si W, Zhao L, Yang S, Zhang X: Dynamic evolution of NBS-LRR genes
in bread wheat and its progenitors. Mol Genet Genomics.
2015;290(2):727–738.
45. Tamura K, Stecher G, Peterson D, Filipski A, Kumar S. MEGA6: Molecular
Evolutionary Genetics Analysis Version 6.0. Mol Biol Evol. 2013;30(12):2725–9.
46. Yang ZH, Nielsen R, Goldman N, Pedersen AMK. Codon-substitution models
for heterogeneous selection pressure at amino acid sites. Genetics.
2000;155(1):431–49.
47. Yang ZH. PAML: a program package for phylogenetic analysis by maximum
likelihood. Comput Appl Biosci. 1997;13(5):555–6.
Submit your next manuscript to BioMed Central
and take full advantage of:
• Convenient online submission
• Thorough peer review
• No space constraints or color figure charges
• Immediate publication on acceptance
• Inclusion in PubMed, CAS, Scopus and Google Scholar
• Research which is freely available for redistribution
Submit your manuscript at
www.biomedcentral.com/submit