Genetic diversity and genetic structure of the Siberian roe deer (Capreolus pygargus) populations from Asia
Bạn đang xem bản rút gọn của tài liệu. Xem và tải ngay bản đầy đủ của tài liệu tại đây (2.42 MB, 15 trang )
Lee et al. BMC Genetics (2015) 16:100
DOI 10.1186/s12863-015-0244-6
RESEARCH ARTICLE
Open Access
Genetic diversity and genetic structure of
the Siberian roe deer (Capreolus pygargus)
populations from Asia
Yun Sun Lee1, Nickolay Markov2, Inna Voloshina3, Alexander Argunov4, Damdingiin Bayarlkhagva5, Jang Geun Oh6,
Yong-Su Park7, Mi-Sook Min1, Hang Lee1* and Kyung Seok Kim1,8*
Abstract
Background: The roe deer, Capreolus sp., is one of the most widespread meso-mammals of Palearctic distribution,
and includes two species, the European roe deer, C. capreolus inhabiting mainly Europe, and the Siberian roe deer,
C. pygargus, distributed throughout continental Asia. Although there are a number of genetic studies concerning
European roe deer, the Siberian roe deer has been studied less, and none of these studies use microsatellite
markers. Natural processes have led to genetic structuring in wild populations. To understand how these factors
have affected genetic structure and connectivity of Siberian roe deer, we investigated variability at 12 microsatellite
loci for Siberian roe deer from ten localities in Asia.
Results: Moderate levels of genetic diversity (HE = 0.522 to 0.628) were found in all populations except in Jeju
Island, South Korea, where the diversity was lowest (HE = 0.386). Western populations showed relatively low genetic
diversity and higher degrees of genetic differentiation compared with eastern populations (mean Ar = 3.54 (east),
2.81 (west), mean FST = 0.122). Bayesian-based clustering analysis revealed the existence of three genetically distinct
groups (clusters) for Siberian roe deer, which comprise of the Southeastern group (Mainland Korea, Russian Far East,
Trans-Baikal region and Northern part of Mongolia), Northwestern group (Western Siberia and Ural in Russia) and
Jeju Island population. Genetic analyses including AMOVA (FRT = 0.200), Barrier and PCA also supported genetic
differentiation among regions separated primarily by major mountain ridges, suggesting that mountains played a
role in the genetic differentiation of Siberian roe deer. On the other hand, genetic evidence also suggests an
ongoing migration that may facilitate genetic admixture at the border areas between two groups.
Conclusions: Our results reveal an apparent pattern of genetic differentiation among populations inhabiting Asia,
showing moderate levels of genetic diversity with an east-west gradient. The results suggest at least three distinct
management units of roe deer in continental Asia, although genetic admixture is evident in some border areas. The
insights obtained from this study shed light on management of Siberian roe deer in Asia and may be applied in
conservation of local populations of Siberian roe deer.
Keywords: Microsatellite, Gene flow, Genetic diversity, Genetic structure, Siberian roe deer, Capreolus pygargus
* Correspondence: ;
1
Conservation Genome Resource Bank for Korean Wildlife, College of
Veterinary Medicine, Seoul National University, Gwanak-gu, Seoul 151-742,
Republic of Korea
Full list of author information is available at the end of the article
© 2015 Lee et al. Open Access This article is distributed under the terms of the Creative Commons Attribution 4.0
International License ( which permits unrestricted use, distribution, and
reproduction in any medium, provided you give appropriate credit to the original author(s) and the source, provide a
link to the Creative Commons license, and indicate if changes were made. The Creative Commons Public Domain
Dedication waiver ( applies to the data made available in this
article, unless otherwise stated.
Lee et al. BMC Genetics (2015) 16:100
Background
The family Cervidae is widely distributed throughout
Eurasia and includes 40 species of deer [1]. The roe deer
(Capreolus Gray, 1821) is one of the most widespread
meso-mammals in Cervidae and includes two species,
the smaller European roe deer (C. capreolus Linnaeus,
1758) and the larger Siberian roe deer (C. pygargus
Pallas, 1771). The two species of deer are distinguished
mainly by differences in morphology and karyotype. The
Siberian roe deer is distributed in the Palaearctic
throughout continental Asia [2] and some parts of Eastern Europe [3]. Although the classification of subspecies
is still controversial, it is widely accepted that the Siberian
roe deer comprises of at least three subspecies, C.
pygargus pygargus (from Volga river to Lake Baikal
and Northeastern Russia), C. pygargus tianschanicus
(or C. c. bedfordi Thomas, 1908) (Tianshan mountain,
Mongolia, Russian Far East and Korea) and C. pygargus
melanotis Miller, 1911 (Eastern Tibet, and Gansu and
Sichuan Province, China).
For mammal species such as Siberian roe deer, which
is distributed across extensive geographical range, contemporary level of genetic variation and population
structure may be shaped by interaction of both natural
and anthropogenic factors [4, 5]. Especially numerous
human activities, such as habitat destruction/fragmentation, hunting, and human-mediated translocation, have
influenced distribution, population structure, and genetic
diversity of natural wildlife during the last few centuries
[6-8]. Fossil records report that Siberian roe deer territory was once connected to the northern Caucasus [9].
However, population size drastically diminished supposedly because of overhunting in Western Siberia and
Northeastern Siberia during the 19th and 20th centuries
[10]. Regardless, the original historic distribution has almost completely recovered.
Population genetics and phylogeography of European
roe deer have been well studied [11–19]. Most studies
using mitochondrial and nuclear markers for European
roe deer revealed geographic pattern in the population
structure, with generally high levels of genetic variation.
The Siberian roe deer is relatively less studied and most
of the genetic studies of the species have been obtained
from phylogenetic inferences using mitochondrial DNA
sequence data. These studies using mtDNA demonstrated that Siberian roe deer can be divided into several
major clusters with geographic patterns; the cluster in
eastern Siberia and the western Siberia [20, 21]. In contrast, some phylogeographic studies have reported no
apparent geographic pattern of genetic variation among
the broadly sampled Siberian roe deer [19, 22].
Overall, population boundaries and the genetic structuring of the Siberian roe deer remain unclear and the
classification of C. pygargus subspecies is still under
Page 2 of 15
debate. Although phylogenetic studies using mtDNA sequences provided valuable information regarding the
genetic relationship and phylogeographic inferences of
the Siberian roe deer, studies on population genetics
using the fast-evolving nuclear makers, such as microsatellites, can provide additional information to better
understand the present status of genetic diversity and
population structure of geographic Siberian roe deer in
Asia.
In this study, we investigated microsatellite variability
for Siberian roe deer collected throughout Asia to examine the level of population genetic structure and the
amount of genetic variation of Siberian roe deer. These
data were applied to discuss how historical and demographic dynamics have affected the recent and past
population genetic structure of Siberian roe deer.
Results
Genetic variability of Siberian roe deer
Genetic characteristics of 12 microsatellite loci from
Siberian roe deer sampled at each location are shown in
Additional file 1: Table S1. Source information and characteristics of 12 microsatellite loci from other species are
shown in Additional file 1: Table S2. A total of 122 alleles
were detected for 189 individuals of ten Siberian roe deer
populations (Fig. 1); Jeju, South Korea (SKJ), Mainland
South Korea (SKM), Primorsky Krai, Russia (RPR),
Yakutia, Russia (RYA), surroundings of Sokhondinsky
Zapovednik (nature reservation), Russia (RSO), Northern
part of Mongolia (MGN), Altaisky Krai, Russia (RAL),
Novosibirskaya Oblast’, Russia (RNO), Sverdlovskaya
oblast’, Ural, Russia (RUL) and Kurganskaya Oblast’,
Russia (RKU).
The number of alleles per locus varied from 2 (BM25)
to 24 (MB757) with a mean of 10.17. Microsatellite loci
showed various levels of polymorphism, with the polymorphism information content (PIC) values ranging
from 0.062 (IDVGA29) to 0.926 (BM757). Most loci, except IDVGA29, showed moderate to high polymorphism. Private alleles were observed in most populations
except Mid-west Siberia (RAL and RNO), but all private
alleles were in very low frequency ranging from 0.011 to
0.106 (Table 1). Null alleles were present at more than
one locus for each population except Mid-west Siberia
(RAL and RNO), but there was no evidence of a large allele drop out (Table 1). Occurrence of null alleles at each
locus showed generally low frequency less than 0.10 for
most of populations. However, some loci showed various
range of null alleles for certain populations as follows;
0.10 for the locus RT30 (SKM), IDVGA29 (SKJ) and
BM757 (RYA), 0.30 for locus CSSM41 (SKJ, RPR and
RUL), MB25 (SKM, RPR and MGN), Roe09 (SKM, RYA,
and RUL), RT1 (SKM, RPR and RSO) and RT20 (SKJ,
RPR and RYA). The highest frequency of null allele
Lee et al. BMC Genetics (2015) 16:100
Page 3 of 15
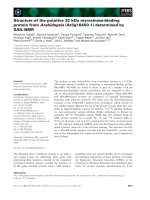
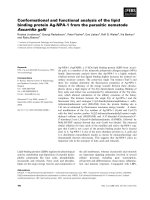
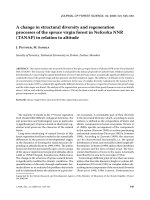
Fig. 1 Sampling location and subspecies range of Siberian roe deer, C. pygargus. Pie charts of membership proportions of each sampled
population inferred by structure analysis (K = 3). 1: Main Mountain ranges [2], 2: C.p.pygargus, 3: C.p.tianschanicus. SKJ: South Korea, Jeju (N = 33),
SKM: South Korea Mainland (N = 31), RPR: Russia, Primorsky Krai (N = 30), RYA: Russia, Yakutia (N = 18), RSO: Russia, Sokhondinsky (N = 9), MGN:
Mongolia, Northern part (N = 12), RAL: Russia, Altay (N = 5), RNO: Russia, Novosibirsk (N = 7), RUR: Russia, Ural (N = 23), RKU: Russia, Kurgan (N = 21).
Base image is created by Uwe Dedering and licensed under the Creative Commons Attribution-Share Alike 3.0 Unported license (CC BY-SA). Fig. 1
is reproduced in this study under the license. />
occurrence was found in the locus IDVGA8, with the
null allele frequency of 0.60 for SKM, RPR, RSO, MGN,
RKU, and RYA.
Measures of genetic diversity were generally high in
Primorsky Krai, Russia (RPR) (mean no. of alleles per
locus (MNA) = 7.42, Allelic richness (Ar) = 3.67, expected heterozygosity (HE) = 0.623) followed by Mainland Korea (SKM) and Northern Mongolia (MGN)
(Table 1). The lowest genetic diversity was found in Jeju
island, Korea (SKJ) (MNA = 3.75, Ar = 2.18, HE = 0.386),
followed by Mid-west Siberia (RAL and RNO) and West
Siberia (RUL and RKU). Wilcoxon Signed Rank test revealed that allelic richness and expected heterozygosity
were significantly higher in the East populations than in
the West populations for the most population pairs (one
tailed p < 0.05) (Additional file 1: Table S3, Figure S1).
All populations showed significant deviation of observed heterozygosity from heterozygosity expected
under Hardy-Weinberg equilibrium in the direction of
heterozygote deficiency except Novosibirsk, Russia
(RNO) (Table 1). Inbreeding coefficient (FIS) estimates
across all populations ranged from 0.031 to 0.247, and
five populations (SKJ, SKM, RPR, RYA and RSO) were
significantly deviated from zero (Table 1). Significant
deviation in Hardy-Weinberg equilibrium (HWE) and
FIS could be due to the possibility of Whalund effect,
inbreeding (due to non-random mating or subpopulations), and/or other anomaly such as the presence of
null alleles.
Genetic relationship and gene flow
ENA-corrected (excluding null alleles) and uncorrected
pairwise FST are shown in Table 2, where these two estimates did not show significant differences (Wilcoxon
Rank Sum Test; U = 987, P = 0.8401). Therefore, we used
uncorrected pairwise FST for further analyses and interpretation of genetic differentiation of Siberian roe deer
population. Pairwise FST values for 24 out of 44 population pairs are significantly different from 0 after corrections for multiple comparisons (P < 0.001) (Table 2). The
lowest value of genetic differentiation was detected in
SKM vs. MGN (FST = 0.025) and roe deer from Jeju Island, South Korea (SKJ), showed the highest degree of
genetic differentiation to all others (mean pairwise FST =
Lee et al. BMC Genetics (2015) 16:100
Page 4 of 15
Table 1 Genetic characteristics of Siberian roe deer in each region/location across 12 microsatellite loci
East
West
Region
N
MNA
Ar
HE
HO
FIS
a
HWE P b
Number of loci with null allele
NPA (Freq. rang)
SKJ
33
3.75
2.18
0.386
0.329
0.150*
0.000 (3)
3 (RT20, CSSM41, IDVGA29)
4 (0.016-0.106)
SKM
31
6.58
3.48
0.596
0.451
0.247*
0.000 (7)
5 (RT1, RT30, Roe09, MB25, IDVGA8)
3 (0.016-0.065)
RPR
30
7.42
3.67
0.623
0.490
0.217*
0.000 (7)
5 (RT1, RT20, MB25, CSSM41, IDVGA8)
4 (0.017-0.050)
RSMG
21
7.00
5.67
0.598
0.500
0.169*
0.000 (4)
4 (RT1, MB25, BM757, IDVGA8)
7 (0.024-0.025)
RSO
9
5.00
3.36
0.550
0.438
0.215*
0.000 (2)
2 (RT1, IDVGA8)
4 (0.056)
MGN
12
5.67
3.66
0.628
0.544
0.138 NS
0.000 (4)
2 (MB25, IDVGA8)
3 (0.042)
RYA
18
5.33
3.26
0.553
0.459
0.175*
0.000 (4)
4 (RT20, Roe09, BM757, IDVGA8)
5 (0.031-0.094)
NS
0.000 (2)
1 (IDVGA8)
0
0.003 (4)
-
c
c
RARN
12
3.92
3.87
0.560
0.503
0.107
RAL
5
2.92
2.81
0.541
0.471
0.144 NS
NS
-
RNO
7
3.33
2.91
0.539
0.524
0.031
0.988 (0)
-
RURK
44
4.92
3.73
0.534
0.495
0.075 NS
0.000 (7)
3 (Roe09, CSSM41, IDVGA8)
3 (0.011-0.012)
RKU
21
3.83
2.68
0.530
0.512
0.034 NS
0.000 (6)
2 (Roe09, IDVGA8)
1 (0.025)
NS
0.000 (5)
2 (Roe09, CSSM41)
2 (0.022-0.024)
0.000 (5)
-
-
RUL
23
4.42
2.82
0.522
0.478
0.085
Mean
27
5.56
3.68
0.550
0.461
0.163
-
Number of individual per population (N), Allelic diversity (MNA, mean no. of alleles per locus), allelic richness (Ar), expected heterozygosity (HE) at Hardy-Weinberg
equilibrium, observed heterozygosity (HO), inbreeding coefficient (FIS), and the probability (P) of being in Hardy-Weinberg equilibrium, null alleles, number of
private alleles (NPA)
a
For FIS within samples based on 2400 randomizations using the FSTAT program. NS: Not significant after adjusted nominal level (5 %) = 0.004
b
Probability values using the Fisher’s method implemented in the GENEPOP program. Number in parentheses indicates the no. of loci showing a significant
departure (P <0.05) from Hardy-Weinberg equilibrium
c
Not determined due to small sample size
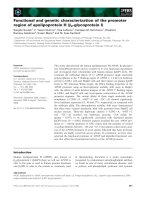
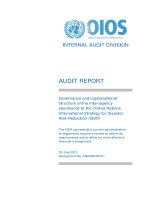
UPGMA trees based on Nei’s DA distances displayed
topologies with three clusters (Fig. 2). Relationship tree
displayed Mainland Korea, Eastern and Central Siberia
populations (SKM, RPR, RSO and MGN) clustered together with high bootstrap support (82 %). However, the
Jeju Island, South Korea (SKJ) population remains separated by long branches, possibly due to a founder effect.
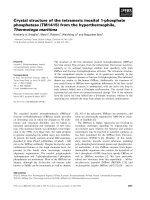
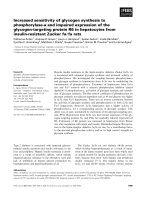
Principal coordinates analysis (PCA) for all populations
supported the result from the relationship tree, revealing
similar patterns among locations (Fig. 3a). PCA analysis
performed without island population (SKJ) showed three
0.349). When a comparison is made between two regions (West vs. Central and East), roe deer in Urals and
Kurgan, Russia (RUL and RKU) showed relatively higher
degrees of genetic differentiation with Mainland Korea
(SKM), Primorsky Krai, Russia (RPR) and Central Siberia
(RSO and MGN) (mean pairwise FST = 0.122). The effective number of migrants per generation (Nem) ranged
from 0.4 (SKJ vs. RYA, RSO, RAL, RNO, RUL and RKU)
to 103 (RPR vs. MGN) (Table 2). Roe deer in Jeju Island,
Korea (SKJ) showed negligible levels of gene flow relative
to all others.
Table 2 Pairwise FST and gene flow (Nem in parentheses) estimates between geographic populations
SKJ
SKM
SKJ
—
0.277 (0.7)
0.279 (0.7)
0.366 (0.4)
0.355 (0.5)
0.295 (0.6)
0.376 (0.4)
0.372 (0.4)
0.393 (0.4)
0.387 (0.4)
SKM
0.286*(0.6)
—
0.011 (23.1)
0.072 (3.3)
0.030 (8.2)
0.029 (8.3)
0.092 (2.5)
0.095 (2.4)
0.138 (1.6)
0.387 (2.0)
RPR
0.290*(0.6)
0.009NS(28.8)
—
0.046 (5.1)
0.007 (36.5)
0.011 (22.9)
0.065 (3.6)
0.081 (2.8)
0.115 (1.9)
0.095 (2.4)
RYA
0.373*(0.4)
0.068*(3.4)
0.044*(5.4)
—
0.038 (6.4)
0.056 (4.2)
0.054 (4.4)
0.045 (5.4)
0.054 (4.4)
0.055 (4.3)
RSO
0.366*(0.4)
0.020NS(12.1)
−0.005NS(inf)
0.041NS(5.8)
—
0.006 (42.4)
0.070 (3.3)
0.091 (2.5)
0.134 (1.6)
0.099 (2.3)
0.051NS(4.6)
0.000NS(inf)
—
0.087 (2.6)
0.076 (3.0)
0.127 (1.7)
0.106 (2.1)
MGN
RPR
MGN
RAL
RNO
RUL
RKU
0.002
0.076 (3.0)
0.055
NS
0.045 (5.3)
0.058 (4.1)
0.076 (3.0)
—
0.065 (3.6)
0.107 (2.1)
0.116 (1.9)
0.088*(2.6)
0.070*(3.3)
0.039NS(6.2)
0.091NS(2.5)
0.070*(3.3)
0.057NS(4.2)
—
0.042 (5.8)
0.048 (5.0)
0.143*(1.5)
0.115*(1.9)
0.050*(4.8)
0.141*(1.5)
0.128*(1.7)
0.101NS(2.2)
0.035NS(7.0)
—
0.033 (7.4)
0.045NS(5.3)
0.032NS(7.6)
—
0.025*(10.0)
RAL
0.386*(0.4)
NS
RNO
0.380*(0.4)
RUL
0.412*(0.4)
0.410*(0.4)
RSO
NS
0.299*(0.6)
RKU
RYA
0.124*(1.8)
(103)
(4.3)
0.101*(2.2)
NS
0.058*(4.1)
NS
0.111*(2.0)
NS
0.110*(2.0)
NS
0.123 (1.8)
FST estimates (Weir & Cockerham 1984) are below the diagonal and FST using the ENA correction are above the diagonal
Probability of being different than zero after corrections for multiple comparisons (*P < 0.001, NS: not significant)
Lee et al. BMC Genetics (2015) 16:100
Page 5 of 15
Fig. 2 Relationship tree of Siberian roe deer from ten geographic locations. UPGMA tree was constructed based on Nei’s DA genetic distance
Fig. 3 Scatter diagram of factor scores from a principal coordinate analysis of geographic locations. a: Analysis for all populations, b: Analysis after
excluding roe deer from Jeju Island. The percentage of total variation attributed to each axis is indicated
Lee et al. BMC Genetics (2015) 16:100
clusters consisting of 1: Central and East (SKM, RPR, RSO
and MGN), 2: West and Mid-west (RUL, RKU and RNO)
and 3: Mid-west and Northeast (RAL and RYA) (Fig. 3b).
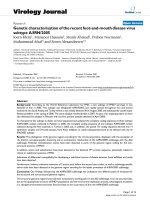
Genetic structure
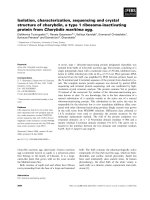
Bayesian model based clustering analysis identified three
genetic clusters under the hierarchical island model suggested by the Evanno et al. [23] (Fig. 4). Initially, the highest ΔK was observed when K was set to 2, dividing into
Jeju Island, South Korea (SKJ) and all other locations.
When Jeju Island, South Korea (SKJ), was excluded to detect sub-structuring in remaining cluster, two additional
genetic clusters were observed, which clearly discriminated
the population in Central and Eastern Siberia (SKM, RPR,
RSO and MGN) from those in the Urals region and West
Siberia, Russia (RUL, RKU and RNO) populations. Mountain Altay, Russia (RAL) and Yakutia, Russia (RYA) displayed intermediate genetic composition between the
Central/Eastern and Western population. Overall, structure analysis under the hierarchical island model revealed
three genetic clusters consisting of 1: Jeju Island, South
Korea (SKJ), 2: Central and East (SKM, RPR, RSO and
MGN; Southeastern group), and 3: West and Mid-west
(RUL, RKU and RNO; Northwestern group) with admixed
genetic compositions between the clusters 2 and 3 for
Mid-west (RAL) and Northeastern (RYA) population. A
pie chart represented for each sampling location on the
map, apart from roe deer from Jeju Island, South Korea
(SKJ), displayed two different genetic compositions with an
admixed population observed in border areas (Fig. 1).
Hierarchical analysis of molecular variance (AMOVA)
analysis based on the geographical distance showed significant genetic differentiation (FRT = 0.148) among regions, which was much higher than among population
within regions (FSR = 0.040) (Table 3A). Result based on
the three clusters after two admixed regions (RYA and
RAL) excluded presented greater difference in genetic
differentiation among regions (FRT = 0.200) (Table 3B),
supporting the obvious genetic differentiation among
three clusters; Jeju Island, Korea (SKJ), Eastern region
(SKM, RPR, MGN and RSO) and Western region (RNO,
RUL and RKU). In addition, AMOVA analysis based on
Page 6 of 15
the two clusters after Jeju and two admixed regions
(RYA and RAL) excluded showed genetic differentiation
among regions (FRT = 0.093) and among population
within regions (FSR = 0.020) (Table 3C).
The Barrier analysis based on the pairwise FST verified three areas of relatively sharp change in genetic
composition (Fig. 5). The first barrier separated the
Eastern region (SKM, RPR, MGN and RSO) from West
and Mid-west region (RAL, RNO, RUL and RKU) with
supported by six to eleven loci. The second barrier
separated Northeastern population (RYA) from all
other populations with supported by three to eleven
loci. The third barrier, supported by two to eleven loci,
separated Mid-west population (RAL) from Western
region (RNO, RUL and RKU).
Regression of the genetic isolation by geographic distance (IBD) over all samples showed significant correlation in both with and without Jeju Island included
(Fig. 6). However, relationship between genetic and
geographic distances was increased as high as 3.5 fold
when Jeju Island, Korea (SKJ), was removed, indicating
that the distinct genetic differentiation of SKJ from
other populations greatly decreased the IBD relationship. Also, IBD with marked pair of each population
based on the two clusters (structure) showed slightly
deviated point from standard linear which typically distributed on the low (pair of population within cluster)
and high (pair of population between clusters) genetic
distance (Fig. 6b).
To provide insights into the main causes of these
three regions (SKJ, Eastern region and Western region)
differentiation, statistical comparing pRST, FST and RST
values (drift vs mutation) were performed. pRST values
were very similar to FST and permutation tests did not
detect RST value significantly higher (p < 0.05) than
pRST except one locus RT30 (Additional file 1: Table
S4). This suggests that differentiation is caused mainly
by drift. This result also ascertains the restricted level
of gene flow between populations separated by the high
mountain ridges and implies that FST should be a better
estimator than RST of population differentiation for
Siberian roe deer.
Fig. 4 Bar plots for population structure estimates of Siberian roe deer. Population symbol on the x-axis indicates the putative population of
sample origin. See Fig. 1 for location abbreviation. Each color denotes a cluster from STRUCTURE analysis
Lee et al. BMC Genetics (2015) 16:100
Page 7 of 15
Table 3 Analysis of molecular variance (AMOVA) of the Siberian roe deer populations based on various geographic/genetic
groupings (four geographic regions, three genetic clusters, and two geographic regions)
A
Source of variation
df
SS
MS
Est. Var.
%
F-Statistics
Value
P-Value
Among regions
3
203.555
67.852
0.615
15
FRT
0.148
0.001
Among pop
6
50.962
8.494
0.142
3
FSR
0.040
0.001
Among individuals
179
733.874
4.100
0.710
17
FST
0.182
0.001
Within individuals
189
506.500
2.680
2.680
65
FIS
0.209
0.001
Total
377
1494.892
4.147
100
FIT
0.354
0.001
Source of variation
df
SS
MS
Est. Var.
%
F-Statistics
Value
P-Value
Among regions
2
192.296
96.148
0.853
20
FRT
0.200
0.001
Among pop
5
33.272
6.654
0.077
2
FSR
0.022
0.001
Among individuals
158
627.752
3.973
0.640
15
FST
0.218
0.001
Within individuals
166
447.000
2.693
Total
331
1300.319
df
SS
B
2.693
63
FIS
0.192
0.001
4.263
100
FIT
0.368
0.001
Est. Var.
%
F-Statistics
Value
P-Value
C
Source of variation
MS
Among regions
1
53.813
53.813
0.370
9
FRT
0.093
0.001
Among pop
5
33.272
6.654
0.071
2
FSR
0.020
0.001
Among individuals
126
524.919
4.166
0.645
16
FST
0.111
0.001
Within individuals
133
382.500
2.876
2.876
73
FIS
0.183
0.001
Total
265
994.504
3.962
100
FIT
0.274
0.001
A: Four regions: Jeju Island (SKJ), East region (SKM, RPR), Central region (RYA, RSO, MGN) and West region (RAL, RNO, RUL, RKU). B: Three genetic clusters with two
admixed populations (RYA and RAL) excluded: Jeju Island (SKJ), Eastern region (SKM, RPR, RSO, MGN) and Western region (RNO, RUL, RKU). C: Two geographic
regions with SKJ and two admixed populations (RYA and RAL) excluded: Eastern region (SKM, RPR, RSO, MGN) and Western region (RNO, RUL, RKU)
df: degrees of freedom; SS: sum of squares; MS: mean squares; Est. Var.: estimated variance within and among populations
Three different measures of detecting population
genetic bottlenecks revealed no evidence of a historical or recent bottleneck for nine populations (SKM,
RPR, RYA, RSO, MGN, RAL, RNO, RUL and RKU)
(Table 4). However, the event of a recent population
bottleneck was detected in the Jeju Island, South Korea
(SKJ) (Wilcoxon sign-rank test, two-phase mutation
model (TPM) = 0.005), implying significant excess of
heterozygosity relative to drift-mutation equilibrium. At
the same time the Garza & Williamson’s [24] M values
Fig. 5 Areas of limited gene flow as estimated by BARRIER using Monmorier algorithm [70]. The genetic barriers are shown in bold lines, which
are proportional to the intensity of the barriers
Lee et al. BMC Genetics (2015) 16:100
Page 8 of 15
Fig. 6 Regression of genetic distance on geographic distance between pairs of geographic Siberian roe deer populations. a: Analysis for all
populations, b: Analysis after excluding roe deer from Jeju Island. Each diagram and color present pairs of population based on the structure
result (two clusters). Mantel’s test for correlations was carried out with 999 permutations. Grey circle: within East cluster (SKM, RPR, MGN and RSO),
Grey diamond: within West cluster (RNO, RUL and RKU), Black circle: between mixed populations (RAL and RYA) and East cluster, Black diamond:
between mixed populations (RAL and RYA) and West cluster, Black triangle: within mixed populations (RAL and RYA), Asterisk: Between East and
West cluster (opposite side of the mountains)
(0.765) and mode shift (none) tests did not show any
evidence of genetic bottleneck. Bottleneck analysis suggested that all populations, except Jeju Island, South
Korea (SKJ), were in the range of a historically stable
population.
Discussion
In this study, we investigated the variability of microsatellite loci to understand how different factors of genetic
diversification such as isolation by distance, isolation by
geographical barriers could affect the genetic diversity
and population structure of Siberian roe deer in Northern Asia. Our study is based on samples from extensive
geographic areas of Northern Asia, from Ural Mountains
to the Korean Peninsula and Jeju Island, covering most
of the species’ range to clarify the genetic relationships
among populations from different geographical locations. Autosomal nuclear markers of microsatellites were
employed to investigate the levels of genetic variation
and genetic structuring of Siberian roe deer populations.
Genetic diversity of Siberian roe deer
Relative comparison of genetic diversity estimates among
other roe deer species/populations would be informative
to understanding of the present genetic status of Siberian
roe deer. Although different sets of microsatellite loci were
Lee et al. BMC Genetics (2015) 16:100
Page 9 of 15
Table 4 Results of various tests to detect a recent population
bottleneck event within geographic populations
Population
Wilcoxon sign-rank testsa
Mode shift
Mb
TPM
SKJ
0.005
None
0.765 (0.040)
SKM
0.266
None
0.885 (0.009)
RPR
0.519
None
0.929 (0.018)
RYA
0.380
None
0.777 (0.058)
RSMG
0.733
None
0.831 (0.037)
RSO
0.831
None
0.793 (0.052)
MGN
0.850
None
0.753 (0.048)
RARN
0.320
None
0.810 (0.057)
RAL
0.365
Shifted mode
0.769 (0.103)
RNO
0.206
Shifted mode
0.840 (0.055)
RURK
0.969
None
0.820 (0.058)
RUL
0.677
None
0.787 (0.073)
RKU
0.151
None
0.826 (0.069)
a
One-tail probability for observed heterozygosity excess relative to the
expected equilibrium heterozygosity (Heq), which is computed from the observed
no. of alleles under drift-mutation equilibrium. TPM, two-phase model
b
M value and its variance (in parentheses) of Garza and Williamson. M = the
mean ratio of the no. of alleles to the range of allele size
employed, apart from populations in Jeju Island, South
Korea (SKJ), most of Siberian roe deer populations revealed moderate levels of genetic diversity (HE = 0.522 to
0.628), compared to those previously reported for European roe deer. Microsatellite diversity of European roe
deer ranged from 0.17 to 0.79 in several locations from
Italy, Britain and northern Germany (HE = 0.17 to 0.58
[11], HE = 0.59 to 0.62 [18], and HE = 0.74 to 0.79 [25], respectively). However, because the different sets of microsatellites were employed in diversity estimates and this
may cause an inherent ascertainment bias that can vary
among primer pairs, especially in different species, it
should be interpreted with caution.
During the 20th century, many of the local Siberian
roe deer populations were significantly abated as a result
of human interference [26-30]. However, present data on
the genetic diversity of Siberian roe deer suggests that
the historical population reduction was transient, and its
effects on the genetic diversity of the populations were
insignificant. Result of bottleneck test also supported the
lack of evidence for bottleneck event, except in the Jeju
Island population (See below), indicating general stability
of Siberian roe deer populations in continental Asia.
Different measures of microsatellite variability are consistently high in populations from East and Central Asia
compared to West Siberia (Table 1). One reasonable assumption is that areas to the south and east of Siberia
have function as refugia for roe deer during glacial periods. Several vertebrate species were also reported to
have high levels of mitochondrial DNA variations in
eastern Russia compared with those of surrounding
areas [31]. Combination of cold open steppes with forested areas in south and east of Siberia may have resulted in highly diverse faunas [32], which could provide
preservation and diversification of genetic lineages.
However, phylogeographic and archaeological inference
with additional samples from different geographical regions, using various marker systems, such as mtDNA
and nuclear genes, should be implemented to precisely
determine the role of this region as refugia.
Roe deer from Jeju Island, South Korea (SKJ) showed
the lowest level of genetic diversity among Siberian roe
deer that were sampled in this study. This presumably is
due to the geographic isolation and historical population
fluctuations on Jeju Island. Roe deer inhabited in Jeju Island during the last glacial maximum (LGM) when there
was a bridge between the island and the Korean peninsula. It is probable that a relatively small group of animals was founded in the island after the last glacial
periods, which led to reduced genetic diversity due to
processes such as founder effect and genetic drift. Human interference, such as excessive hunting and poaching, could be another possible cause of the genetic
deprivation in Jeju population. The roe deer population
in Jeju gradually declined to near extinction in the early
1970s because of continuous hunting and poaching [33].
Since the 1980s, Jeju Special Self-Governing Province
and Jeju citizens has been active in conservation for roe
deer such as providing food during winter, removing
traps, and clamping down on poaching [34, 35]. Consequently, the roe deer population in Jeju increased to
5,000 individuals in 1992 and climbed to 12,881 individuals in 2009 [33]. The effect of recent fluctuations of roe
deer population in Jeju Island on its genetic diversity is
supported by the Bottleneck tests (Table 4). Therefore,
continuous monitoring of genetic diversity would be essential for effective management and conservation of
Siberian roe deer in Jeju Island.
Genetic structure and gene flow
Present studies of genetic structure and differentiation
among Siberian roe deer populations clearly display the
existence of genetically distinct three clusters which comprise of the southeastern group (SKM, RPR, RSO and
MGN), northwestern group (RUL, RKU and RNO) and
Jeju Island population in Korea (SKJ). Such pattern of genetic structure is well in accordance with distribution of the
two subspecies, C. p. pygargus and C. p. tianschanicus,
suggested by previous study [36]. Recently, mitochondrial
DNA sequence and nuclear IRBP (Interphotoreceptor retinoid binding protein) data has been presented that Jeju
Island population to another subspecies, C. p. ochracea
[37]. The genetic makeups of the two populations (RYA
and RAL) are indicative of admixture of the two groups
Lee et al. BMC Genetics (2015) 16:100
(southeastern and northwestern groups); however, a small
sample size limits ultimate defining of their genetic status.
A previous study [2] proposed three major factors that
may limit the geographical distribution of Siberian roe
deer. The first factor is geographical barriers consisting
of major mountain ridges (Altai, Sayans and Stanovoye)
and the Lake Baikal (Fig. 1), which also delineate geographical ranges of two subspecies (C. p. pygargus and
C. p. tianschanicus). The second factor is the depth of
snow and duration of the snowy period [2, 38, 39] and
last factor is the predominant vegetation type of the region, such as taiga, tundra, and desert [2]. These three
factors and their interaction presumably limited further
spread of roe deer, but probably first factor is the most
important for the formation of genetic groups or subspecies. The other possible reason of it is that the mountain
ridges could serve as refugia during periods of climate
change (e. g. during the glacial maximums). In the periods of climatic optimums different genetic lineages
could spread from the mountains in different areas
resulting in formation of genetically different groups,
possibly subspecies. However, this assumption need to
additional phylogenetic studies will be required.
Barrier analysis that detected change genetic composition was also support limited gene flow in the major
mountain ridges (Fig. 5). Southeastern group (SKM,
RPR, RSO and MGN) and Northwestern group (RUL,
RKU and RNO) supported relatively high frequency and
fallowed by genetically admixed two populations (RYA
and RAL) in the border areas. Besides, results of the Isolation by distance (IBD) (Fig. 6b) displayed that about
38 % of the genetic variation is explained by geographical distances between locations over the entire continent of Asia, which fits the hierarchical island model,
suggesting modern genetic structure resulted from natural processes [2, 10, 40, 41]. Additionally, different pattern of distribution in the IBD scatter plot between and
within groups (southeastern and northwestern groups)
ascertains the effect of mountains ridges on the restricted level of gene flow between groups. Thus, mountain ridges of the southern Siberia have limited gene
flow between Southeastern (SKM, RPR, RSO and MGN)
and Northwestern (RUL, RKU and RNO) groups, leading to current genetic structure.
It should be noted that the Altay population (RAL) is
located in the border area of two subspecies and shows
the admixed pattern of two genetic clusters. This population is genetically related to both groups (Southeastern
and Northwestern) and likely has historical and ongoing
gene flow with adjacent locations (Fig. 1). A previous
study of mitochondrial DNA [42] proposed that roe deer
in Altai Mountain might experience multiple population
replacements, stressing the role of the Altai Mountain as
a physical boundary separating C. p. pygargus and C. p.
Page 10 of 15
tianschaniscus. This speculation is based on the genetic
heterogeneity of Siberian roe deer in the Altai Mountains, and relatively stable climatic conditions of the region compared to other Siberian regions during the
Pleistocene [42]. However, to resolve the question of
border area, additional population genetic studies with
more samples from areas at a finer geographic scale will
be required.
Roe deer population in Yakutia, Russia (RYA), were
established as a result of natural radiation from the
southern parts of geographical range and could originate
from both C. p. pygargus and C. p. tianschaniscus [43].
This assumption complies with the genetic structure of
the Yakutian population obtained in this study and is
also confirmed by the previous studies using morphology and karyotype [44, 45].
Roe deer from Jeju Island, South Korea (SKJ) are genetically divergent from all other Siberian roe deer, including those on the Korean mainland. The Jeju Island
population was isolated from the mainland population
since LGM, and as a result, there has been no gene flow
between these two locations. Thus, the present genetic
feature of the Jeju Island population was derived as a
consequence of long-term geographical isolation and
adaptation to island environment. Cases where Jeju island populations showing unique genetic and/or morphological features was also described for other mammal
species such as wild boar (Sus scrofa), striped field
mouse (Apodemus agrarius chejuensis) and Siberian
weasel (Mustela sibirica) [46]. Future studies of this isolated population would contribute to understanding the
effect of peripheral isolation on microevolution in
Cervidae.
Our results do not coincide with the recent phylogeographic findings [19] that demonstrated no apparent
geographical structuring for Siberian roe deer sampled
from vast geographic areas of Eurasia. Variability of
mtDNA control region suggested that the Siberian roe
deer in Asia has undergone genetic admixture and appears to show no apparent geographic barriers to gene
flow [19]. This difference could be due to the sensitivity
of molecular markers and disparate interpretation owing
to insufficient sample size and different modes of inheritance. The microsatellites are highly polymorphic and
autosomal nuclear markers with biparental inheritance,
and are more appropriate to delineate genetic structure
of recently diverged populations.
Management and conservation Implications
Overall, this study suggests that at least three distinct
management units may exist for the Siberian roe deer
populations in Asia [47]: Northwest genetic group (RUL,
RKU and RNO, partially corresponding to C. p. pygargus
subspecies), southeast genetic group (SKM, RPR, RSO
Lee et al. BMC Genetics (2015) 16:100
and MGN, corresponding to C. p. tianschanicus) and
Jeju Island genetic group. Future planning of management and/or conservation policies, including ex situ
population breeding, translocation and reintroduction
programs, need to consider the distinctiveness of the
three genetic groups in the Siberian roe deer species.
Strict application of management unit concept for the
two admixed populations (RYA and RAL) might be relaxed, or postponed until more detailed studies focusing
on these populations are performed.
The roe deer population in Jeju Island, Korea (SKJ)
needs special attention due to its low level of genetic diversity compared to those of continental populations.
The Jeju Island population seems to be thriving at the
present time, despite the low level of heterozygosity. The
current size of the Jeju roe deer population is estimated
to be around 12,881 [33] and considered to be overpopulated in the island. However, considering the deprived level of genetic diversity, it is probable that the
Jeju population might be vulnerable to epidemic diseases
or any change of environment in the future. Therefore,
it is recommended that both the genetic and physical
health statuses of the population are closely monitored.
Artificial translocation of roe deer individuals from the
mainland Korea to Jeju Island to increase genetic diversity of Jeju population is not recommended because
these two populations are genetically highly differentiated and should be regarded as separate management
units.
Herbivorous animals such as roe deer play an important role in the ecosystem, providing a prey for large carnivores. Therefore, proper genetic management of
Siberian roe deer populations and continuous monitoring of its genetic status is critical for maintaining healthy
ecosystem. It is important to stress that systematic cooperation between countries where Siberian roe deer inhabit (Russia, Kazakhstan, Mongolia, China, North
Korea and South Korea) is imperative for effective maintenance of genetic diversity and gene flow of Siberian
roe deer. In particular, cooperative management of
border area is important not only for the roe deer itself
but also for a number of endangered large carnivore
species.
For example, Siberian roe deer is one of the main prey
animal of Amur leopard (Panthera pardus orientalis) in
the border area among Russia, China and North Korea
[48, 49]. Thus maintaining healthy roe deer population
in this transboundary region is crucial for the survival of
Amur leopard, which is one of the most severely endangered subspecies of large Felidae species in the world
[49–53]. The status of the Siberian roe deer population
in North Korea remains unknown and the gene flow has
been discontinued along the Demilitarized Zone (DMZ)
of North and South Korean border for more than five
Page 11 of 15
decades. This situation would have negative impacts on
the long-term persistence of the Siberian roe deer in
Korean peninsula and the restoration efforts of Amur
leopard and tiger populations in this region. Siberian roe
deer also serve as an important prey species for other
carnivores like Amur tigers, gray wolves, lynxes, dholes,
bears, as well as foxes, martens, eagles and wild boars
[51, 54]. Thus, proper management of roe deer populations in northern Asian continent will also benefit many
other species, and eventually, the biodiversity of the entire region.
Conclusion
In conclusion, the present study reveals that Siberian roe
deer inhabiting Asia is composed of genetically distinct
populations (Southeast, Northwest and Jeju Island,
Korea) and East–west gradient in genetic diversity. As a
whole, geographical barriers, as well as the genetic isolation as a function of geographic distance ascertain restricted level of gene flow among roe deer populations
over the whole continent of Asia. Two genetically
admixed populations, however, also reside in the border
areas between the two genetically distinct groups. Knowledge on the present status of genetic structure and genetic diversity of Siberian roe deer has important
implications on the ecological and geographical impact
on genetic characteristics of Siberian roe deer. The insights obtained from this study can be applied in management and conservation of local populations of
Siberian roe deer in Asia and raise the necessity of continuous monitoring of genetic status of such important
animals.
Methods
Sample collection and DNA extraction
A total of 189 individuals of C. pygargus were collected
from ten locations in Russia, Mongolia and South Korea
(Fig. 1). Jeju, South Korea (SKJ), Mainland South Korea
(SKM), Primorsky Krai, Russia (RPR), Yakutia, Russia
(RYA), surroundings of Sokhondinsky Zapovednik (nature
reservation), Russia (RSO), Northern part of Mongolia
(MGN), Altaisky Krai, Russia (RAL), Novosibirskaya
Oblast’, Russia (RNO), Sverdlovskaya Oblast’, Ural,
Russia (RUL) and Kurganskaya Oblast’, Russia (RKU).
This experimental work was conducted with permission by the Conservation Genome Resource Bank for
Korean Wildlife (CGRB) that provided the roe deer samples for this study. All samples were legally collected and
deposited into CGRB. The procedures involving animal
samples followed the guidelines by Seoul National University Institutional Animal Care and Use Committee (SNU
IACUC). Tissue (muscle, skin and liver) and blood samples were collected across the current distribution range
of C. pygargus from 2001 to 2011, and were frozen at
Lee et al. BMC Genetics (2015) 16:100
−70 °C deep freezer in the CGRB or stored in ethanol
until DNA extraction. Genomic DNA was extracted
from individual sample using the DNeasy tissue and
blood kit (Qiagen, Valencia, CA) following the manufacturer’s protocol.
Microsatellite analysis
A total of 12 microsatellite loci were used and tested for
genotyping and genetic analysis of C. pygargus sampled.
Microsatellite markers previously developed from rein deer
(RT1, RT20, RT23, RT24, RT30), cattle (MB25, BM757,
CSSM41, IDNGA8, IDNGA29), and European roe deer
(Roe01, Roe09) have proved to be polymorphic in Siberian
roe deer, and were used through the cross-species amplification in this study (Additional file 1: Table S2). Genomic
DNA was amplified for genotyping under the following conditions. The touchdown profile for the PCR amplification
was at 94 °C for 15 min, followed by 20 cycles at 94 °C for
30 S, 65 °C for 60 S, and 72 °C for 30 S, with annealing
temperature decreased by 0.5 °C per cycle to 55 °C. The
touchdown cycles were followed by an additional 25 cycles
at 94 °C for 30 S, 55 °C for 1 min, 72 °C for 30 S, and a
final extension at 72 °C for 20 min. The PCR reaction
mixture contained MgCl2 (2 mM), dNTP (each 0.2 mM),
and i-Star Taq DNA polymerase (0.025 U) of iNtRON
biotechnology Inc (Korea). One of three (Hex, 6-Fam,
Tamra) fluorescently-labeled M13 primers (0.26 pmol), unlabeled M13-tailed forward primer (0.13 pmol), and reverse
primer (0.26 pmol) were also added to the reaction tubes.
All amplifications were implemented in a volume of 15 μl in
TaKaRa thermal cyclers. Alleles were determined by ABI
Prism3730 XL DNA Analyzer (Applied Biosystemsinc, USA)
using GENESCAN-500 [Rox] size standard and analyzed
GeneMapper version 3.7 (Applied Biosystemsinc, USA).
Data analysis
Summary statistics
Ten locations were used for basic analyses to obtain the
summary statistics, and to improve statistical power for
certain analysis like Bottleneck test, six locations with
geographical proximity and small sample size were further pooled into three locations such as, (RSMG: RSO &
MGN), (RARN: RAL & RNO) and (RURK: RUL &
RKU). The number of all alleles per locus and population (MNA), observed heterozygosity (HO) and expected
heterozygosity (HE) in Hardy-Weinberg equilibrium
were estimated for each locus using the Microsatellite
Toolkit, version 3.0 [55]. Allelic richness (Ar), F-statistics
(FIS, FST) [56] and genotype linkage disequilibrium for
all pair of loci in population were determined using the
program FSTAT, version 2.9.3 [57]. Allelic Richness is
one of important measures of genetic diversity and is
calculated based on a minimum sample size of each
population to compensate for the differences in sample
Page 12 of 15
size among populations. Wilcoxon signed rank test was
employed to assess differences in allelic richness and expected heterozygosity that are corrected by small sample
sizes using the STATISTIX version 8.1 (Analytical Software, Statistix; Tallahassee, FL, USA, 2000). The number
of loci with null alleles was assessed using MICROCHECKER [58]. Occurrence of null alleles can lead to
diminution in genetic diversity and inflate genetic differentiation among population [59]. Null alleles can be
common owing to ascertainment bias and sequence variation especially when microsatellites from cross-species
amplification are used. The number of private alleles
and genetic characteristics of 12 microsatellite loci for
ten regional samples were determined using the GenAlEx version 6.1 [60]. The program CERVUS, version 2.0
was used to calculate the polymorphism information
content (PIC), observed heterozygosity (HO) and expected heterozygosity (HE) of each locus [61]. Deviations
from Hardy-Weinberg equilibrium (HWE) for each geographic population were evaluated using the exact probability test [62] using the Fisher procedure calculated by
GENEPOP, version 3.3 [63].
Gene flow measures
The pattern of gene flow between populations was measured using two different approaches. First, the effective
number of migrants per generation (Nem) between populations was calculated from with the following formula:
Nem = (1 − FST) / 4FST [64], where Ne is the effective
population size and m is the migration rate. This gene
flow (Nem) estimate is an approximation of a particular
theoretical model (Island model) at equilibrium that migration occurs at the same rate with equal population
size. FST is a measure of genetic differentiation between
populations and allows estimation of relatively longterm gene flow based on allele frequency distributions.
Pairwise FST between populations and their significance
calculated using the program FSTAT version 2.9.3 [57].
Also, pairwise FST were corrected by the ENA method
(excluding null alleles) using the FREENA software [65].
The difference between the ENA corrected and uncorrected FST values was evaluated by the Wilcoxon rank
sum test using the STATISTIX version 8.1 (Analytical
Software, Statistix; Tallahassee, FL, USA, 2000).
Genetic relationship
The genetic relationship between populations was evaluated by the Nei’s genetic distances (DA) [66] based on allele frequencies using the program DISPAN [67].
Genetic relationship trees were constructed by unweighted pair group method with the arithmetic mean
(UPGMA) [68] based on DA distance with 1000 bootstrap replications to test the validity of tree topologies.
Principal coordinate analysis (PCA) was conducted using
Lee et al. BMC Genetics (2015) 16:100
the covariance matrix of allele frequencies using the
GENALEX version 6.1 [60]. Two principal values with
the first and second highest factor scores were employed
to construct a scatter diagram to visualize genetic relationships among populations. The GENALEX version
6.1 was further used to carry out hierarchical analysis of
molecular variance (AMOVA) of genetic differentiation
among populations and regions, and F-statistics (FRT,
FSR , FST, FIS and FIT). According to the geographical distance, ten roe deer populations were divided into four
main regions for the AMOVA analysis: Jeju Island,
South Korea (SKJ), East region (SKM, RPR), Central region (RYA, RSO, MGN) and West region (RAL, RNO,
RUL and RKU). Besides, according to the structure result (three clusters), eight roe deer populations were divided into three main regions excluding the two
admixed populations (RYA, RAL) for the AMOVA analysis: Jeju Island, South Korea (SKJ), Eastern region
(SKM, RPR, RSO and MGN) and Western region (RNO,
RUL and RKU). Additionally, seven populations were divided into two main regions with SKJ and two admixed
populations (RYA and RAL) excluded: Eastern region
(SKM, RPR, RSO, MGN) and Western region (RNO,
RUL, RKU). Significance level was calculated by the permutation procedure (999 permutations).
Population structure
Existence of population genetic structuring was evaluated
using the model-based Bayesian clustering method in the
program STRUCTURE version 2.3.4 [69], which infers the
number of genetic clusters (K) without prior information
about population origin. This method calculates independent assessments of each individual for each cluster.
The log-likelihood data [Ln Pr (X/K)] was estimated for
given K between 1 and 10 with ten independent runs set
by 1,000,000 Markov chain Monte Carlo (MCMC) iterations followed by burn-in period of 100,000 iterations.
The “real” value of K within the dataset was estimated
from the Ln Pr (X/K) according to the method of Evanno
et al. [23], in which log-likelihood values and variance
from each replicate of K were used to calculate ΔK. An ad
hoc statistic test in this parameter was used in simulations
to identify the true number of genetic clusters, which offers accurate means to selecting K instead of choosing a K
with the highest log probability that could lead to overestimated K [23]. Existence of Isolation-by-distance (IBD)
[64] was obtained by the regression of genetic distance
(FST / (1-FST)) on geographic distance (Ln-Km) between
pairs of populations. The correlations for two variables
and probability were carried out using the Mantel’s test in
GENALEX version 6.1 and significance was determined
based on 999 permutations [60].
We also applied Monmonier’s maximum difference algorithm to highlight geographical features with obvious
Page 13 of 15
genetic discontinuity between populations using the program BARRIER version 2.2 [70]. The data from nine
populations except Jeju island, Korea (SKJ) were analyzed to detect putative barriers of gene flow among the
populations. Geographical coordinates were used for
each population and connected by Delauney triangulation using a pairwise FST genetic matrix. We conducted
the analysis using FST for each of the eleven microsatellite loci; exclude IDVGA29 due to low polymorphism, to
make sure that the barriers were not verified with strong
differentiation at only few loci. Each locus indicates how
many support a given barrier and putative genetic
boundaries were identified across the geographical landscapes. Pairwise FST, RST and pRST (RST computed after
allele size permutation test with 1000 randomizations)
were calculated per each population and locus to estimate the main causes of population differentiation in
Siberian roe deer using program SPAGeDi [71, 72]. RST
was compared against the distribution of pRST values.
Bottleneck detection
Three different approaches were used to detect molecular evidence of historical population bottleneck. First, we
tested for deviations of expected heterozygosity (He)
relative to heterozygosity expected at drift-mutation
equilibrium (Heq) by Wilcoxon sign-rank tests (∝ = 0.05,
∝ = 0.01) [73] using the BOTTLENECK version 1.2.02
[74, 75]. During bottlenecks, the number of rare alleles
is reduced faster than the heterozygosity at polymorphic
loci due to drift [66]. Thus the bottleneck test can detect
this disparity when He becomes larger than Heq, because
Heq reflects allele number and sample size. We used a
two-phase mutation model (TPM) [76] using a setting of
10 % multiple-step mutations and 90 % single-step mutations with 1,000 iterations. Secondly, we checked out a
mode-shift in distributions of allele frequencies from the
L-shaped distribution under the mutation-drift equilibrium, expecting distorted distribution under the recent
population bottleneck [77].
Lastly, M value of Garza & Williamson’s [24] was calculated for each population to detect the long-term decrease of population size using the program AGARST
version 3.3 [78]. M is the mean ratio of the total number
of alleles to the range of allele size. This test is useful for
detecting a bottleneck further in the past (>100 generations). Meta-analysis for natural populations revealed
that historically reduced or founded populations had Mratio < 0.68, but stable populations showed M > 0.82.
Additional file
Additional file 1: Table S1. Genetic characteristics of 12 microsatellite
loci for Siberian roe deer from seven geographic regions in Asia. See Fig. 4
for sampling regions. Table S2: Source information and characteristics of 12
Lee et al. BMC Genetics (2015) 16:100
microsatellite markers obtained from cross-species amplification. Table S3:
Wilcoxon signed rank test to assess differences in allelic richness (Ar) and
expected heterozygosity that are corrected by small sample sizes (UHE)
(one-tailed p-value). Figure S1: Bar graph of allelic diversity (Ar) and
expected heterozygosity that are corrected by small sample sizes (UHE) in
eight Siberian roe deer population. Table S4: Differentiation among three
regions (cluster) of Siberian roe deer estimated by pairwise RST, mean pRST
and FST values per locus and multilocus.
Abbreviations
SKJ: Jeju South Korea; SKM: Mainland South Korea; RPR: Primorsky Krai Russia;
RYA: Yakutia Russia; RSO: Sokhondinsky Zapovednik Russia; MGN: Northern
part of Mongolia; RAL: Altaisky Krai Russia; RNO: Novosibirskaya Oblast’ Russia;
RUL: Sverdlovskaya Oblast’ Ural, Russia; RKU: Kurganskaya Oblast’ Russia;
PIC: Polymorphism information content; AMOVA: Analysis of molecular
variance; PCA: Principal coordinates analysis; HWE: Hardy-Weinberg
equilibrium; MNA: Mean number of alleles per locus; ENA: Excluding null
alleles; IBD: Isolation by geographic distance; TPM: Two-phase mutation
model.
Competing interests
The authors declare that they have no competing interests.
Authors’ contributions
KSK and HL conceived of the study, and participated in designed the
experiments and helped to draft the manuscript. NM participated in
designed the experiments and conception of study, and provided genetic
materials and helped to draft the manuscript. YSL carried out the molecular
genetic studies, experiments, data analyses, and wrote the manuscript. MSM,
IV, AA, DB, JGO and YSP provided genetic materials and helped to draft the
manuscript. All authors read and approved the final manuscript.
Acknowledgements
We gratefully acknowledge Dr. Brad S. Coates, USDA-ARS, Corn Insects &
Crop Genetics Research Unit, Ames, IA, USA for his valuable comments and
revision of this manuscript. This work was supported by a Korea Science and
Engineering Foundation (KOSEF) grant funded by the Korean government
(MEST) (No. 2009–0080227 and NRF-2008-314-C00340) and was partially supported by the program of the Presidium of RAS “Zhyvaya pridoda” (project
12-P-4-1048 UrO RAN). This study was supported in part by the Research Institute for Veterinary Science and BK21 PLUS Program for Creative Veterinary
Science Research, Seoul National University. We would like to express our extreme gratitude to Mr. Han-Chan Park (Seoul National University) for his valuable comments and Mr. Su-Ho Kim (The Korean Association for Bird
Protection), Mr. Chang-Wan Kang (The Korean Association for Bird Protection), Dr. Tae-Young Choi (National Institute of Ecology), Dr. Young-Jun Kim
(National Institute of Ecology), Dr. Baek-Jun Kim (National Institute of Ecology), Gyeongsangnam-do forest environment research institute and Roe
deer observation center for providing us with roe deer samples during this
study period. We would also like to thank Mr. Frederick D. Kim and Dr. JuSun Hwang for valuable English editing of this manuscript.
Author details
1
Conservation Genome Resource Bank for Korean Wildlife, College of
Veterinary Medicine, Seoul National University, Gwanak-gu, Seoul 151-742,
Republic of Korea. 2Institute of Plant and Animal Ecology Urals Branch of
Russian Academy of Sciences, Yekaterinburg 620144, Russia. 3Lazovsky State
Nature Reserve, Lazo, Primorsky Krai 692980, Russia. 4Institute for Biological
problems of Cryolihtozone Siberian Branch of Russian Academy of Sciences,
Yakutsk 677980, Russia. 5Department of Molecular Biology and Genetics,
National University of Mongolia, Ulaanbaatar 210646, Mongolia. 6Research
Institute for Hallasan, Jeju Special Self-Governing Province, Jeju 690-815,
Republic of Korea. 7Department of Conservation Ecology, National Institute
of Ecology, 1210, Geumgang-ro, Maseo-myeon, Seocheon-gun,
Chungcheongnam-do 325-813, South Korea. 8Department of Ecology,
Evolution, and Organismal Biology, Iowa State University, Ames, IA 50011,
USA.
Received: 2 February 2015 Accepted: 29 June 2015
Page 14 of 15
References
1. Bouvrain G, Geraads D, Jehenne Y. New data relating to the classification of
the Cervidae (Artiodactyla, Mammalia). Zool Anz. 1989;223:82–90.
2. Danilkin AA. Behavioural ecology of Siberian and European roe deer.
London: Chapman & Hall; 1996.
3. Matosiuk M, Borkowska A, Świsłocka M, Mirski P, Borowski Z, Krysiuk K, et al.
Unexpected population genetic structure of European roe deer in Poland:
an invasion of the mtDNA genome from Siberian roe deer. Mol Ecol.
2014;23:2559–72.
4. Hewitt G. The genetic legacy of the Quaternary ice ages. Nature.
2000;405:907–13.
5. Segelbacher G, Cushman SA, Epperson BK, Fortin M, Francois O, Hardy OJ,
et al. Applications of landscape genetics in conservation biology: concepts
and challenges. Conserv Genet. 2010;11:375–85.
6. Breitenmoser U. Large predators in the Alps: the fall and rise of man’s
competitors. Biol Conserv. 1998;83:279–89.
7. Maehr DS, Noss RF, Larkin JL. Large Mammal Restoration. Washington, DC:
Island Press; 2001.
8. Harris RB, Wall WA, Allendorf FW. Genetic consequences of hunting: what
do we know and what should we do? Wildlife Soc B. 2002;30:634–43.
9. Korotkevich YL, Danilkin AA. Phylogeny, evolution and systematics. In:
Sokolov VE, editor. European and Siberian roe deer. Moscow: Nauka press;
1992. p. 8–21.
10. Danilkin AA. Capreolus pygargus. Mamm Spec. 1995;512:1–7.
11. Lorenzini R, Lovari S, Masseti M. The rediscovery of the Italian roe deer:
genetic differentiation and management implications. Ital J Zool.
2002;69:367–79.
12. Vernesi C, Pecchioli E, Caramelli D, Tiedemann R, Randi E, Bertorelle G. The
genetic structure of natural and reintroduced roe deer (Capreolus capreolus)
populations in the Alps and central Italy, with reference to the
mitochondrial DNA phylogeography of Europe. Mol Ecol. 2002;11:1285–97.
13. Lorenzini R, San José C, Braza C, Aragón S. Genetic differentiation and
phylogeography of roe deer in Spain, as suggested by mitochondrial DNA
and microsatellite analysis. Ital J Zool. 2003;70:89–99.
14. Randi E, Alves PC, Carranza J, Milosevic-Zlatanovic S, Sfougaris A, Mucci N.
Phylogeography of roe deer (Capreolus capreolus) populations: the effects of
historical genetic subdivisions and recent nonequilibrium dynamics. Mol
Ecol. 2004;13:3071–83.
15. Lorenzini R, Lovari S. Genetic diversity and phylogeography of the European
roe deer: the refuge area theory revisited. Biol J Linn Soc. 2006;88:85–100.
16. Royo LJ, Pajares G, Alvarez I, Fernandez I, Goy-Ache F. Genetic variability and
differentiation in Spanish roe deer (Capreolus capreolus): a phylogeographic
reassessment within the European framework. Mol Phylogenet Evol.
2007;42:47–61.
17. Kamieniarz R, Wolc A, Lisowski M, Dabert M, Grajewski B, Steppa R, et al.
Inter and intra subpopulation genetic variability of roe deer (Capreolus
capreolus L.) assessed by I and II class genetic markers. Folia Biol-Prague.
2011;59:127–33.
18. Baker KH, Hoelzel AR. Evolution of population genetic structure of the
British roe deer by natural and anthropogenic processes (Capreolus
capreolus). Ecol Evol. 2013;3:89–102.
19. Lorenzini R, Garofalo L, Qin X, Voloshina I, Lovari S. Global phylogeography
of the genus Capreolus (Artiodactyla: Cervidae), a Palaearctic meso-mammal.
Zool J Linn Soc. 2014;170:209–21.
20. Randi E, Pierpaoli M, Danilkin A. Mitochondrial DNA polymorphism in
populations of Siberian and European roe deer (Capreolus pygargus and C.
capreolus). Heredity. 1998;80:429–37.
21. Zvychainaya EY, Danilkin AA, Kholodova MV, Sipkoa TP, Berberb AP. Analysis
of the variability of the control region and cytochrome b gene of mtDNA of
Capreolus pygargus Pall. Biol Bull. 2011;38:434–9.
22. Sheremetyeva IN, Sheremetyev IS, Kartavtseva IV, Zhuravlev Yu N. Polymorphism
of a short fragment of the mitochondrial genome control region (D-loop) in the
Siberian roe deer Capreolus pygargus Pallas, 1771 (Artiodactyla, Cervidae) from
the Russian Far East. Russ J Genet. 2010;46:595–602.
23. Evanno S, Regnaut S, Goudet J. Detecting the number of clusters of
individuals using the software STRUCTURE: a simulation study. Mol Ecol.
2005;14:2611–20.
24. Garza JC, Williamson EG. Detection of reduction in population size using
data from microsatellite loci. Mol Ecol. 2001;10:305–18.
25. Zachos FE, Hmwe SS, Hartl GB. Biochemical and DNA markers yield
strikingly different results regarding variability and differentiation of roe deer
Lee et al. BMC Genetics (2015) 16:100
26.
27.
28.
29.
30.
31.
32.
33.
34.
35.
36.
37.
38.
39.
40.
41.
42.
43.
44.
45.
46.
47.
48.
49.
50.
51.
52.
(Capreolus capreolus, Artiodactyla: Cervidae) population from northern
Germany. J Zool Syst Evol Res. 2006;44:167–74.
Filonov KP. Peculiarities of the South Urals Siberian roe deer population.
Moscow: Lesnaya Promishlennost press; 1974. p. 26–40.
Ushkov SL. Roe deer migrations in the Southern Urals. Bulletin of the
Moscow society of the ispitateley prirodi. 1954;59:9–12.
Kucherenko S, Shvets V. The roe deer of the Amur-Ussuri region. Okhota i
okhotnichie khozyaistvo. 1977;3:22–3.
Shvets VG. Decrease of roe deer numbers in the Khabaravsk region part of
Amur area. In: Sokolov VE, editor. Ungulates of the USSR. Moscow: Nauka
press; 1975. p. 352.
Danilkin AA, Dulamtseren S. The roe deer in Mongolia. Okhota i okhotnichie
khozyaistvo. 1981;3:44–5.
Kryukov AP. Comparative phylogeographic patterns of several vertebrates in
the east palearctic. Mosc Univ Biol Sci Bull. 2010;65:184–6.
Zabelin VI. To the problem of variantion of environment and evolution of
Pleistocene-Holocene fauna of Altai-Sayan mountain region. Baikalsky
zoologichesky zhurnal. 2012;11:5–11.
Choi KH. Spatio-temporal analysis of roe deer population in Jeju using agestructured population and habitat suitability models. Master thesis: Seoul
National University, Department of Environmental Planning; 2011.
Yoon SI. A study on ecological characteristics of roe deer (Capreolus
pygargus tianschanicus) in jeju island. Korea: PhD thesis. Korea University,
Forest Resources; 2003.
Oh JG. Characteristics of ecological behaviour of roe deer (Capreolus
pygargus tianschanicus) in jeju island. Korea: PhD thesis. Korea National
University of Education, Biology Education Major; 2004.
Danilkin AA. Olen’i (Cervidae). Moscow: GEOS press; 1999.
Koh HS, Bayarlkhagva D, Jang KH, Han ED, Jo JE, Ham EJ, et al. Genetic
divergence of the Siberian roe deer from Korean Jeju Island (Capreolus
pygargus ochraceus), reexamined from nuclear IRBP and mitochondrial
cytochrome b and control region sequences of C. pygargus. J Biol Res.
2013;19:46–55.
Formozov AN. Snow cover in the life of mammals and birds of the USSR.
Moscow: MNS Press; 1946. p. 141.
Nasimovish AA. The snow cover role in the life of ungulate animals of the
USSR. Moscow: USSR Academy of Sciences Publishing House; 1955. p. 401.
Danilkin AA. Populations structure. In: Sokolov VE, editor. European and
Siberian roe deer. Moscow: Nauka press; 1992. p. 160–84.
Danilkin AA, Darman YA, Minayev AN. The seasonal migrations of a Siberian
roe deer population. Rev Ecol-Terre Vie. 1992;47:231–43.
Vorobieva NV, Sherbakov DY, Druzhkova AS, Stanyon R, Tsybankov AA,
Vasil’ev SK, et al. Genotyping of Capreolus pygargus fossil DNA from
Denisova Cave reveals phylogenetic relationships between ancient and
modern populations. PLoS One. 2011;6:e24045.
Argunov AV. Formation of the Range of the Siberian Roe Deer (Capreolus
pygargus, Cervidae) and Its Present Distribution in Yakutia. Biol Bull. 2013;40:692–7.
Boeskorov GG, Danilkin AA. On the taxonomic status of the Siberian Roe
Deer (Capreolus pygargus, Cervidae) in Central Yakutia. Zool Zh.
1998;77:1080–3.
Boeskorov GG, Argunov AV, Kulemzina AI. On the taxonomic status of the
Siberian Roe Deer in Yakutia. Probl Region Ekol. 2009;3:103–7.
Jo YS, Kim TW, Choi BJ, Oh HS. Current status of terrestrial mammals on Jeju
Island. J Spec Res. 2012;1:249–56.
Palsboll PJ, Berube M, Allendorf FW. Identification of management units
using population genetic data. Trends Ecol Evol. 2007;22:11–6.
Hebblewhite M, Miquelle DG, Murzin AA, Aramilev VV, Pikunov DG.
Predicting potential habitat and population size for reintroduction of the
Far Eastern leopards in the Russian Far East. Biol Conserv. 2011;144:2403–13.
Abramov VK, Pikunov DG. The leopard in Far Eastern USSR and its
protection. Biol MOEP Dept Biol. 1974;79:5–15.
Pikunov DG, Korkishko VG. The Far Eastern leopard. Vladivostok: Dalnauka
Press; 1990. p. 1–192.
Miquelle DG, Smirnov EN, Merrill TW, Myslenkov AE, Quigley H, Hornocker
MG, et al. Hierarchical spatial analysis of Amur tiger relationships to habitat
and prey. In: Seidensticker J, Christie S, Jackson P, editors. Riding the Tiger.
Tiger Conservation in Human-dominated Landscapes. UK: Cambridge:
Cambridge University Press; 1999. p. 71–99.
Molinari-Jobin A, Zimmermann F, Ryser A, Breitenmoser-Würsten C, Capt S,
Breitenmoser U, et al. Variation in diet, prey selectivity and home-range size
of Eurasian lynx Lynx lynx in Switzerland. Wildlife Biol. 2007;13:393–405.
Page 15 of 15
53. Peterson RO, Ciucci P. The wolf as a carnivore. In: Mech LD, Boitani L,
editors. Wolves: Behavior, Ecology, and Conservation. Chicago: University of
Chicago Press; 2003. p. 106–8.
54. Geist V. Deer of the world: Their evolution, behavior, and ecology.
Mechanicsburg: Stackpole Books; 1998. p. 308.
55. Park SDE. Trypanotolerance in West African cattle and the population
genetic effects of selection. Dublin: PhD Thesis. University of Dublin, Smurfit
Institute of Genetics; 2001.
56. Weir B, Cockerham C. Estimating F statistics for the analysis of population
structure. Evolution. 1984;38:1358–70.
57. Goudet J. FSTAT(version 1.2): a computer program to calculate F-statistics. J
Hered. 1995;86:485–6.
58. Van Oosterhout C, Hutchinson WF, Wills DPM, Shipley P. MicroChecker:
software for identifying and correcting genotyping errors in microsatellite
data. Mol Ecol Notes. 2004;4:535–8.
59. Dakin EE, Avise JC. Microsatellite null alleles in parentage analysis. Heredity.
2004;93:504–9.
60. Peakall R, Smouse PE. GENALEX 6: genetic analysis in Excel. Population
genetic software for teaching and research. Mol Ecol Notes. 2006;6:288–95.
61. Kalinowski ST, Taper ML, Marshall TC. Revising how the computer program
CERVUS accommodates genotyping error increases success in paternity
assignment. Mol Ecol. 2007;16:1099–106.
62. Guo SW, Thompson EA. Performing the exact test of hardy weinberg
proportion for multiple alleles. Biometrics. 1992;48:361–72.
63. Raymond M, Rousset F. Genepop (version 1.2): population genetics software
for exact tests and ecumenicism. J Hered. 1995;86:248–9.
64. Wright S. The genetical structure of populations. Ann Hum Genet.
1931;15:323–54.
65. Chapuis MP, Estoup A. Microsatellite null alleles and estimation of
population differentiation. Mol Biol Evol. 2007;24:621–31.
66. Nei M, Tajima F, Tateno Y. Accuracy of estimated phylogenetic trees from
molecular data. J Mol Evol. 1983;19:153–70.
67. Ota T. DISPAN: genetic distance and phylogenetic analysis. University Park,
Pennsylvania, USA: Pennsylvania State University; 1993.
68. Sneath PHA, Sokal RR. Numerical taxonomy: The principles and practice of
numerical classification. W.H.Freeman and company: San Francisco, USA; 1973.
69. Pritchard JK, Stephens M, Donnelly P. Inference of population structure
using multilocus genotype data. Genetics. 2000;155:945–59.
70. Manni F, Guérard E, Heyer E. Geographic patterns of (genetic, morphologic,
linguistic) variation: how barriers can be detected by ‘Monmonier’s
algorithm’. Hum Biol. 2004;76:173–90.
71. Hardy OJ, Vekemans X. SPAGeDi: a versatile computer program to analyse
spatial genetic structure at the individual or population levels. Mol Ecol
Notes. 2002;2:618–20.
72. Hardy OJ, Charbonnel N, Fréville H, Heuertz M. Microsatellite allele sizes: a
simple test to assess their significance on genetic differentiation. Genetics.
2003;163:1467–82.
73. Luikart G, Allendorf FW, Cornuet JM, Sherwin WB. Distortion of allele
frequency distributions provides a test for recent population bottlenecks.
J Hered. 1998;89:238–47.
74. Cornuet JM, Luikart G. Description and power analysis of two tests for
detecting recent population bottlenecks from allele frequency data.
Genetics. 1996;144:2001–14.
75. Piry S, Luikart G, Cornuet JM. Bottleneck: a computer program for detecting
recent reductions in the effective population size using allele frequency
data. J Hered. 1999;90:502–3.
76. Di Rienzo A, Peterson AC, Garza JC, Valdes AM, Slatjin M, Freimer NB.
Mutational processes of simple-sequence repeat loci in human populations.
Proc Natl Acad Sci U S A. 1994;91:3166–70.
77. Luikart G, Sherwin WB, Steele BM, Allendorf FW. Usefulness of molecular
markers for detecting population bottlenecks via monitoring genetic
change. Mol Ecol. 1998;7:963–74.
78. Harley EH. AGARst (version 2.0): A program for calculating allele frequences,
GST and RST from microsatellite data. Cape Town, South Africa: University of
Cape Town; 2001.