Association of ADIPOQ gene with type 2 diabetes and related phenotypes in African American men and women: The Jackson Heart Study
Bạn đang xem bản rút gọn của tài liệu. Xem và tải ngay bản đầy đủ của tài liệu tại đây (484.07 KB, 13 trang )
Davis et al. BMC Genetics (2015) 16:147
DOI 10.1186/s12863-015-0319-4
RESEARCH ARTICLE
Open Access
Association of ADIPOQ gene with type 2
diabetes and related phenotypes in African
American men and women: the Jackson
Heart Study
Sharon K. Davis1*, Ruihua Xu1, Samson Y. Gebreab1, Pia Riestra1, Amadou Gaye1, Rumana J. Khan1,
James G. Wilson2 and Aurelian Bidulescu3
Abstract
Background: African Americans experience disproportionately higher prevalence of type 2 diabetes and related risk
factors. Little research has been done on the association of ADIPOQ gene on type 2 diabetes, plasma adiponectin,
blood glucose, HOMA-IR and body mass index (BMI) in African Americans. The objective of our research was to
assess such associations with selected SNPs. The study included a sample of 3,020 men and women from the
Jackson Heart Study who had ADIPOQ genotyping information. Unadjusted and adjusted regression models with
covariates were used with type 2 diabetes and related phenotypes as the outcome stratified by sex.
Results: There was no association between selected ADIPOQ SNPs with type 2 diabetes, blood glucose, or BMI in
men or women. There was a significant association between variant rs16861205 and lower adiponectin in women
with minor allele A in the fully adjusted model (β(SE) p = −.13(0.05), 0.003). There was also a significant association
with variant rs7627128 and lower HOMA-IR among men with minor allele A in the fully adjusted model (β(SE)
p = −0.74(0.20), 0.0002).
Conclusions: These findings represent new insights regarding the association of ADIPOQ gene and type 2 diabetes
and related phenotypes in African American men and women.
Keywords: Adiponectin, Type 2 diabetes, ADIPOQ gene, African Americans
Background
Type 2 diabetes is more prevalent among African
Americans when compared to most racial/ethnic groups
in the US–even after taking into account socioeconomic
status (SES), prevalence and severity of hypertension
and access to health care [1–4]. African Americans also
have a higher prevalence of elevated A1C hemoglobin,
fasting blood glucose, insulin resistance and obesity
which are risk factors for type 2 diabetes [1, 5, 6]. Adverse behavioral lifestyle, such as poor diet and physical
inactivity, are contributing factors associated with type 2
* Correspondence:
1
National Human Genome Research Institute, Genomics of Metabolic,
Cardiovascular and Inflammatory Disease Branch, Social Epidemiology
Research Unit, 10 Center Drive, Bethesda, MD 20892, USA
Full list of author information is available at the end of the article
diabetes. African Americans have an overall worse lifestyle profile and lower SES [1, 7].
Plasma adiponectin levels are inversely correlated with
type 2 diabetes, blood glucose, insulin resistance and
obesity [8]. Adiponectin is an adipose tissue-specific hormone that is responsible for increasing energy expenditure and lipid catabolism as well as enhancing fatty acid
oxidation and insulin sensitivity [9]. African Americans
present with lower levels of adiponectin and have more
severe type 2 diabetes phenotypes [10]. The adiponectin
gene (ADIPOQ) located at position 3q27 has been
established as the main genetic determinant of plasma
adiponectin levels with an inheritance genetic component between 30 to 70 % [11]. The ADIPOQ gene spans
1.579 kb and contains 3 exons. The translation start
point is located in exon 2 [12]. Several single nucleotide
© 2015 Davis et al. Open Access This article is distributed under the terms of the Creative Commons Attribution 4.0
International License ( which permits unrestricted use, distribution, and
reproduction in any medium, provided you give appropriate credit to the original author(s) and the source, provide a link to
the Creative Commons license, and indicate if changes were made. The Creative Commons Public Domain Dedication waiver
( applies to the data made available in this article, unless otherwise stated.
Davis et al. BMC Genetics (2015) 16:147
polymorphisms (SNPs) located in ADIPOQ have been
associated with adiponectin serum levels, body adiposity
and metabolic alterations making this gene a candidate
for type 2 diabetes and associated traits [12–14]. A limited number of studies have investigated the association
of genetic variants in the adiponectin gene with type 2
diabetes and its related phenotypes in African Americans
[15–19]. Many of these studies have yielded conflicting
results due to small sample size, inclusion of only one
gender, and the confounding effect of unadjusted population structure and behavioral lifestyle factors. The objective of the current study was to assess the association
of SNPs in ADIPOQ with type 2 diabetes, level of plasma
adiponectin, blood glucose, insulin resistance and body
mass index (BMI) in African American men and women
with adjustments for biological, behavioral and socioeconomic factors. We hypothesized that, after adjustments,
the variants related with adiponectin would be associated with type 2 diabetes and its related phenotypes.
Research design and Methods
Study subjects
Cross-sectional data from the Jackson Heart Study (JHS)
was used in this study. The JHS is a single-site,
community-based study of risk factors and causes of heart
disease in adult African Americans. A total of 5,301 noninstitutionalized African Americans aged 21–95 years residing in three contiguous counties surrounding Jackson,
MS were recruited, interviewed and examined by certified
technicians according to standardized protocols at baseline from 2000–2004 [20, 21]. All of the participants gave
written informed consent to participate. The clinic visits
included the collection of data on sociodemographics, anthropometry, survey of medical history, cardiovascular behavioral risk factors and blood and urine for biological
risk factors. The data for this study includes a total of
3,020 men and women with complete DNA and total
plasma adiponectin conducted on serum specimens
collected at baseline from 2000–2004. These 3,020 participants gave consent for genetic analyses and were genotyped separately in the CARe consortium in 2006 using
Affymetrix 6.0 platform [22]. This study was approved
by the Institutional Review Board of the National Institutes of Health and the study protocol was approved by
the Institutional Review Boards of the participating JHS
institutions, including the University of Mississippi
Medical Center, Jackson State University and Tougaloo
College.
Outcome phenotypes
The main outcomes of the study were type 2 diabetes,
plasma adiponectin, blood glucose, homeostatis model
assessment–insulin resistance (HOMA-IR), and BMI.
Type 2 diabetes was defined as fasting plasma glucose
Page 2 of 13
≥ 126 mg/dL or self-reported use of insulin or oral
hypoglycemic medications [23]. Adiponectin measurement
was derived from venous blood samples drawn from each
participant after more than 8 h of fasting. Vials of serum
were stored at the JHS central repository in Minneapolis,
MN at −80 °C until assayed. Adiponectin concentration
was measure as total plasma adiponectin by ELISA system
(R & D Systems; Minneapolis, MN). The inter-assay coefficient of variation was 8.8 %. No biological degrading has
been described using stored specimens, indicating a high
validity for measurement [24]. Fasting plasma glucose and
fasting insulin were measured using standard laboratory
techniques. The HOMA-IR was calculated as [insulin
(microunits per milliliter) x fasting blood glucose (millimoles per liter)]/22.5. Insulin resistance was defined as
a HOMA-IR in the highest quartile of its distribution
[25]. Body mass index was based on standing height
and weight measured on a balance scale in lightweight clothing without shoes or constricting garments with weight recorded to the nearest 0.5 kg and
calculated as weight in kilograms by height in meters
squared (kg/m2).
Primary predictor: SNP selection genotyping and
imputation
A candidate gene approach for the selection of the genetic variants was used. The tagging approach was applied
to the entire set of common genetic variants in the ADIPOQ gene (5kb upstream of the first exon and 5kb
downstream of the last exon of the gene) with minor
allele frequency (MAF) ≥1 % in Yoruba population (YRI)
from the International HapMap Project [26]. SNPs were
chosen based on their ability to capture genetic information for the YRI population. Tagging SNPs were selected
by the Tagger algorithm available through Haploview
using a pairwise SNP selection and captured an interSNP r2 value of > 0.80 for known polymorphisms in the
region. This process resulted in a selection of 15 tagging
SNPs for ADIPOQ with a mean r2 of 0.969 of the selected SNPs. This selection captures a high degree (over
95 %) of the known variability in this gene. IMPUTE2
software and reference phased data from the 1000G project were used for genotype imputation to infer ADIPOQ
SNPs genotypes [27, 28]. SNP-level quality control
metrics were applied prior to downstream analyses and
included the following: call rate ≥ 95 %, MAF ≥1 %,
Hardy-Weinberg equilibrium (HWE) Bonferroni correction = p ≥ 0.003, and quality measures for imputed
SNPs of r2 ≥ 0.3. Of the 15 SNPS, 3 were excluded
because they were not available in the JHS data, and
an additional 4 were excluded because they that did
not meet the HWE criteria-resulting in eight SNPs
for subsequent analyses.
Davis et al. BMC Genetics (2015) 16:147
Covariates
Information on key covariates, which are known risk
factors for type 2 diabetes and related phenotypes, was
obtained from baseline examination. Age was derived
from self-reported date-of-birth. Proportion of European
Ancestry (PEA) for each participant was calculated using
HAPMIX supported by the CARe consortium [22, 29–31].
The proportion of global European ancestry estimates
for the study has a median of 16.0 % and interquartile range of 15 %.
Biological risk factor measures included low-density
lipoprotein (LDL), high-density lipoprotein (HDL), triglyceride, C-reactive protein (CRP), plasma leptin, blood
glucose, and HOMA-IR. Behavioral risk factors included
smoking status, physical activity, BMI, and alcohol consumption. Fasting LDL, HDL, triglyceride and blood glucose were assessed using standard laboratory techniques.
Fasting CRP was measured using immunturbidimetric
CRP-Latex assay from Kamiya Biomedical Company following manufacturer’s high-sensitivity protocol [32]. The
inter-assay coefficients of variation on control samples
repeated in each assay were 4.5 and 4.4 % at CRP concentration of 0.45 and 1.56 mg/dL, respectively. The reliability coefficient for masked quality-control replicates
was 0.95 for the CRP assay. Fasting leptin was collected
via venous blood samples drawn from each participant
and analyzed with Human Leptin PIA kit (LINCO Research, St Charles, MI, USA) [33]. Acceptable coefficient
of variation was 10 % [33]. Insulin resistance status was
estimated with the HOMA as previously described [25].
Smoking status was defined as current smoker and nonsmoker. Physical activity was assessed with a physical activity survey instrument comprised of 4 domains (active
living, work, home and garden, sport and exercise). A
total score was the sum of these domains with a maximum of 24. A higher score indicates a higher level of
total physical activity. The calculation of BMI was previously described. Alcohol consumption status was defined
as “yes” if participant reported ever consuming alcohol
and “no” for those reporting never consuming alcohol.
Socioeconomic status (SES) was based on self-reported
level of educational attainment - < high school, high
school or graduate education equivalency diploma
GED), some college or vocational school, bachelors or
associate degree, post-college experience.
Statistical analysis
All analyses were stratified by sex because of the differential prevalence of phenotypes. Baseline characteristics
of the study sample were conducted by sex using t-test
for continuous variables and chi-square for categorical
variables. Hardy-Weinberg equilibrium tests for each of
the ADIPOQ SNPs were analyzed using chi-square test.
We then used logistic regression to assess the
Page 3 of 13
association between type 2 diabetes and each ADIPOQ
SNP and linear regression was used to examine the associations of each ADIPOQ SNP with plasma, adiponectin,
blood glucose, HOMA-IR, and BMI. Six sequential cumulative models, stratified by sex, were fitted for each
phenotype with minor allele as the reference. Model 1
included each SNP as the primary predictor (unadjusted), model 2 included age, model 3 included PEA,
model 4 included biological risk factors (LDL cholesterol, HDL cholesterol, triglyceride, CRP, plasma leptin),
model 5 included behavioral risk factors (smoking status,
physical activity, BMI, alcohol consumption), and model
6 included a fully adjusted model with SES based on
level of educational attainment. Age, PEA, LDL cholesterol, HDL cholesterol, triglyceride, CRP, plasma leptin,
blood glucose, BMI, physical activity and HOMA-IR
were entered as continuous variables. Smoking status,
alcohol consumption status, and SES were entered as
categorical variables. Adiponectin, blood glucose, HOMAIR and BMI were log transformed to obtain better approximations of the normal distribution prior to analysis.
Multiple comparisons were controlled using Bonferroni
correction which was defined a priori by dividing the
significance level α = 0.05 by the number of selected ADIPOQ SNPS (0.05/8 = 0.00625) [34]. Therefore, a p-value
threshold of 0.006 was used to determine statistical significance. Power analyses for the tests of association were
computed using the minor allele frequencies and mean
values of serum, adiponectin levels from the JHS and the
effect sizes originally reported [34]. Assuming a p value of
0.001 and a power of 80 %, we will require 845 subjects
per outcome in order to detect a 2 % of variation in adiponectin levels. Analyses were conducted using SAS version
9.3 [35]. Haplotypes were analyzed to identify haplotype
blocks using linear regression in PLINK. Haplotypes with
an estimated frequency <5 % were excluded from the analysis. Global p-values were obtained by omnibus tests
jointly estimating all haplotype effects. Linear and logistic
regression analysis was used for the individual haplotype
association.
Results
The sex-stratified baseline characteristics of the study
population are presented in Table 1. Approximately 38 %
of the sample was comprised of men and 62 % women.
Women were significantly older and had a lower proportion of European ancestry (p <0.02 and 0.005, respectively). They also had differential levels of education
compared to men (p <0.04). Behavioral risk factors were
distributed differently between men and women. A higher
proportion of men were current smokers, consumed alcohol and were more physically active (p <0.0001 for all).
Women had a higher mean BMI (p <0.0001). A differential pattern was also observed regarding biological risk
Davis et al. BMC Genetics (2015) 16:147
Page 4 of 13
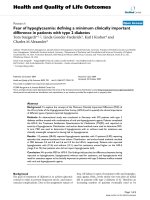
Table 1 Characteristics of men and women in the Jackson Heart Study, N = 3020
Men38.15 % (N = 1,152)
Women61.85 % (N = 1,868)
P-value*
53.96 ± 13.01
55.05 ± 12.73
0.02
0.18 ± 0.09
0.17 ± 0.08 (1283)
0.005
38.13 %
61.87 %
Demographic Factors (N)
Age (mean ± std.)
┼
PEA
(mean ± std.)
Education, %
16.74 %
16.60 %
High school + GED±
19.18 %
21.49 %
Some college + vocational school
23.98 %
22.89 %
Bachelors + associate degree
25.02 %
21.28 %
Post-college
15.08 %
17.73 %
0.04
Behavioral Factors (N)
Smoking Status, % Yes
18.05 %
10.99 %
<0.0001
BMI§ kg/m2 (Mean ± std.)
30.01 ± 6.31
33.26 ± 7.81
<0.0001
Physical Activity Score (Mean ± std.)
8.55 ± 2.55
8.15 ± 2.58
<0.0001
Alcohol Consumption, % (N) Yes
59.20 %
40.30 %
<0.0001
Systolic blood pressure, mmHg
127.8 ± 17.76
126.3 ± 18.34
0.03
Diastolic blood pressure, mmHg
81.53 ± 10.59
77.46 ± 10.30
<.0001
Total Cholesterol,mg/dl (Mean ± std.)
196.6 ± 40.89
199.4 ± 40.36
0.07
Biological Factors (N)
║
LDL
Cholesterol, mg/dl (Mean ± std.)
127.9 ± 37.15
124.8 ± 37.12
0.03
HDL¶ Cholesterol, mg/dl (Mean ± std.)
45.69 ± 12.79
54.66 ± 14.71
<0.0001
Fasting Triglyceride Level, mg/dl, (Mean ± std.)
117.7 ± 100.3
101.3 ± 64.46
<0.0001
Plasma Adiponectin, ug/mL (Mean ± std.)
4.08 ± 3.38
6.04 ± 4.46
<0.0001
Plasma Leptin, ng/mL (Mean ± std.)
11.81 ± 11.12
38.53 ± 24.80
<0.0001
Blood Glucose mg/dL (Mean ± std.)
100.9 ± 33.83
100.5 ± 33.80
0.76
CRP , mg/dL (Mean ± std.)
0.37 ± 1.13
0.63 ± 0.89
<.0001
HOMA-IR** (Insulin resistance) (Mean ± std.)
3.49 ± 2.17
3.85 ± 2.56
0.0004
Type II diabetes, %
17.12 %
20.87 %
0.01
Hypertension, %
65.55 %
60.84 %
0.009
#
*
Two-sample t-test for continuous variables and chi-square for categorical variables; significance established as
P ≤ 0.05; std standard deviation
PEA Percent European ancestry
±
GED Graduate equivalency diploma
╪
BMI Body mass index
Đ
LDL Low density lipoprotein
HDL High density lipoprotein
ả
CRP C-reactive protein
**
HOMA-IR Homeostasis model assessment – insulin resistance
┼
factors. Systolic blood pressure, DBL, LDL cholesterol,
and triglyceride were higher among men (p < 0.03, 0.0001,
0.03, 0.0001, 0.0001, respectively). Women had higher
HDL cholesterol, plasma adiponectin, leptin, CRP, and
HOMA-IR (p < 0.0001, 0.0001, 0.0001, 0.0001, 0.0004, respectively). Additionally, a higher proportion of women
had type 2 diabetes and hypertension (p < 0.01 and 0.009,
respectively).
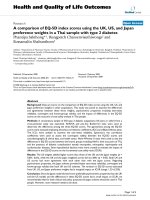
Table 2 shows the characteristics, minor allele frequencies
and HWE p-values for the selected ADIPOQ SNPs. Minor
allele frequencies ranged from 6 to 43 %. All of the SNPs
included in the subsequent analysis conformed to HWE.
Association between ADIPOQ SNPs and phenotypes
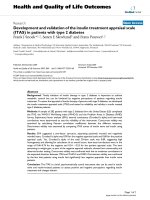
Results are presented in Table 3. No ADIPOQ variant
was found to be associated with type 2 diabetes in men
or women in the crude or adjusted models. Results in
Table 4 show no association between any of the variants
and plasma adiponectin among men. However, two variants were significantly associated in women. ADIPOQ
SNP rs16861205 was significantly associated with adiponectin in women even after adjusting for age, PEA, biological and behavioral risk factors and SES (in fully
adjusted model 6: ß (SE) = −0.13(0.05), p = 0.003). ADIPOQ SNP rs1501299 was only significant in the crude
Davis et al. BMC Genetics (2015) 16:147
Page 5 of 13
Table 2 Characteristics of selected ADIPOQ SNPs in the adiponectin gene
ADIPOQ SNP
Location on chromosome 3*
Gene region
Tagging population
║
r2┼
Major/Minor allele
MAF╪
HWEP-value§
rs16861205
186561634
Intron 1
YRI
0.99357
G/A
0.21245
0.0312
rs12495941
186568180
Intron 1
YRI
0.61244
G/T
0.35333
0.3807
rs7627128
186568799
Intron 1
YRI
0.68362
C/A
0.15217
0.7607
rs9877202
186569607
Intron 1
YRI
0.71281
A/G
0.13273
0.697
rs2036373
186570191
Intron 1
YRI
0.98257
T/G
0.06391
0.9634
rs1501299
186571123
Intron 2
YRI
0.98519
G/T
0.35484
0.5123
rs3821799
186571486
Intron 2
YRI
0.99954
T/C
0.43207
0.1744
rs9842733
186575482
3′-UTR
YRI
0.92664
A/T
0.10153
0.5974
*
position based on NCBI Build 36
r2 refers to the measurement of SNPs imputation quality
MAF Major allele frequency
§
HWE Hardy-Weinberg equilibrium; P-value calculated based on chi-square
║
YRI Yoruba in Ibadan, Nigeria from HAPMAP
┼
╪
model and the one adjusted for age. There were no association with the ADIPOQ SNPs and blood glucose in men
or women as indicated in Table 5. Two variants were observed to be significantly associated with HOMA-IR in
men. ADIPOQ SNP rs12495941 was significantly associated after adjusting for age, PEA, biological risk factors
and behavioral risk factors, but the association attenuated
and became marginally non-significant after adjusting for
SES (model 6: ß (SE) = 0.40 (0.15), p =0.0086). However,
the association between ADIPOQ SNP rs7627128
remained significant even when fully adjusted for SES
(model 6: ß (SE) = −0.73 (0.20), p = 0.0003). Table 6 shows
one variant was associated with HOMA-IR in women.
ADIPOQ SNP rs1501299 was only significant in the crude
and age adjusted models (p = 0.003 and 0.003, respectively). Table 7 reveals that there was no association between any of the variants and BMI in men or women.
Association between haplotypes with HOMA-IR and
adiponectin
SNPs that were significantly associated with HOMA-IR
and adiponectin (rs7627128 and rs16861205) were
tested. The haplotype analysis did not reveal any significant association after controlling for covariates (data not
shown).
Discussion
Selected ADIPOQ SNPs were analyzed to assess their association with type 2 diabetes and related phenotypes in
a large well characterized sample of African Americans.
Our findings show the ADIPOQ variant rs16861205
(MAF = 0.21) was significantly associated with a lower
level of plasma adiponectin in women with minor allele
A than none-carriers. This association was attenuated
after adjusting for PEA and biological risk factors but
persisted when fully adjusted for age, PEA, biological
and behavioral risk factors and SES. These findings suggest an etiological association between genetic variant
rs16861205 and lower levels of adiponectin observed in
African American women either directly or through
another variant that is linked to it. Gender can be considered a measured environmental risk factor which
incorporates established anatomical, physiological, and
behavioral differences between genders. The gender
dismorphism in adiponectin levels is well established
starting at puberty - possibly influenced by sex hormones which might explain our observation of lower
adiponectin in women [32]. Our findings of observed
lower levels of adiponectin in women are consistent with
other research that similarly document lower levels of
adiponectin in African American women when compared to other race/ethnic women [32, 36]. Cohen et al.,
for instance, observed a lower level of serum adiponectin
in African American women when compared to white
women [36]. However, unlike our finding, they did not
find any associations between adiponectin and the SNPs
in the adiponectin gene that were assessed. This observation may be due to a smaller sample size. ADIPOQ
variant rs1501299 in women with minor allele T also
had lower plasma adiponectin after adjusting for age,
but this association disappeared after adjusting for PEA,
biological and behavioral risk factors and SES.
Our findings also revealed that the ADIPOQ SNP
rs12495941 (MAF = 0.35) was significantly associated
with higher HOMA-IR among men with carriers of the
minor allele T suggesting perhaps a relationship between
the variant and likelihood of type 2 diabetes. The
rs1249541variant is located in the intron 1 region not involved in any putative transcription factor binding site
which means this SNP is a noncoding variant without
obvious regulatory function. Thus, this SNP may be in
linkage disequilibrium with another functional variant in
African Americans [15]. We attempted to predict in
sylico the potential functionality of the tagged SNPS
with software AliBaba in order to test their role as
potential transcriptional regulators of adiponectin
Men, n = 1,133
SNPs
Alleles
Model 1
Model 2
Model 4
Model 3Đ
Model 5ả
Model 6#
OR (95 % CI)
P-value
OR (95 % CI)
P-value
OR (95 % CI)
P-value
OR (95 % CI)
P-value
OR (95 % CI)
P-value
OR (95 % CI)
P-value
rs16861205
G/A
1.37 (0.89,2.10)
0.1532
1.44 (0.92,2.23)
0.1075
1.93 (1.01,3.53)
0.0322
1.52 (0.78,2.96)
0.2154
1.49 (0.75,2.96)
0.2517
1.51 (0.75,3.06)
0.2502
rs12495941
G/T
0.47 (0.19,1.14)
0.0932
0.52 (0.21,1.29)
0.1560
0.33 (0.11,0.99)
0.0489
0.54 (0.09,3.45)
0.5182
0.54 (0.08,3.51)
0.5149
0.42 (0.06,2.97)
0.3833
rs7627128
C/A
0.82 (0.19,3.52)
0.7895
1.06 (0.24,4.75)
0.9434
3.18 (0.18,56.0)
0.4301
8.35 (0.18,442)
0.2696
11.01 (0.19,621)
0.2413
12.55 (0.21,737)
0.2234
rs9877202
A/G
0.97 (0.61,1.54)
0.8969
0.96 (0.60,1.54)
0.8642
0.95 (0.54,1.68)
0.8648
0.98 (0.50,1.90)
0.9477
0.80 (0.40,1.60)
0.5230
0.82 (0.41,1.66)
0.5828
rs2036373
T/G
0.20 (0.01,5.07)
0.3303
0.13 (0.01,3.63)
0.2304
0.03 (<0.001,1.4)
0.0727
0.025 (<0.001, 1.12)
0.0571
0.015 (<0.001,0.79)
0.0376
0.018 (<0.001,0.964
0.0479
rs1501299
G/T
1.09 (0.66,1.82)
0.7310
1.10 (0.66,1.86)
0.7111
0.93 (0.49,1.76)
0.8240
0.73 (0.36,1.45)
0.3658
0.68 (0.34,1.39)
0.2913
0.71 (0.35,1.45)
0.3413
rs3821799
T/C
1.06 (0.77,1.44)
0.7308
1.02 (0.75,1.41)
0.8814
1.01 (0.72,1.62)
0.7151
1.00 (0.62,1.61)
0.9976
1.02 (0.62,1.69)
0.9313
0.96 (0.57,1.61)
0.8762
rs9842733
A/T
3.96 (0.43,36)
0.2224
4.40 (0.44,43.89)
0.2073
26.62 (0.174,>999)
0.2009
775 (0.009,>999)
0.2526
739 (0.008,>999)
0.2571
344 (0.008,>999)
0.2835
Davis et al. BMC Genetics (2015) 16:147
Table 3 Association between Type 2 diabetes and ADIPOQ SNPs in men and women in the Jackson Heart Study, N = 2,978*
Women, n = 1,845
Model 2╪
Model 1┼
Model 4║
Model 3Đ
Model 5ả
Model 6#
SNPs
Alleles
rs16861205
G/A
rs12495941
G/T
1.03 (0.54,1.97)
0.9361
1.15 (0.60,2.21)
0.6819
1.89 (0.58,6.17)
0.2909
2.85 (0.52,15.5)
0.2259
2.62 (0.47,14.5)
0.2703
3.15 (0.56,17.75)
0.1935
rs7627128
C/A
0.57 (0.20,1.66)
0.2993
0.73 (0.24,2.20)
0.5756
0.67 (0.14,3.17)
0.6127
1.58 (0.16,15.7)
0.6985
1.05 (0.10,11.1)
0.9705
1.07 (0.10,11.93)
0.9562
rs9877202
A/G
0.83 (0.61,1.15)
0.2601
0.81 (0.59,1.12)
0.1989
0.91 (0.59,1.40)
0.6607
0.94 (0.55,1.58)
0.8034
1.05 (0.58,1.88)
0.8847
1.04 (0.58,1.88)
0.8863
rs2036373
T/G
2.56 (0.09,75)
0.5870
1.56 (0.05,51)
0.8028
0.95 (0.03,28)
0.9781
2.48 (0.02,255)
0.7004
1.10 (0.01,140)
0.9685
1.17 (0.01,141)
0.9484
rs1501299
G/T
1.50 (0.97,2.30)
0.0718
1.41 (0.91,2.2)
0.1237
1.33 (0.78,2.28)
0.2949
1.44 (0.75,2.76)
0.2766
2.34 (1.08, 5.06)
0.0309
2.46 (1.13, 5.36)
0.0232
rs3821799
T/C
0.93 (0.75,1.17)
0.5489
0.93 (0.74,1.17)
0.5445
0.84 (0.63,1.12)
0.2347
0.85 (0.60,1.19)
0.3359
0.83 (0.57,1.19)
0.3074
0.82 (0.57,1.19)
0.3018
rs9842733
A/T
0.71 (0.30,1.67)
0.4362
0.85 (0.36,2.04)
0.7187
0.76 (0.26,2.17)
0.6019
0.78 (0.23,2.62)
0.6816
0.58 (0.15,2.26)
0.4308
0.59 (0.15,2.33)
0.4529
OR (95 % CI)
P-value
OR (95 % CI)
P-value
OR (95 % CI)
P-value
OR (95 % CI)
P-value
OR (95 % CI)
P-value
OR (95 % CI)
P-value
1.12 (0.80,1.57)
0.5021
1.15 (0.85,1.56)
0.3648
1.15 (0.78,1.68)
0.4872
1.21 (0.77,1.89)
0.4096
1.13 (0.70,1.81)
0.6175
1.17 (0.72,1.89)
0.5274
* N represents 42 missing values for type 2 diabetes
┼
Model 1: crude
╪
Model 2: adjusted for age
§
Model 3: adjusted for age, PEA
║
Model 4: adjusted for age, PEA, LDL, HDL, triglyceride, CRP, plasma leptin
¶
Model 5: adjusted for age, PEA, LDL, HDL, triglyceride, CRP, plasma leptin, smoking status, physical activity score, BMI, alcohol consumption status
#
Model 6: adjusted for age, PEA, LDL, HDL, triglyceride, CRP, plasma leptin,, smoking status, physical activity score, BMI, alcohol consumption status, socioeconomic status (education level)
Two-tailed level of significance was established as P ≤ 0.006
Page 6 of 13
Men, n = 1,131
SNPs
Alleles
Model 1┼
Model 2╪
Model 4║
β (SE)
P-value
β (SE)
P-value
β (SE)
P-value
β (SE)
P-value
(SE)
P-value
(SE)
P-value
rs16861205
G/A
0.10(0.05)
0.0578
0.09(0.05)
0.0652
0.14(0.06)
0.0124
0.09(0.05)
0.1075
0.10(0.06)
0.0603
0.10(0.06)
0.0914
Model 3Đ
Model 5ả
Model 6#
rs12495941
G/T
0.12(0.14)
0.3822
0.08(0.14)
0.5438
0.12(0.16)
0.4513
0.04(0.17)
0.8283
0.01(0.18)
0.9377
0.03(0.18)
0.8546
rs7627128
C/A
0.19(0.20)
0.3345
0.12(0.19)
0.5436
0.13(0.26)
0.6145
0.25(0.24)
0.2962
0.30(0.24)
0.2086
0.31(0.24)
0.1968
rs9877202
A/G
0.08(0.06)
0.1709
0.08(0.06)
0.1652
0.10(0.06)
0.1192
0.06(0.06)
0.3117
0.09(0.06)
0.1764
0.10(0.07)
0.1207
rs2036373
T/G
1.12(0.52)
0.0335
1.16(0.51)
0.0240
0.92(0.57)
0.1080
0.14(0.56)
0.7934
0.47(0.60)
0.4295
0.52(0.59)
0.3827
rs1501299
G/T
0.01(0.06)
0.9324
0.01(0.06)
0.8870
0.06(0.07)
0.410
0.12(0.06)
0.0719
0.13(0.07)
0.0533
0.14(0.07)
0.0491
rs3821799
T/C
0.04(0.04)
0.3710
0.03(0.04)
0.4916
0.02(0.04)
0.6712
0.007(0.04)
0.8744
0.01(0.04)
0.9014
0.01(0.04)
0.8580
rs9842733
A/T
0.17(0.20)
0.3862
0.19(0.19)
0.3223
0.33(0.22)
0.1436
0.20(0.20)
0.3165
0.32(0.24)
0.1378
0.33(0.21)
0.1284
Davis et al. BMC Genetics (2015) 16:147
Table 4 Association between plasma adiponectin level and ADIPOQ SNPs among men and women in the Jackson Heart Study,
N = 2,968*
Women, n = 1,837
SNPs
Alleles
Model 1┼
β (SE)
Model 2╪
P-value
β (SE)
Model 4║
Model 3Đ
P-value
(SE)
P-value
(SE)
Model 5ả
P-value
(SE)
Model 6#
P-value
(SE)
P-value
rs16861205
G/A
0.14(0.04)
0.0001
0.14(0.04)
0.0002
0.11(0.04)
0.0089
0.10(0.04)
0.017
0.13(0.05)
0.006
0.13(0.05)
0.003
rs12495941
G/T
0.09(0.08)
0.3047
0.12(0.08)
0.1551
0.008(0.12)
0.9416
0.06(0.10)
0.5292
0.07(0.11)
0.5227
0.07(0.11)
0.5428
rs7627128
C/A
0.06(0.15)
0.6956
0.01(0.15)
0.9514
0.15(0.20)
0.4585
0.32(0.19)
0.0874
0.58(0.23)
0.0117
0.61(0.23)
0.0084
rs9877202
A/G
0.05(0.04)
0.2295
0.05(0.04)
0.1939
0.05(0.05)
0.3580
0.03(0.05)
0.5442
0.07(0.05)
0.1939
0.07(0.06)
0.1789
rs2036373
T/G
0.21(0.37)
0.5682
0.10(0.36)
0.7810
0.23(0.37)
0.5343
0.25(0.33)
0.4459
0.43(0.39)
0.2669
0.42(0.39)
0.2745
rs1501299
G/T
0.14(0.05)
0.004
0.15(0.05)
0.001
0.13(0.06)
0.0258
0.03(0.05)
0.510
0.12(0.06)
0.0472
0.12(0.06)
0.0468
rs3821799
T/C
0.03(0.03)
0.2802
0.03(0.03)
0.2768
0.02(0.03)
0.4649
0.02(0.03)
0.5966
0.02(0.04)
0.5226
0.03(0.04)
0.4464
rs9842733
A/T
0.15(0.12)
0.2107
0.10(0.12)
0.3741
0.05(0.14)
0.6928
0.02(0.14)
0.9038
0.01(0.16)
0.9561
0.005(0.16)
0.9748
*
Page 7 of 13
N represents 52 missing values for adiponectin
┼
Model 1: crude
╪
Model 2: adjusted for age
§
Model 3: adjusted for age, PEA
║
Model 4: adjusted for age, PEA, LDL, HDL, triglyceride, CRP, plasma leptin, blood glucose, HOMA-IR
¶
Model 5: adjusted for age, PEA, LDL, HDL, triglyceride, CRP, plasma leptin, blood glucose, HOMA-IR, smoking status, physical activity score, BMI, alcohol consumption status
#
Model 6: adjusted for age, PEA, LDL, HDL, triglyceride, CRP, plasma leptin, blood glucose, HOMA-IR, smoking status, physical activity score, BMI, alcohol consumption status, socioeconomic status (education level)
Two-tailed level of significance established as P ≤ 0.006
Men, n = 1,071
SNPs
Alleles
Model 1┼
Model 2╪
Model 4║
Model 3§
β (SE)
P-value
β (SE)
P-value
β (SE)
P-value
β (SE)
Model 5¶
P-value
β (SE)
Model 6#
P-value
β (SE)
P-value
rs16861205
G/A
0.01(0.02)
0.4877
0.02(0.02)
0.3755
0.03(0.02)
0.2168
0.01(0.02)
0.6174
0.004(0.02)
0.8347
0.005(0.02)
0.8140
rs12495941
G/T
0.03(0.05)
0.5088
0.04(0.04)
0.3695
0.03(0.06)
0.6776
−0.001(0.06)
0.9887
−0.02(0.07)
0.7920
−0.03(0.07)
0.6549
rs7627128
C/A
−0.05(0.07)
0.4997
−0.03(0.001)
0.7078
−0.01(0.09)
0.9074
0.02(0.09)
0.8449
0.03(0.09)
0.7506
0.04(0.09)
0.6765
rs9877202
A/G
−0.01(0.02)
0.7960
−0.01(0.02)
0.7940
−0.01(0.02)
0.6964
−0.004(0.02)
0.8658
−0.01(0.02)
0.6983
−0.01(0.02)
0.5648
rs2036373
T/G
−0.19(0.19)
0.3200
−0.20(0.18)
0.2764
−0.38(0.21)
0.0694
−0.38(0.20)
0.0489
−0.46(0.21)
0.0262
−0.45(0.20)
0.0289
rs1501299
G/T
−0.01(0.02)
0.6674
−0.01(0.02)
0.6454
−0.001(0.03)
0.9726
−0.01(0.02)
0.6306
−0.01(0.03)
0.6235
−0.01(0.03)
0.6798
rs3821799
T/C
0.005(0.01)
0.7486
0.002(0.01)
0.8970
0.0004(0.02)
0.9764
0.01(0.02)
0.6961
0.01(0.02)
0.6086
0.01(0.02)
0.6701
rs9842733
A/T
0.09(0.07)
0.2152
0.08(0.07)
0.2207
0.06(0.08)
0.4388
0.04(0.08)
0.6100
0.05(0.08)
0.5668
0.05(0.08)
0.5539
Davis et al. BMC Genetics (2015) 16:147
Table 5 Association between blood glucose and ADIPOQ SNPs among men and women in the Jackson Heart Study, N = 2,800*
Women, n = 1,729
SNPs
Alleles
Model 1┼
Model 2╪
Model 4║
β (SE)
P-value
β (SE)
P-value
β (SE)
P-value
(SE)
P-value
(SE)
P-value
(SE)
P-value
rs16861205
G/A
0.02(0.02)
0.1881
0.004(0.01)
0.1790
0.01(0.02)
0.3971
0.02(0.02)
0.1640
0.02(0.02)
0.2073
0.02(0.02)
0.1810
rs12495941
G/T
0.003(0.03)
0.9296
0.01(0.03)
0.7260
0.04(0.04)
0.4129
0.02(0.04)
0.6438
0.01(0.04)
0.7305
0.01(0.04)
0.7427
rs7627128
C/A
0.01(0.06)
0.8482
0.02(0.06)
0.7974
0.08(0.08)
0.2949
0.11(0.08)
0.1639
0.10(0.08)
0.2094
0.09(0.08)
0.2248
Model 3Đ
Model 5ả
Model 6#
rs9877202
A/G
0.03(0.02)
0.0672
0.04(0.02)
0.0338
0.01(0.02)
0.4711
0.02(0.02)
0.2251
0.02(0.02)
0.3394
0.02(0.02)
0.3012
rs2036373
T/G
0.07(0.14)
0.6170
0.03(0.14)
0.8356
0.01(0.14)
0.9198
0.01(0.13)
0.9309
0.03(0.16)
0.8586
0.03(0.16)
0.8422
rs1501299
G/T
0.02(0.02)
0.3343
0.02(0.02)
0.4112
0.002(0.02)
0.9379
0.01(0.02)
0.5848
0.01(0.02)
0.7571
0.01(0.02)
0.7473
rs3821799
T/C
0.01(0.01)
0.4056
0.01(0.01)
0.4642
0.003(0.01)
0.8430
0.01(0.01)
0.6920
0.01(0.01)
0.6938
0.01(0.01)
0.6240
rs9842733
A/T
0.02(0.05)
0.6652
0.03(0.05)
0.4631
0.02(0.05)
0.7694
0.04(0.05)
0.4431
0.02(0.05)
0.6909
0.03(0.05)
0.6373
*
N represents 220 missing values for blood glucose
┼
Model 1: crude
╪
Model 2: adjusted for age
§
Model 3: adjusted for age, PEA
║
Model 4: adjusted for age, PEA, LDL, HDL, triglyceride, CRP, plasma leptin
¶
Model 5: adjusted for age, PEA, LDL, HDL, triglyceride, CRP, plasma leptin, smoking status, physical activity score, BMI, alcohol consumption status
#
Model 6: adjusted for age, PEA, LDL, HDL, triglyceride, CRP, plasma leptin,, smoking status, physical activity score, BMI, alcohol consumption status, socioeconomic status (education level)
Two-tailed level of significance was established as P ≤ 0.006
Page 8 of 13
Men, n = 920
SNPs
Alleles
Model 1┼
β (SE)
Model 2╪
P-value
β (SE)
Model 4║
Model 3§
P-value
β (SE)
P-value
β (SE)
Model 5¶
P-value
β (SE)
Model 6#
P-value
β (SE)
P-value
rs16861205
G/A
0.04(0.05)
0.3782
0.04(0.05)
0.3939
0.04(0.06)
0.4916
−0.03(0.05)
0.5570
−0.04(0.05)
0.4126
−0.05(0.05)
0.3641
rs12495941
G/T
0.43(0.14)
0.001
0.43(0.14)
0.002
0.76(0.18)
<.0001
0.41(0.15)
0.004
0.42(0.15)
0.005
0.40(0.15)
0.0086
rs7627128
C/A
−0.98(0.20)
<.0001
−0.99(0.20)
<.0001
−0.13(0.26)
<.0001
−0.78(0.20)
0.0001
−0.74(0.20)
0.0002
−0.73(0.20)
0.0003
rs9877202
A/G
−0.002(0.06)
0.9784
−0.001(0.06)
0.9913
−0.02(0.07)
0.7451
−0.03(0.05)
0.5270
−0.04(0.06)
0.4308
−0.05(0.06)
0.3797
rs2036373
T/G
0.42(0.51)
0.4158
0.42(0.51)
0.4102
0.06(0.63)
0.9262
−0.15(0.49)
0.7626
−0.05(0.52)
0.9197
−0.07(0.52)
0.8889
rs1501299
G/T
−0.05(0.06)
0.3976
−0.05(0.06)
0.3886
−0.03(0.07)
0.7110
−0.02(0.06)
0.7035
−0.04(0.06)
0.5522
−0.03(0.06)
0.6309
rs3821799
T/C
0.03(0.04)
0.4645
0.03(0.04)
0.4422
0.05(0.05)
0.2534
0.08(0.04)
0.0258
0.07(0.04)
0.0638
0.07(0.04)
0.0608
rs9842733
A/T
0.11(0.18)
0.5344
0.12(0.18)
0.5306
0.17(0.26)
0.4427
0.18(0.18)
0.3151
0.07(0.19)
0.6947
0.07(0.19)
0.6955
Davis et al. BMC Genetics (2015) 16:147
Table 6 Association between HOMA-IR and ADIPOQ SNPs among men and women in the Jackson Heart Study, N = 2,347*
Women, n = 1,427
Model 1
Model 2
Model 4
Model 3Đ
Model 5ả
Model 6#
SNPs
Alleles
(SE)
P-value
(SE)
P-value
(SE)
P-value
(SE)
P-value
(SE)
P-value
(SE)
P-value
rs16861205
G/A
0.07(0.04)
0.0795
0.07(0.04)
0.0776
0.06(0.04)
0.1816
0.07(0.04)
0.0491
0.07(0.04)
0.0594
0.07(0.04)
0.0624
rs12495941
G/T
0.11(0.08)
0.1814
0.12(0.08)
0.1510
0.11(0.11)
0.3332
0.01(0.10)
0.8898
0.01(0.10)
0.9282
0.004(0.10)
0.9626
rs7627128
C/A
0.12(0.16)
0.4349
0.11(0.16)
0.4908
0.001(0.21)
0.9959
0.08(0.17)
0.6421
0.05(0.17)
0.7616
0.05(0.17)
0.7874
rs9877202
A/G
0.01(0.05)
0.8391
0.01(0.05)
0.7704
0.05(0.05)
0.3250
0.01(0.04)
0.8426
0.01(0.05)
0.7866
0.01(0.05)
0.8183
rs2036373
T/G
0.01(0.34)
0.9876
0.02(0.34)
0.9438
0.05(0.36)
0.8922
0.002(0.3)
0.9933
0.11(0.36)
0.7577
0.10(0.36)
0.7696
rs1501299
G/T
0.15(0.05)
0.003
0.14(0.05)
0.003
0.13(0.06)
0.0226
0.06(0.05)
0.2300
0.08(0.05)
0.0996
0.08(0.05)
0.1006
rs3821799
T/C
0.01(0.03)
0.8004
0.01(0.03)
0.7921
0.01(0.04)
0.7620
0.02(0.03)
0.5097
0.03(0.03)
0.3304
0.03(0.03)
0.3290
rs9842733
A/T
0.30(0.16)
0.0176
0.31(0.13)
0.0139
0.29(0.15)
0.0539
0.33(0.13)
0.0098
0.27(0.13)
0.0385
0.28(0.13)
0.0337
*
N represents 673 missing values for HOMA-IR
┼
Model 1: crude
╪
Model 2: adjusted for age
§
Model 3: adjusted for age, PEA
║
Model 4: adjusted for age, PEA, LDL, HDL, triglyceride, CRP, plasma leptin
¶
Model 5: adjusted for age, PEA, LDL, HDL, triglyceride, CRP, plasma leptin, smoking status, physical activity score, BMI, alcohol consumption status
#
Model 6: adjusted for age, PEA, LDL, HDL, triglyceride, CRP, plasma leptin, smoking status, physical activity score, BMI, alcohol consumption status, socioeconomic status (education level)
Two-tailed level of significance established as P ≤ 0.006
Page 9 of 13
Men, n = 1,150
SNPs
Alleles
Model 1┼
β (SE)
Model 2╪
P-value
β (SE)
Model 4║
Model 3§
P-value
β (SE)
P-value
Model 5¶
Model 6#
β(SE)
P-value
β (SE)
P-value
β (SE)
P-value
rs16861205
G/A
0.02(0.01)
0.2907
0.01(0.01)
0.3250
0.02(0.02)
0.2014
0.001(0.01)
0.9212
0.001(0.01)
0.9286
−0.01(0.01)
0.9369
rs12495941
G/T
0.04(0.04)
0.3020
0.03(0.04)
0.3923
0.06(0.05)
0.2288
−0.02(0.04)
0.5470
−0.04(0.04)
0.3368
−0.04(0.04)
0.2705
rs7627128
C/A
−0.09(0.06)
0.1112
−0.10(0.06)
0.0656
−0.12(0.08)
0.1383
−0.01(0.05)
0.9122
−0.01(0.05)
0.9111
−0.002(0.05)
0.9631
rs9877202
A/G
0.01(0.02)
0.4062
0.01(0.02)
0.3984
0.002(0.02)
0.8888
−0.003(0.01)
0.8100
0.004(0.01)
0.7816
0.006(0.01)
0.7000
rs2036373
T/G
0.18(0.15)
0.2362
0.19(0.15)
0.2090
0.09(0.18)
0.6042
0.03(0.12)
0.8097
0.06(0.13)
0.6559
0.06(0.13)
0.6333
rs1501299
G/T
−0.01(0.02)
0.5381
−0.01(0.02)
0.5427
−0.02(0.02)
0.4453
−0.003(0.02)
0.8198
−0.01(0.02)
0.7433
−0.004(0.02)
0.7959
rs3821799
T/C
0.01(0.01)
0.5231
0.01(0.01)
0.4373
0.01(0.01)
0.4451
0.01(0.01)
0.3572
0.01(0.01)
0.2271
0.01(0.01)
0.3012
rs9842733
A/T
−0.05(0.06)
0.4189
−0.04(0.06)
0.4565
−0.03(0.07)
0.6265
0.01(0.05)
0.8381
0.02(0.05)
0.6911
0.01(0.05)
0.7695
Davis et al. BMC Genetics (2015) 16:147
Table 7 Association between BMI and ADIPOQ SNPs among men and women in the Jackson Heart Study, N = 3,015*
Women, n = 1,865
SNPs
Alleles
Model 1┼
Model 2╪
Model 4║
β (SE)
P-value
β (SE)
P-value
β (SE)
P-value
β (SE)
P-value
β (SE)
P-value
(SE)
P-value
rs16861205
G/A
0.01(0.01)
0.5560
0.01(0.01)
0.5908
0.02(0.02)
0.3135
0.01(0.01)
0.5001
0.002(0.01)
0.8239
0.004(0.01)
0.7495
rs12495941
G/T
0.06(0.03)
0.0447
0.05(0.03)
0.0724
0.05(0.04)
0.2977
0.01(0.03)
0.7523
0.01(0.03)
0.6878
0.01(0.03)
0.7813
rs7627128
C/A
0.001(0.05)
0.9921
0.01(0.05)
0.8213
0.06(0.07)
0.4078
0.09(0.06)
0.1436
0.09(0.06)
0.1172
0.09(0.06)
0.1307
rs9877202
A/G
0.01(0.02)
0.7077
0.01(0.02)
0.7377
0.002(0.02)
0.9166
0.01(0.01)
0.3950
0.01(0.02)
0.5705
0.01(0.02)
0.5568
rs2036373
T/G
0.07(0.13)
0.5655
0.05(0.13)
0.6915
0.05(0.14)
0.6920
0.05(0.11)
0.6477
0.02(0.12)
0.8414
0.03(0.12)
0.7874
rs1501299
G/T
0.01(0.02)
0.7208
0.01(0.02)
0.6198
0.01(0.02)
0.5665
0.01(0.02)
0.4194
0.02(0.02)
0.3642
0.02(0.02)
0.3543
rs3821799
T/C
0.002(0.01)
0.8623
0.002(0.01)
0.8598
0.005(0.01)
0.7169
0.0001(0.01)
0.9897
0.003(0.01)
0.7858
0.004(0.01)
0.7302
rs9842733
A/T
0.03(0.04)
0.4526
0.02(0.04)
0.5909
0.07(0.05)
0.1991
0.06(0.04)
0.1338
0.06(0.04)
0.1485
0.06(0.04)
0.1391
Model 3Đ
Model 5ả
Model 6#
*
N represents 5 missing values for BMI
┼
Model 1: crude
╪
Model 2: adjusted for age
§
Model 3: adjusted for age, PEA
║
Model 4: adjusted for age, PEA, LDL, HDL, triglyceride, CRP, plasma peptin
¶
Model 5: adjusted for age, PEA, LDL, HDL, triglyceride, CRP, plasma leptin, smoking status, physical activity score, alcohol consumption status
#
Model 6: adjusted for age, PEA, LDL, HDL, triglyceride, CRP, plasma leptin, smoking status, physical activity score, alcohol consumption status, socioeconomic status (education level)
Two-tailed level of significance established as P ≤ 0.006
Page 10 of 13
Davis et al. BMC Genetics (2015) 16:147
expression through different mechanisms such as sequence alterations involved splicing processes and modifications in transcriptional factors binding motifs [37].
Our analysis revealed the tested SNPs disrupted or resulted in the appearance of putative transcription factor
binding sites. Further functional analysis studies of this
and other SNPs, particularly in African Americans, are
needed to elucidate the potential role in regulating adiponectin expression.
ADIPOQ SNP rs1249541 has been found to be associated with adiponectin levels and anthropomorphic measures in other populations [38]. However, to the best of
our knowledge, this is the first report on a gender specific association between the rs12495941 variant and
HOMA-IR. The Bonferroni significance threshold, however, was lost in the model that was fully adjusted for
SES. On the other hand, the ADIPOQ SNP rs7627128
was also associated with HOMA-IR in male carriers of
the minor allele who had significantly lower HOMA-IR,
and this finding was consistent in each of the models.
As with rs1249541, this SNP is located in the intron 1
region and lacks obvious regulatory function and also
represents a novel finding. ADIPOQ SNP rs1501299 in
women with minor allele T had higher HOMA-IR but
this association did not persist beyond adjustment for
age. This attenuation underscores the importance of including adjustment for African ancestry (model 3) in
analyses of African American populations. The association at different SNPs in our sample is not unexpected.
Ukkola et al. indicate this may be a reflection of ethnic
differences in adiponectin gene structure based on their
evaluation of African Americans from the HERITAGE
study [38]. The data in their study are further supported
by evidence demonstrating African Americans have reduced plasma adiponectin concentrations when compared to other ethnic groups [10]. The potential for
ethnic differences in the adiponectin gene emphasizes
the need to study genetic associations in a variety of
populations. The differential sex observation related to
SNPs rs12495941 and rs7627128 is not clearly understood, but may be related to sex-specific hormones such
as estradiol and testosterone as observed with
rs16861205 and adiponectin [39–41]. There was substantial missing HOMA-IR data in our data which may
likewise result in biased findings. Further research on
ADIPOQ variants and HOMA-IR on both sexes accounting for sex hormones is warranted to elucidate the
biological mechanisms of this association.
Our study did not reveal any association of ADIPOQ
SNPs with type 2 diabetes, blood glucose or BMI in men
or women. These findings are interesting given prior evidence documenting the association of ADIPOQ gene
with type 2 diabetes, insulin resistance, elevated blood
glucose and BMI [12–15]. However, such reports did not
Page 11 of 13
adequately control for ancestry, biological and behavioral
risk factors or SES when assessing the association of
ADIPOQ polymorphisms. An investigation by Bostrom
et al., for instance, similarly found that SNP rs3821799
in the ADIPOQ gene was not associated with type 2 diabetes in African Americans [15]. These investigators also
tested the association of SNP rs1501299 and found no
association with type 2 diabetes. Previous studies that
did not include African Americans detected an association of ADIPOQ SNPs in the promoter region or in
exons (exon 3) with morbid obesity and with type 2 diabetes [42, 43]. Our analysis of variant rs12495941 revealed no associations with our outcomes. A study of
this variant in a sample of Indians also found no association with type 2 diabetes or insulin sensitivity related
variables [44]. This polymorphism was, however, associated with fasting glucose levels in Hispanics [45]. We
also assessed variant rs9877202. Few studies have investigated this intronic polymorphism. However, this variant was not associated with any study outcomes [46]. A
recent meta-analysis reported a genetic susceptibility for
type 2 diabetes linked to rs1501299 in East Asian populations [47]. We found no association with any of the
outcomes in our study.
Several studies have reported a significant association
between BMI and various ADIPOQ SNPs [17, 36, 38],
albeit with inconsistent results across studies. Furthermore, such studies were conducted in non-African
American populations and did not report sex differences. However, evidence from a genome wide association study by Liu et al. identified two waist-related
genetic loci (LHX2 and RREB1) associated with fat distribution in African American populations [17]. A report
by An et al. of the IRAS Family Study, on the other
hand, indicates no association between selected ADIPOQ
SNPs and BMI in African Americans [42]. They further
report that only one promoter SNP was positively associated with plasma adiponectin and fasting glucose in
African Americans – rs17300539.
Strengths and limitations
The main strength of this investigation is that findings
were from the largest community-based sample of
African Americans, a cohort with strict protocol and
high quality-control. It also addresses a health outcome
that disproportionately affects African Americans. In
addition, it presents differential findings between African
American men and women. Further, the sample size far
exceeds those in previous reports and the study used a
tag SNP approach that captures much of the variation
across the adiponectin gene in African Americans. The
analysis was also adjusted for global/aggregate genetic
ancestry, biological and behavioral risk factors and socioeconomic status. In terms of limitations, findings cannot
Davis et al. BMC Genetics (2015) 16:147
be generalized to other ethnic groups. Secondly, this is a
cross-sectional analysis and causality between ADIPOQ
SNPs and phenotypes cannot be attributed without longitudinal tracking or incidence. Finally, although some
of the associated SNPs did not reach a Bonferroniadjusted threshold of significance, it will be important to
replicate these findings in additional suitable cohorts.
Conclusion
The objective of this study was to assess the association of
tag ADIPOQ SNPs with type 2 diabetes and related phenotypes between African American men and women. No
association was observed between ADIPOQ SNPs and
type 2 diabetes, blood glucose or BMI in men or women.
A significant association with variant rs16861205 and
lower adiponectin level was revealed in women with
minor allele A. Variant rs12495941 revealed men with
minor allele T had higher HOMA-IR but significance disappeared after adjustment for SES. Variant rs7627128 indicated men with minor allele A had significantly lower
HOMA-IR that remained consistent in the fully adjusted
model. These associations represent novel findings. As
with any gene-phenotype association study, it is necessary
to replicate study findings in other large well characterized
study populations. Our well-adjusted findings nevertheless
suggest important new insights regarding the association
between ADIPOQ SNPs and type 2 diabetes and related
phenotypes in African American men and women a disproportionately affected population.
Availability of supporting data
Data for this study were deposited in the National Institutes of Health The database of Genotypes and Phenotypes (DbGAP) found at www.ncbi.nlm.gov/gap/
?item=Jackson+Heart+Study [48].
Competing interests
None of the authors have any financial or non-financial competing interests.
Authors’ contributions
SKD designed the study, analyzed and interpreted the data, discussed the
results, wrote, edited and drafted the paper. SYG analyzed and interpreted
the data, edited and assisted with drafting the paper. RX carried out
statistical analyses for the study, edited and assisted with drafting the paper.
PR analyzed the data, discussed the results, edited and assisted with drafting
the paper. RJK analyzed the data, edited and assisted with drafting the
paper. AG analyzed the data, discussed the results, edited and assisted with
drafting the paper. JGW and AB acquired the adiponectin and SNP data,
analyzed, edited and assisted with drafting the paper. SKD is the guarantor
of this work and, as such, had full access to all the data in the study and
takes responsibility for the integrity of the data and the accuracy of the data.
All authors have read and approved the final version of the manuscript.
Acknowledgments
The authors thank the participants in the Jackson Heart Study for their
long-term commitment and important contributions to the study.
Funding for the Jackson Heart Study was supported by contracts
HHSN268201300046C, HHSN26820130047C, HHSN26820130048C,
HHSN268201300049C, HHSN268201300050C from the National Heart,
Lung and Blood Institute and the National Institute on Minority Health
Page 12 of 13
and Health Disparities. The measurement of adiponectin was partially
supported by PHS Award UL1 RR025008 from the National Center for
Research Resources and by UH1 HL073461 from the National Heart, Lung
and Blood Institute. Sharon K. Davis, Samson Y. Gebreab, Ruihua Xu, Pia
Riestra, Rumana J. Khan and Amadou Gaye are supported by the intramural
program of the National Human Genome Research Institute.
Author details
1
National Human Genome Research Institute, Genomics of Metabolic,
Cardiovascular and Inflammatory Disease Branch, Social Epidemiology
Research Unit, 10 Center Drive, Bethesda, MD 20892, USA. 2Department of
Physiology, University of Mississippi Center, 2500 N State St, Jackson, MS
39216, USA. 3Indiana University Bloomington, School of Public Health, 1025
E. 7th St, Suite 111, Bloomington, IN 47405, USA.
Received: 29 September 2015 Accepted: 14 December 2015
References
1. National Center for Health Statistics. Health, United States, 2011: with special
features on socioeconomic status and health. Department of Health and
Human Services. Hyattsville, MD 2012.
2. Whittle JC, Whelton PK, Seidler AJ, Klag MJ. Does racial variation in risk
factors explain black-white differences in the incidence of hypertensive
end-stage renal disease? Arch Intern Med. 1991;151:1359–64.
3. Bryne C, Nedelman J, Luke RG. Race, socioeconomic status, and the
development of end-stage renal disease. Am J Kidney Dis. 1994;23:16–22.
4. Brancati FL, Kao WH, Folsom AR, Watson RL, Szklo M. Incident type 2
diabetes mellitus in African American and White adults: the Atherosclerosis
Risk in Communities Study. JAMA. 2000;283:2253–9.
5. Selvin E, Steffes MW, Ballantyne CM, Hoogeveen RC, Coresh J, Brancati FL.
Racial differences in glycemic markers: a cross-sectional analysis of
community-based data. Ann Intern Med. 2011;154:303–9.
6. Kasim-Karakass SE. Ethnic differences in the insulin resistance syndrome. Am
J Clin Natr. 2000;71:670–1.
7. Sudano JJ, Baker DW. Explaining US racial/ethnic disparities in health
declines and mortality in late middle age: the role of socioeconomic status
in health behaviors and health insurance. Soc Sci Med. 2006;62:909–22.
8. Sonnenberg GE, Krakower GR, Kissenbah AH. A novel pathway to the
manifestation of metabolic syndrome. Obes Res. 2004;12:180–6.
9. Hug C, Lodish HF. The role of the adipocyte hormone adiponectin in
cardiovascular disease. Curr Opin Pharmacol. 2005;5:129–34.
10. Hulver MW, Saleh O, MacDonald KG, Pories WJ, Barakat HA. Ethnic
differences in adiponectin levels. Metabolism. 2004;53:1–3.
11. Heid IM, Henneman P, Hicks A, Coassin S, Winkler T, Aulchenko YS, et al.
Clear detection of ADIPOQ locus as the major gene for plasma adiponectin:
results of genome-wide association analyses including 43659 European
individuals. Atherosclerosis. 2010;208:412–20.
12. Mackevics V, Heid IM, Wagner SA, Cip P, Doppelmayr H, Lejnieks A, et al.
The adiponectin gene is associated with adiponectin levels but not with
characteristics of the insulin resistance syndrome in health Caucasians.
Eur Jo Hum Gen. 2006;14:349–56.
13. Dolley G, Bertrais S, Frochot V, Bebel JF, Guerre-Millo M, Tores F, et al.
Promoter adiponectin polymorphisms and waist/hip ratio variation in a
prospective French adult study. In Jou Obesity. 2008;32:669–75.
14. Vasseur F, Helbecque N, Dina C, Lobbens S, Delannoy V, Gaget S, et al.
Single-nucleotide polymorphism haplotypes in both proximal promoter and
exon 3 of the APM 1 gene modulate adipocyte-secreted adiponectin
hormone levels and contribute to the genetic risk for type 2 diabetes in
French Caucasians. Hum Mol Genetics. 2002;11:2607–14.
15. Bostrom MA, Freedman BI, Langefeld CD, Liu L, Hicks PJ, Bowden DW.
Association of adiponectin gene polymorphisms with type 2 diabetes
an African American population enriched for nephropathy. Diabetes.
2009;58:499–504.
16. Chen G, Bentley A, Adeyemo A, Shriner D, Zhou J, Doumatey A, et al.
Genome-wide association study identifies novel loci association with fasting
insulin and insulin resistance in African Americans. Hum Mol Genetics.
2012;20:4530–6.
17. Liu C-T, Monda KL, Taylor KC, Lange L, Demerath EW, Palmas W, et al.
Genome-wide association of body fat distribution in African ancestry
populations suggests new loci. PLoS Genet. 2013;8, e1003681.
Davis et al. BMC Genetics (2015) 16:147
18. Speechia C, Scott K, Fortina P, Devoto M, Falkner B. Association of a
polymorphic variant of the adiponectin gene with insulin resistance in
African Americans. Clin Transl Sci. 2008; 3194–3199
19. Ng MC, Shriner D, Chen BH, Li J, Chen W-M, Guo X, et al. Meta-analysis
of genome-wide association studies in African Americans provides
insights into the genetic architecture of type 2 diabetes. PLoS Genet.
2014;10:e1004517.
20. Taylor Jr HA. The Jackson Heart Study; an overview. Ethn Dis. 2005;15:1–3.
21. Carpenter MA, Evans G, Skelton T, Jensen R, Sarpong D. Laboratory, reading
center, and coordinating center data management in the Jackson Heart
Study. Am J Med Sci. 2004;328i:131–44.
22. Musunuru K, Lettre G, Young T, Farlow DN, Pirruccello JP, Ejebe KG, et al.
NHLBI candidate gene association resource. Candidate gene association
resource (CARe): design, methods, and proof of concept. Circ Cardiovasc
Genet. 2010;3:267–75.
23. American Diabetes Association. Diagnosis and classification of diabetes
mellitus. Diabetes Care. 2010;33:S62–9.
24. Shand B, Elder P, Scott R, Frampton C, Willis J. Biovariability of plasma
adiponectin. Clin Chem Lab Med. 2006;10:1264–8.
25. Matthews DR, Hosker JP, Rudenski AS, Naylor BA, Treacher DF, Turner RC.
Homeostatsis model assessment: insulin resistance and beta-cell function
form fasting plasma glucose and insulin concentration in men.
Diabetologia. 1985;28:412–9.
26. Release #24;
27. deBakker PI, Ferreira MA, Jia X, Neale BM, Raychaudhuri S, Voight BF.
Practical aspects of imputation-driven meta-analysis of genome-wide
association studies. Hum Mol Genetics. 2008;17:R122–8.
28. Duan Q, Liu EY, Auer PL, Zhang G, Lange EM, Jun G, et al. Imputation of
coding variants in African Americans: better performance using data from
the exome sequencing project. Bioinformatics. 2013;29:2744–9.
29. Price AL, Tandon A, Patterson N, Barnes KC, Rafaels N, Ruczinski I, et al.
Sensitive detection of chromosomal segments of distinct ancestry in
admixed populations. PLoS Genet. 2009;5, e1000519.
30. Pattererson N, Hattangadi N, Lane B, Lohmueller KE, Hafler DA, Oksenberg
JR, et al. Methods for high-density admixture mapping of disease genes.
Am Jou Hum Genetics. 2004;74:979–1000.
31. Keating BJ, Tischfield S, Murray SS, Bhangale T, Price TS, Glessner JT, et al.
Concept, design and implementation of a cardiovascular gene-centric
50k SNP array for large-scale genome association studies. PLoS One.
2008;10, e3583.
32. Bidulescu A, Liu J, Chen Z, Hickson DA, Musani SK, Samdarshi TE, et al.
Associations of adiponectin and leptin with incident coronary heart disease
and ischemic stroke in African Americans: the Jackson Heart Study. Fron
Pub Health. 2013. doi:10.3389/fpubh.2013.00016.
33. Liu J, Butler KR, Buxbaum SG, Sung JH, Campbell BW, Taylor HA. Leptinemia
and its association with stroke and coronary heart disease in the Jackson
Heart Study. Clin Endocrinol. 2009;72:32–7.
34. Hong EP, Park JW. Sample size and statistical power calculation in genetic
association studies. Gen & Inform. 2012;10:117–22.
35. SAS Institutes Inc, Cary North Carolina.
36. Cohen EM, Williams SM, Zheng W, Cai Q, Long J, Smith JR. ADIPOQ,
ADIPOR1, and ADIPOR2 polymorphisms in relation to serum adiponectin
levels and body mass index in black and white women. Obesity.
2011;19:2053–62.
37. Grabe N. AliBaba2;context specific identification of transcription factor
binding sites. In Silico Biology. 2002;2(1):S1–15.
38. Ukkola O, Santaniemi M, Rankien T, Leon AS, Skinner JS, Wilmore JH, et al.
Adiponectin polymorphisms, adiposity and insulin metabolism: HERITAGE
family study and Oulu diabetic study. Ann Med. 2005;37:141–50.
39. Combs TP, Berg AH, Rajala MW, Klebanovs IP, Jimenez-Chillaron JC, Patti ME,
et al. Sexual differentiation, pregnancy, caloric restriction and aging
affect the adipocyte-specific secretory protein adiponectin. Diabetes.
2003;52:267–76.
40. Nishizawa H, Shimomura I, Skisida K, Maeda N, Kuriyama H, Nagaretani H, et
al. Androgens decrease plasma adiponectin on insulin-sensitizing adipocytederived protein. Diabetes. 2002;51:2734–41.
41. Xu A, Chan KW, Hoo RL, Wang Y, Tan KC, Zhang J, et al. Testosterone
selectively reduces the high molecular weight form of adiponectin by
inhibiting its secretion from adipocytes. J Biol Chem. 2005;280:18073–80.
42. Vasseur F, Helbecque N, Lobbens S, Vassueur-Delannoy V, Dina C, Clement
K, et al. Hypoadipoectinamia (ACDC) gene promoter variants in morbid
Page 13 of 13
43.
44.
45.
46.
47.
48.
obesity: evidence for a role of ACDC in diabesity. Diabetologia.
2005;48:892–9.
Schwarz PE, Govindarajalu S, Towers W, Schwanebeck U, Fisher S, Vasseur F,
et al. Haplotypes in the promoter region of the ADIPOQ gene as associated
with increased diabetes risk in a German Caucasian population. Horm
Metab Res. 2006;38:447–51.
Wassel CL, Pankow JS, Rasmussen-Torvik L, Li N, Taylor KD, Guo X, et al.
Association of SNPS in ADIPOQ and subclinical cardiovascular disease in the
multi-ethnic study of atherosclerosis (MESA). Obesity. 2011;10(10):2053–62.
An SS, Hanley AJG, Ziegler JT, Brown WM, Haffner SM, Norris JM, et al.
Association between ADIPOQ SNPs with plasma adiponectin and glucose
homeostatsis and adiposity phenotypes in the IRAS Family Study. Mol
Genetics Metab. 2012;107:721–8.
Riestra P, Gebreab SY, Khan RJ, Bidulescu A, Correa A, Tekola-Ayele F, et al.
Gender specific associations between ADIPOQ gene polymorphisms and
adiponectin levels and obesity in the Jackson Heart Study. BMC Med Gen.
2015;10:65. doi:10.1186/s12881-015-214-x.
Tu Y, Yu Q, Fan G, Yang P, Lai Q, Yang F, et al. Assessment of type 2
diabetes risk conferred by SNPs rs2241766 and rs1501299 in the ADIPOQ
gene, a case/control study combined with meta-analysis. Mol and cell endo.
2014;396(1–2):1–9.
dbGAP DOI link www.ncbi.nlm.gov/gap/?item=Jackson+Heart+Study
Submit your next manuscript to BioMed Central
and we will help you at every step:
• We accept pre-submission inquiries
• Our selector tool helps you to find the most relevant journal
• We provide round the clock customer support
• Convenient online submission
• Thorough peer review
• Inclusion in PubMed and all major indexing services
• Maximum visibility for your research
Submit your manuscript at
www.biomedcentral.com/submit