Nghiên cứu hạt Muon trong mưa rào khí quyển diện rộng ghi nhận tại Hà Nội bằng Detector Cherenkov nước
Bạn đang xem bản rút gọn của tài liệu. Xem và tải ngay bản đầy đủ của tài liệu tại đây (13.02 MB, 117 trang )
BỘ GIÁO DỤC VÀ ĐÀO TẠO VIỆN HÀN LÂM KHOA HỌC
VÀ CÔNG NGHỆ VIỆT NAM
VIỆN VẬT LÍ
NGUYỄN THỊ THẢO
STUDY OF MUONS PRODUCED IN EXTENSIVE
AIR SHOWERS DETECTED IN HANOI USING
A WATER CHERENKOV DETECTOR
LUẬN ÁN TIẾN SĨ VẬT LÍ
Hà Nội − 2014
2
BỘ GIÁO DỤC VÀ ĐÀO TẠO VIỆN HÀN LÂM KHOA HỌC
VÀ CÔNG NGHỆ VIỆT NAM
VIỆN VẬT LÍ
NGUYỄN THỊ THẢO
STUDY OF MUONS PRODUCED IN EXTENSIVE
AIR SHOWERS DETECTED IN HANOI USING
A WATER CHERENKOV DETECTOR
Chuyên ngành: Vật lí nguyên tử
Mã số: 62 44 01 06
LUẬN ÁN TIẾN SĨ VẬT LÍ
NGƯỜI HƯỚNG DẪN KHOA HỌC:
GS.Pierre Darriulat
Hà Nội − 2014
3
Tóm tắt
Luận án trình bày nghiên cứu chi tiết về hoạt động của detector
Cherenkov VATLY, bản sao của một trong 1660 detector mặt đất tại Đài thiên
văn Pierre Auger. Đề tài nghiên cứu tập trung vào sự đáp ứng của detector đối
với các tín hiệu nhỏ tới một phần mười tín hiệu được tạo ra bởi hạt muon đi
xuyên detector theo phương thẳng đứng (VEM ), mở rộng vùng hoạt động của
detector lên đến 10
4
. Nghiên cứu sử dụng phương pháp tìm kiếm thực nghiệm sự
phân rã của hạt muon dừng trong khối nước của detector, trong đó chỉ có một vài
phần trăm thông lượng hạt là phát ra đủ ánh sáng Cherenkov để có thể được ghi
nhận trước khi bị dừng hoàn toàn. Sau đó, mỗi muon phân rã thành một electron
(hay positron) có năng lượng trung bình khoảng 35 MeV. Thí nghiệm được thiết
kế phù hợp cho việc phát hiện các tín hiệu được tạo ra bởi cả muon dừng và
electron được sinh ra. Những cặp tín hiệu như vậy đã được phát hiện trong các
điều kiện thí nghiệm khác nhau, cả biên độ tín hiệu lẫn khoảng thời gian giữa hai
tín hiệu cùng được xác định. Một hodoscope nhấp nháy được đặt trên và dưới
detector Cherenkov để chuẩn thang đo cho hệ thống. Một số lượng lớn mẫu số
liệu đã được thu thập cho thấy bằng chứng rất rõ ràng về sự phân rã muon với
phổ thời gian như đã dự kiến. Biên độ tín hiệu của hạt electron được thấy chỉ
bằng một phần của một VEM , và chỉ phần đuôi phổ phân bố là được ghi nhận.
Phân bố của muon đòi hỏi phải có thêm sự đóng góp của thành phần mềm
electron/photon, xuất hiện đặc biệt quan trọng trong thí nghiệm này do detector
Cherenkov có thể tích ghi đo lớn. Một mô hình để tìm hiểu về cơ chế vật lý và
tiến trình ghi nhận đã được xây dựng giải thích rõ ràng phổ phân bố điện tích và
thời gian đã thu được. Nó cũng cho phép đánh giá số quang điện tử trên một
VEM là 13,0 ± 0,9 và năng lượng trung bình của muon là 4,0 ± 0,4 GeV. Hiệu
suất ghi nhận hạt electron ngụ ý một kích thước mưa rào electron hiệu dụng là
~36 ± 6 cm, bằng kích thước của chiều dài bức xạ trong môi trường nước. Điểm
cuối của phổ phân bố điện tích electron, tương ứng với động năng 53 MeV, được
đo là E
end
= 0,275 ± 0,018 VEM phù hợp với dự kiến. Tốc độ sự kiện được đo
phù hợp với dự kiến. Tốc độ xuất hiện sự kiện muon kép trong cùng một mưa rào
là 7,0 ± 0,5 Hz. Một chương trình mô phỏng cơ chế thu nhận ánh sáng đã được
4
viết thể hiện sự phụ thuộc của các góc tới nhỏ vào hiệu suất ghi nhận, điều này
phù hợp với quan sát. Ngoài ra, nghiên cứu này đã đóng góp những thông tin hữu
ích về các hoạt động chi tiết của những detector Cherenkov lớn nói chung, và của
mảng detector mặt đất tại Đài thiên văn Pierre nói riêng. Nghiên cứu đã góp phần
vào việc đào tạo sinh viên ngành vật lí hạt thực nghiệm và vật lí hạt nhân bằng
cách cung cấp cho họ một công cụ đặc biệt thích hợp với công việc.
5
Abstract
A detailed study of the performance of the VATLY Cherenkov detector, a
replica of one of the 1660 detectors of the ground array of the Pierre Auger
Observatory, is presented. The emphasis is on the response to low signals down
to a tenth of the signal produced by a vertical feed-through muon (VEM),
implying a dynamical range in excess of 10
4
. The method is to look for decays of
muons stopping in the water volume of the detector, of which only a few produce
sufficient Cherenkov light to be detected before stopping. The subsequent muon
decay produces an electron (or positron) that carries an average energy of only
~35 MeV. The experimental set-up detects the signals produced by both the
stopping muon and the decay electron. Such pairs have been detected under
various experimental conditions and the amplitude of the electron signal has been
recorded together with the time separating the two signals. A scintillator
hodoscope that brackets the Cherenkov detector from above and below provides
a precise calibration. A large sample of data has been collected that give very
clear evidence for muon decays with the expected time dependence. The
amplitude of the electron signal is observed at the level of a fraction of a VEM,
and only the upper part of its distribution can be detected. The muon distribution
requires the additional contribution of a soft electron/photon component, which
appears particularly important in the present experimental set-up due to the large
sensitive volume of the Cherenkov detector. A model of the physics mechanism
at play and of the detection process has been constructed, giving good
descriptions of the measured charge and time distributions. This allows for
obtaining useful evaluations of the number of photoelectrons per VEM, 13.0±0.9,
and of the mean muon energy, 4.0 ±0.4 GeV. The detection efficiency of
electrons implies an effective electron shower size, ~36±6 cm, at the scale of the
radiation length in water. The end point of the electron charge distribution,
corresponding to a kinetic energy of 53 MeV, is measured to be
E
end
=0.275±0.018 VEM in agreement with expectation. The measured event
rates are found in good agreement with predictions and the occurrence of muon
pairs from a same shower is measured with a rate of 7.0±0.5 Hz. A simulation of
6
the light collection mechanism suggests the presence of a small zenith angle
dependence of its efficiency, which is found consistent with observation. At the
same time as this study contributes useful information to the detailed
performance of large Cherenkov detectors in general, and particularly of the
ground array of the Pierre Auger Observatory, it contributes to the training of
students of experimental particle and nuclear physics by making available to
them a tool particularly well suited to the task.
7
Key to Abbreviations
VEM Vertical Equivalent Muon
PAO Pierre Auger Observatory
VATLY Vietnam Auger Training LaboratorY
SNR Super Nova Remnants
EAS Extensive Air Shower
UHECR Ultra High Energy Cosmic Rays
LDF Lateral Distribution Function
FD Fluorescence Detector
SD Surface Detector
GZK Greisen-Zatsepin-Kuzmin
CMB Cosmic Microwave Background
PMT Photomultiplier Tube
ADC Analogue to Digital Converter
TDC Time to Digital Converters
NIM Nuclear Instrumentation Module
TU Timing Unit
PU Pattern Unit
Disc Discriminator
TAC Time to Amplitude Converter
MCA Multi Channel Analyzer
CAMAC Computer Automated Measurement And Control
t.u. threshold unit
8
Acknowledgements
My deep gratitude goes first to Prof. Pierre Darriulat, supervisor of this
thesis, for countless discussions, enormous help during my doctoral studies and
continuous support. Without him this work would not have been possible.
I would like to thank Dr. Dang Quang Thieu for guidance and assistance
with the hardware. I also thank my colleagues, Dr. Pham Ngoc Diep, Dr. Pham
Thi Tuyet Nhung and Dr. Pham Ngoc Dong for their friendly collaboration.
The work accomplished by the Auger Collaboration inspired the studies
presented here: much of my work owes a lot to their experience. I express my
deep gratitude to our colleagues in the Pierre Auger Collaboration and to the
friends of VATLY for their constant interest and support.
I thank INST/VAEI, IOP, NAFOSTED, the French CNRS, the Rencontres
du Vietnam, the Odon Vallet fellowships and the World Laboratory for financial
support.
This thesis is dedicated to my family − Nguyễn Văn Trương, Bùi Thị Sửu,
Nguyễn Thành Dương, Bùi Thị Thái, Nguyễn Khánh Huyền and
Nguyễn Thanh Hà.
9
Table of content
Tóm tắt 3
Abstract 5
Key to Abbreviations 7
Acknowledgements 8
Table of content 9
1. Introduction 11
1.1 Generalities on cosmic rays 11
1.2 The Pierre Auger Observatory 13
1.3 Cosmic rays in Hanoi 19
1.4 The VATLY Cherenkov detectors 21
1.5 Overview of the present work 24
2. Response of the VATLY Cherenkov Detector to feed-through muons 26
2.1 The trigger hodoscope 26
2.1.1 Description 26
2.1.2 High voltages and delays 27
2.1.3 Rate 29
2.2 Electronics 30
2.3 Analysis of hodoscope data 32
2.3.1 Charge distributions 32
2.3.2 Time of flight 35
2.3.3 Event selection 37
2.3.4 Stability 38
2.4 Analysis of Cherenkov data 40
2.4.1 Response of the Cherenkov counter to a hodoscope trigger 41
2.4.2 Selection of good muons 42
2.4.3 Conclusion 43
3. Muon decays in the VATLY Cherenkov tank 44
3.1. Basic processes 44
3.2. Simulation of the detector and muon signal 47
4. Auto-correlations: rates and time distributions 53
10
4.1 The problem 53
4.2 No correlation 54
4.3 Cosmic rays 54
4.4 Muon decays and muon captures 55
4.5 Decays, capture and multi-muons 57
4.6 Simulation 58
5. Auto-correlations: electronics and data acquisition 61
5.1 Auto-correlation measurement 61
5.1.1 Timing considerations 63
5.1.2 Calibration 65
5.1.3 Spikes 67
5.2 Charge measurement 70
6. Auto-correlations: data analysis 72
6.1 Time spectra 72
6.1.1 Introduction 72
6.1.2 Cherenkov detector 73
6.1.3 Scintillator detector 78
6.2 Charge spectra 81
6.2.1 Introduction 81
6.2.2 Cherenkov detector 81
6.2.3 Scintillator detector 90
7. Results and interpretation 93
7.1 A simple model 93
7.2 Comparison with the data 94
7.3 Including a soft component 96
7.4 Threshold cut-off functions 98
7.5 Dependence on zenith angle 99
7.6 Comparison between data and simulation 102
7.7 Decoherence and shower size 109
8. Summary and conclusion 111
References 115
11
1. Introduction
1.1 Generalities on cosmic rays
Cosmic rays [1] are ionised nuclei that travel in space up to extremely
high energies of the order of 10
20
eV=16 Joules. There are very few of them but
their contribution to the energy density of the Universe is similar to that of the
Cosmic Microwave Background or of the visible light or of the magnetic fields,
namely ~1 eV/cm
3
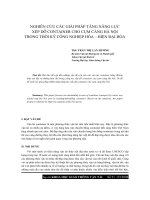
. Their power law energy spectrum (Figure 1.1), spanning 32
decades (12 decades in energy), is of the approximate form E
–2.7
.
The Pierre Auger Observatory (PAO) [2] studies the high energy part of
the spectrum, where an extragalactic component can be found. The water
Cherenkov detector of the Vietnam Auger Training LaboratorY (VATLY),
which is being studied in the present
thesis, is a replica of those used in the
PAO. Indeed VATLY is associated with
the PAO and much of its research is
related to PAO data. However, the
present study uses data collected in
Hanoi, at sea level, which correspond to
the low energy part of the spectrum. Its
main aim is to study the detector, its
properties and its response to various
sources, in particular to low signals.
Because of the close relation
between VATLY and the PAO, we
devote the next sub-section (1.2) to a
brief description of the PAO and of the
physics questions that it addresses. The main characteristics of low energy
cosmic rays, as used here, are briefly reviewed in sub-section 1.3 and the water
Figure 1.1 The cosmic ray energy
spectrum displaying its main
features.
12
Cherenkov detectors used in both VATLY and the PAO are described in sub-
section 1.4. Sub-section 1.5 introduces the present work.
At lower energies, cosmic rays are found to be ionised nuclei with relative
abundances similar to those measured on average in the Universe: protons
dominate, followed by helium nuclei and by a spectrum of strongly bound light
nuclei, mostly iron. Spallation reactions occurring in the interactions of cosmic
rays with interstellar matter tend to fill the valleys of the original spectrum.
Most of the lower energy cosmic rays are galactic and have their sources
in the shells of young Super Nova Remnants (SNR) in the Milky Way, the
acceleration mechanism being well described by diffusive shock acceleration
across the shock front [3]. This is a collisionless process, with magnetic fields
causing the random walk progression of the particle being accelerated, implying
many successive traversals of the shock front. Each shock traversal increases the
particle energy by a constant fraction, proportional to the relative velocity of the
upstream medium with respect to the
downstream one. Turbulences around the
shock result in strong magnetic field
amplification increasing significantly the
efficiency of the acceleration process.
Diffusive shock acceleration has the
property to generate a power energy
spectrum with an index between 2 and 3.
When a primary cosmic ray enters
the Earth atmosphere, it interacts with it
and produces a large number of mesons,
which, in turn, interact with the
atmosphere, and so on until the primary
energy is exhausted in ionisation losses. The result is a cascade of interactions
(Figure 1.2) producing an extensive air shower (EAS). Its longitudinal profile
evolves slowly with energy, in proportion to its logarithm, while its energy
content, in the form of ionisation losses, is proportional to energy.
Figure 1.2
Development of an extensive
air shower in the atmosphere.
vertical shower
13
A major fraction of the mesons produced are pions, either neutral or
charged. The former decay promptly into two photons and are therefore lost for
the development of the hadronic cascade. They generate instead electromagnetic
showers consisting mostly of electrons, positrons and photons, developing
longitudinally at the scale of a radiation length, twice as short as the interaction
length which governs the development of the hadronic cascade. The charged
pions have a chance to decay into a muon-neutrino pair if their decay length,
56 m/GeV, is short enough in comparison with the interaction length. As a result,
the muon to electron/photon ratio increases with depth.
Indeed, at sea level, most cosmic rays are muons with momenta in the few
GeV/c range. Their rate is of the order of 1/cm
2
/min and depends on latitude. The
reason is the shielding action of the geomagnetic field: when a low momentum
cosmic ray aims at the Earth, it will be bent out by this field and will not reach
the atmosphere. These results in a momentum cut-off called rigidity cut-off. It is
of the order of 4 GeV/c in Europe and Northern America. If the geomagnetic
field were a perfect south-north dipole, it would be zero at the poles and maximal
at the equator. In fact it is maximal in a region that covers from Sri Lanka to
Vietnam, where it reaches 17 GeV/c. Near the poles, it is indeed very low and
allows solar wind particles to enter the atmosphere, causing auroras. The
geomagnetic field has only little effect on the secondary shower particles: it acts
on the primary cosmic ray. On ground, it affects mostly the cosmic ray flux, not
much the energy spectrum.
1.2 The Pierre Auger Observatory
The Pierre Auger Observatory (PAO) is a hybrid detector covering
3’000 km
2
in the Argentinean Pampas where showers are detected from the
fluorescence they produce in the atmosphere and by their impact on a ground
detector array (Figure 1.3). Construction of the baseline design was completed in
June 2008. With stable data taking starting in January 2004, the world's largest
data set of cosmic ray observations had been already collected during the
construction phase of the Observatory.
14
Around 30 EeV, the UHECR flux is about 0.2 km
−2
century
−1
sr
−1
EeV
−1
and drops rapidly at higher energies, requiring a very large coverage; but the
showers contain billions of particles when reaching ground and cover several
square kilometres, allowing for a thin sampling. Only 5 ppm of the PAO area are
covered by detectors. These include 1’660 Cherenkov detectors making up the
surface detector (SD, Figure 1.4), and 24 fluorescence telescopes making up the
fluorescence detector (FD, Figure 1.5). Data are transferred by radio to an
acquisition centre which filters them and sends them out for subsequent
dispatching to the laboratories associated with this research, including VATLY in
Ha Noi.
The SD samples the footprint of the showers on ground. It is made of a
triangular array of water Cherenkov counters having a mesh size of 1.5 km
located on flat ground at an altitude of 1’400 metres above sea level. The
VATLY Cherenkov detector is a replica of one of these.
Figure 1.3 Left: Plan view of the PAO, covering some 60×50 km
2
. SD tanks are shown
as dots and the lines of sight of the 24 FD telescopes as green lines.
Right: The first four-fold hybrid event (when the array was not yet complete).
15
When reaching ground, showers consist essentially of low energy
electrons, positrons and photons as well as of muons having a kinetic energy of a
few GeV. When shower particles are detected in at least three detectors, the
measurement of the time at which they are hit allows for a precise measurement
of the azimuth and zenith angle of the shower axis (accounting for the slight
curvature of the shower front). The energy measurement implies the construction
UV-Filter
300-400nm
camera
440 PMTs
11 m2
mirror
Figure 1.5
Left: A fluorescence station: schematic view (above) and its photograph
(below). Right: Photograph of an eye.
Three 9”
PM Tubes
Plastic tank
White light
diffusing
liner
De
-
ionized
water
Sol
ar panel and
electronic box
Comm
antenn
a
GPS
antenn
a
Battery
box
Figure 1.4
Picture of a Cherenkov tank on site (left panel) and exploded view (right
panel).
16
of a standard function, called lateral distribution function (LDF), which gives the
average signal measured in a Cherenkov detector as a function of shower energy,
distance to the shower axis and zenith angle. The energy is essentially obtained
from the normalization of the measured signals to the standard LDF. The final
energy scale is calibrated using FD data in hybrid events as illustrated in Figure
1.6. Figure 1.7 summarizes the information gathered by the SD, showing both the
footprint of the shower on ground and the fit to the LDF.
Three major questions are being addressed by the PAO: Which is the
energy distribution of UHECRs? Where do they come from? Which is their
nature?
The PAO has already given two particularly important answers to these
questions. One is the evidence for the so-called GZK cut-off [4], the other is the
observation of a correlation between the direction of arrival of the highest energy
UHECRs and nearby galaxies.
Figure 1.6
Hybrid events. Left: Correlation between the decimal logarithms of the
energy measured in the FD (abscissa) and in the SD (ordinate).
Right: Fractional
difference between the FD and SD energies, E
FD
and E.
17
The Greisen-Zatsepin-Kuzmin (GZK) cut-off results from the interactions
of cosmic rays with the cosmic microwave background (CMB), producing either
electron-positron pairs or new mesons. Of these, the pion photoproduction
threshold is of particular importance. Until recently, the existence of such a cut-
off was uncertain but the Pierre Auger Observatory has given clear evidence for
it (Figure 1.8). With a typical interaction length in the few 10 Mpc scale, cosmic
rays coming from larger distances cannot make it to the Earth without
interacting, and therefore loose energy: their flux is significantly damped and
only nearby (<100 Mpc) sources can contribute to the UHECR spectrum.
The large UHECR statistics accessible to the PAO has revealed a
correlation with extragalactic counterparts. Of relevance to this study is the fact
that the nearby universe, in which detected UHECRs are confined by the GZK
cut-off, is highly inhomogeneous. Selecting UHECR having an energy in excess
of 6×10
19
eV and comparing the direction in the sky where they come from with
a catalogue of nearby (< 75 Mpc) galaxies, reveals a positive, but relatively weak
correlation.
Figure 1.7 SD data of a typical event of about 5x10
18
eV. Top left: Top view of
triggered tanks. Lower left: LDF fit. Right: FADC traces from four detectors.
Core Distance (m)
East (km)
North (km)
VEM
Time (ns)
VEM
VEM
VEM
VEM
18
Of relevance to this result is the fact that, at the highest energies, the
nature of the primaries drifts from light (mostly protons) to heavy (mostly Fe)
nuclei [5], the latter being too strongly bent in the interstellar magnetic fields for
the showers that they produce to point back to their sources. The main difference
between showers induced by protons and by iron nuclei results from the very
Figure 1.9 Energy dependence of <X
max
> and Rms(X
max
)
compared with the predictions
of air shower simulations using different hadronic interaction models.
Figure 1.8
Left: Fractional difference between the combined energy spectrum of the
PAO and a spectrum with an index of 2.6. Data from HiRes are shown for comparison.
Right: Combined energy spectrum comp
ared with several astrophysical models
including a pure composition of protons (red lines) or iron (blue line).
19
different natures of their first interaction in the upper atmosphere. The proton
shower starts to develop on average after having crossed one interaction length
and the depth of its starting point fluctuates with a variance also equal to one
interaction length. The iron shower may be seen as the superposition of 56 proton
showers (protons and neutrons are equivalent at such energies), each carrying
1/56 of the nucleus energy. As a result it starts much earlier, and the location of
its starting point fluctuates much less than in the proton case [6]. This is indeed
what is observed from the FD measurement of the shower longitudinal profiles
(Figure 1.9). Yet, the mass composition of UHECR primaries remains an open
question requiring more data to be collected.
1.3 Cosmic rays in Hanoi
Hanoi is located 12 m above sea level at 21
o
latitude N and 106
o
longitude
E where the geomagnetic rigidity cut-off reaches its world maximal value of
~17 GV. The cosmic ray flux has been measured at VATLY between 2001 and
2003 using scintillator detectors. Three successive measurements have been
done: first of the vertical cosmic muon flux [7], second of the zenith angle
distribution [8] and third of the east-west asymmetry [9]. We recall the main
results in the present sub-section.
At sea level, the cosmic ray flux of charged particles is dominated by
muons having a steep momentum spectrum with an average momentum of the
order of 4 GeV/c; the main contamination is a ~3% proton component and very
soft electrons and positrons. Neutral particles include slow neutrons and soft
photons.
The vertical muon flux at zero zenith angle and integrated over all
momenta was measured to be 71.5±2.8 m
–2
sr
–1
s
–1
in good agreement with a
model description of the muon flux over the whole planet [10]. The data were
taken during a period of low Sun activity; as we are now at maximal activity,
fluxes lower by a few percent might be expected.
20
The zenith angle (θ) distribution of the flux is well described by a form
(Φ
0
– asin
2
θ)cos
2
θ with Φ
0
= 72.0±1.6 m
–2
sr
–1
s
–1
and a=7.8±0.8 m
–2
sr
–1
s
–1
again in excellent agreement with the model of Reference 10. As primary cosmic
rays and atmospheric nuclei are both positively charged, a charge asymmetry
exists among the constituents of atmospheric cosmic showers and therefore
among the muons into which they may decay. The magnetic field being oriented
toward south, it bends positive primary particles eastward, resulting in an east-
west asymmetry of the flux that has been measured as a function of zenith angle
using the telescope shown in Figure 1.10. The amplitude of the asymmetry is
measured to increase from zero at θ=0
o
to nearly 20% at θ=60
o
. The resulting
Figure 1.11 East-west asymmetry measured in Hanoi [9] at
θ
= 50
o
(upper pannel) and
θ
= 65
o
(lower pannel).
Figure 1.10
Schematic view of the telescope used in Hanoi to measure the angular
dependence of the cosmic ray flux [8, 9].
21
azimuthal oscillations are displayed in Figure 1.11 for θ=50
o
and θ=65
o
respectively.
1.4 The VATLY Cherenkov detectors
A set of four Cherenkov detectors is installed on the roof of the VATLY
Laboratory. Their design and performance have been described in detail in
Reference 11. One of these, referred to as the main tank in the present work, is a
replica of a standard PAO tank (of which 1’660 are operated in the PAO array in
Argentina). As it is central to the present work, we briefly recall the main results
that have been previously obtained.
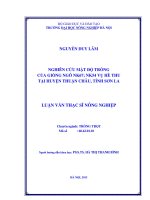
The main tank has been constructed in Hanoi with the same geometry as
that of the PAO tanks [12]: a cylinder of 3.6 m diameter (about 10 m
2
in area)
filled with clean water up to 1.2 m height. At variance with the PAO tank, which
Figure 1.12 Geometry used for the study of the main tank response as a f
unction of
incidence angle [13].
120 cm
162 cm
203 cm
120 cm
40 cm
20x20 cm
360 cm
The roof
O
22
is made of resin, the VATLY tank is made of stainless steel. The water volume is
seen by three down-looking PMTs at 120
o
azimuthal intervals on a radius of
1.25 m. In a first phase, the tank was equipped with old 8” diameter PMTs (EMI
D 340A), the inner walls were simply painted white and a rudimentary sand
based filter was used to purify city water. Early studies [13] using a fragmented
hodoscope trigger (Figure 1.12) have given evidence for a good proportionality
of the response to track length, but the number of photo-electrons per Vertical
Equivalent Muon (VEM) was ~10 times smaller than in the PAO [13]. The main
tank was completely refurbished in 2006 [14] by replacing the old PMTs by new
9” PMTs from the PAO (Photonis XP 1805) and by coating the internal walls
with aluminized mylar. An early attempt to use a Tyvek liner, as is done in the
PAO, failed because the water was not sufficiently filtered and iron oxide
deposited on the bottom of the liner and could not be washed away without
damaging it. As a consequence, the VATLY PMTs are directly in contact with
water, at variance with the PAO design where they see the water volume through
a transparent window of the liner. The refurbishing operation included a
complete redesign of the filtering station, with a maximal grain size of 1 µm
compared with 10 µm in the first phase; its performance is satisfactory and the
water quality is stable, although significantly inferior to that of the PAO. As
shown in the next section (2.4.3) the number of photo-electrons per VEM is now
~2.3 times less than in the PAO, a factor more than 4 times larger than in the first
phase. Photographs of the VATLY Cherenkov detectors are shown in Figure 1.13
and a plan view of the installation in Figure 1.14.
The front end preamplification of the PMT signals and the HV supplies
and dividers use the same electronics as in the PAO but the data acquisition
system differs: it is based on the NIM standard for the fast trigger logic and on
CAMAC for data recording, with simple Analogue-to-digital (ADC) and Time-
to-digital (TDC) converters rather than Flash ADCs as used in the PAO. The
PMT signals are fed to the electronics via 20 m 50 Ω coaxial cables through a
hole in the roof rather than being dispatched by radio as in the PAO.
23
Figure 1.14 Plan view of the VATLY Cherenkov counters including three small
(3’000 l) tanks used as a trigger and the large (12’000 l) main tank. All distances are
measured in centimeters.
Three satellite tanks have been used to provide an unbiased trigger for the
study of the main tank. They give a coincidence rate of 0.1 Hz with an effective
acceptance of 22 m
2
. The trigger selects vertical showers over an effective solid
angle of the order of 0.4 sr. Such showers have energies in the 200 GeV range
and a few permil probability of surviving at sea level with sufficient energy
112
392
170
325
230
160
130
305
40
200
215
145
185
100
y
x
0
1
2
3
Figure 1.13 Left: The main Cherenkov detector is seen surrounded by two of the
three
smaller ones, one of which is hidden behind the green tower. Right:
Addition of a
scintillator hodoscope to the main Cherenkov detector
; the lower part of the hodoscope
is located in the counting room below the roof.
24
density to be detected. Their cores have typical particle densities of 2.5 to 3 m
–2
and typical radii of 2 m.
1.5 Overview of the present work
The present thesis reports a number of measurements that have been
performed with the aim of gaining detailed information on the performance of
the main VATLY tank and learning about important features of the surface
detectors of the PAO concerning their response to low signals.
Section 2 reports on the response of the VATLY Cherenkov detector to
feed-through muons. We have assembled for this purpose a trigger scintillation
hodoscope, the design and performance of which are described in some detail.
The analysis of the Cherenkov data includes the selection of a clean sample of
relativistic feed-through muons and provides a calibration of the charge scale of
the detector in terms of Vertical Equivalent Muons (VEM).
Section 3 is an introduction to the problem of detecting electrons from the
decay of muons stopping in the water volume. The interest of this measurement
is to test the performance of the main tank in the region of low amplitude signals,
as electron signals are expected to be typically an order of magnitude smaller
than feed-through muon signals. A simulation of the decay and detection
processes allows for a general understanding of the problem and for estimates of
the rates and amplitudes that can be expected.
Section 4 is an introduction to the measurement of auto-correlation
distributions. Such distributions are one of the basic tools used in the present
work to disentangle a possible decay electron signal from a possible multimuon
signal (when two muons, from a same or different showers, are detected in the
main tank). An analytical description of the distribution is worked out and a
numerical simulation is presented that shows the separate effects of multimuons
and decay electrons, at the same time providing guidance on how to disentangle
them from real data.
25
Section 5 describes the experimental set-up being used for auto-
correlation measurements, including a sophisticated electronics arrangement
allowing to deal with high single rates, namely with low signal thresholds as
required for electron detection. The auto-correlation distribution proper and the
charge measurement are both described in some detail, together with comments
on their performance.
Section 6 is dedicated to the analysis of the data that have been collected
in several experimental conditions, including both auto-correlation and charge
distributions. The results are described and interpreted in Section 7. Section 8
summarizes the main findings and concludes.