Astm d 7066 04 (2011)
Bạn đang xem bản rút gọn của tài liệu. Xem và tải ngay bản đầy đủ của tài liệu tại đây (120.57 KB, 9 trang )
Designation: D7066 − 04 (Reapproved 2011)
An American National Standard
Standard Test Method for
dimer/trimer of chlorotrifluoroethylene (S-316) Recoverable
Oil and Grease and Nonpolar Material by Infrared
Determination1
This standard is issued under the fixed designation D7066; the number immediately following the designation indicates the year of
original adoption or, in the case of revision, the year of last revision. A number in parentheses indicates the year of last reapproval. A
superscript epsilon (´) indicates an editorial change since the last revision or reapproval.
2. Referenced Documents
1. Scope
2.1 ASTM Standards:2
D1129 Terminology Relating to Water
D1193 Specification for Reagent Water
D3370 Practices for Sampling Water from Closed Conduits
D3856 Guide for Management Systems in Laboratories
Engaged in Analysis of Water
D2777 Practice for Determination of Precision and Bias of
Applicable Test Methods of Committee D19 on Water
D5810 Guide for Spiking into Aqueous Samples
D5847 Practice for Writing Quality Control Specifications
for Standard Test Methods for Water Analysis
E168 Practices for General Techniques of Infrared Quantitative Analysis
E178 Practice for Dealing With Outlying Observations
1.1 This test method covers the determination of oil and
grease and nonpolar material in water and wastewater by an
infrared (IR) determination of dimer/trimer of chlorotrifluoroethylene (S-316) extractable substances from an acidified
sample. Included in this estimation of oil and grease are any
other compounds soluble in the solvent.
1.2 The method is applicable to measurement of the light
fuel although loss of some light ends during extraction can be
expected.
1.3 This method defines oil and grease in water and wastewater as that which is extractable in the test method and
measured by IR absorption at 2930 cm-1 or 3.4 microns.
Similarly, this test method defines nonpolar material in water
and wastewater as that oil and grease which is not adsorbed by
silica gel in the test method and measured by IR absorption at
2930 cm-1.
3. Terminology
3.1 Definitions—For definitions of terms used in this test
method, refer to Terminology D1129 and Practices E168.
1.4 This method covers the range of 5 to 100 mg/L and may
be extended to a lower or higher level by extraction of a larger
or smaller sample volume collected separately.
3.2 Definitions of Terms Specific to This Standard:
3.2.1 oil and grease—the organic matter extracted from
water or wastewater and measured by this test method.
3.2.2 nonpolar material—the oil and grease remaining in
solution after contact with silica gel and measured by this test
method.
3.2.3 solvent—dimer/trimer of chlorotrifluoroethylene (S316)
1.5 The values stated in SI units are to be regarded as
standard. No other units of measurement are included in this
standard.
1.6 This standard does not purport to address all of the
safety problems, if any, associated with its use. It is the
responsibility of the user of this standard to establish appropriate safety and health practices and determine (D3856 Guide
for Good Laboratory Practices)the applicability of regulatory
limitations prior to use.
4. Summary of Test Method
4.1 An acidified 250-mL sample of water or wastewater is
extracted serially with three 15-mL volumes of dimer/trimer of
1
This test method is under the jurisdiction of ASTM Committee D19 on Water
and is the direct responsibility of Subcommittee D19.06 on Methods for Analysis for
Organic Substances in Water.
Current edition approved May 1, 2011. Published June 2011. Originally
approved in 2004. Last previous edition approved in 2004 as D7066 – 04ε1. DOI:
10.1520/D7066-04R11.
2
For referenced ASTM standards, visit the ASTM website, www.astm.org, or
contact ASTM Customer Service at For Annual Book of ASTM
Standards volume information, refer to the standard’s Document Summary page on
the ASTM website.
Copyright © ASTM International, 100 Barr Harbor Drive, PO Box C700, West Conshohocken, PA 19428-2959. United States
1
D7066 − 04 (2011)
7.11 Repeating pipetter, glass, 15-mL, (optional).
chlorotrifluoroethylene (S-316). The extract is diluted to 50mL
and a portion is examined by infrared spectroscopy (IR) for an
oil and grease measurement.3 A portion of the extract is
contacted with silica gel to remove polar substances, thereby
producing a solution containing nonpolar material. The nonpolar material is measured by infrared spectroscopy.
7.12 Volumetric Pipettes, glass, various (0.50, 1.00, 5.00,
10.0 and 25.0-mL, including a 1.00 serological pipet graduated
in 0.01-mL increments and a 5.00-mL serological pipet graduated in 0.1-mL increments, or equivalent).
7.13 Benchtop shaker, (optional).
5. Significance and Use
7.14 Glass Stirring Rod, (optional).
5.1 The presence and concentration of oil and grease in
domestic and industrial wastewater is of concern to the public
because of its deleterious aesthetic effect and its impact on
aquatic life.
7.15 Analytical Balance.
7.16 Syringes, 50 and 500 mL.
8. Reagents
5.2 Regulations and standards have been established that
require monitoring of oil and grease in water and wastewater.
8.1 Purity of Reagents—Reagent grade chemicals shall be
used in all tests. Unless otherwise indicated, it is intended that
all reagents shall conform to the specification of the Committee
on Analytical Reagents of the American Chemical Society,
where such specifications are available. Other grades may be
used, provided it is first ascertained that the reagent is of
sufficiently high purity to permit its use without lessening the
accuracy of the determination.
6. Interferences
6.1 Soaps, detergents, surfactants and other materials may
form emulsions that may reduce the amount of oil and grease
extracted from a sample. This test method contains procedures
that can assist the analyst in breaking such emulsions.
6.2 Organic compounds and other materials not considered
as oil and grease on the basis of chemical structure may be
extracted and measured as oil and grease. Of those measured,
certain ones may be adsorbed by silica gel while others may
not. Those not adsorbed are measured as nonpolar material.
8.2 Purity of Water—Unless otherwise indicated, references
to laboratory or reagent water shall be understood to mean
reagent water conforming to Specification D1193, Type II.
7. Apparatus
All glassware that will come in contact with the sample
must be rinsed with dimer/trimer of chlorotrifluoroethylene
(S-316) prior to beginning this procedure.
8.4 Octanoic Acid 98 % minimum purity, for use in calibration.
8.3 Isooctane (2,2,4-trimethylpentane) 98 % minimum
purity, for use in calibration.
8.5 Silica Gel, Anhydrous, 75 - 150 micrometers, Davisil
Grade 923 (Supelco 21447-7A, or equivalent). Dry at
200–250°C for 24 hour minimum and store in a desiccator or
tightly sealed container. Determine the dimer/trimer of chlorotrifluoroethylene (S-316) soluble material content of the silica
gel by extracting 10 g of silica gel with 25 mL of dimer/trimer
of chlorotrifluoroethylene (S-316) and collect the elute in a
flask. Filter and fill a quartz cell for analysis by IR. The
dimer/trimer of chlorotrifluoroethylene (S-316) soluble material must be less than 5 mg/L.
7.1 Cell(s), quartz, 10-mm path length (lower concentrations may require a longer pathlength), two required for
double-beam operation, one required for single-beam
operation, or built-in or drop-in cell for infrared filtometer
analyzer operation.
7.2 Filter Paper, ashless, quantitative, general-purpose, 11cm, Whatman #40 or equivalent.
7.3 Glass Funnel.
7.4 Glass Wide Mouth Sample Bottle, minimum 250-mL,
with screw cap having a fluoropolymer liner.
8.6 Sodium Sulfate (Na2SO4), ACS, granular anhydrous.
Dry at 200-250 °C for 24 hours minimum and store in a tightly
sealed container until use. (Note: Powdered sodium sulfate
should not be used because water may cause it to solidify.)
7.5 Glass Graduated Cylinder, 100-mL
7.6 Infrared Spectrometer, double-beam dispersive, singlebeam dispersive, Fourier transform, filtometers or other capable of making measurements at 2930 cm-1.
8.7 Solvent - dimer/trimer of chlorotrifluoroethylene , IR
spectroscopy grade, for example S-316 manufactured by
Horiba Instruments, Irvine CA, 800-446-7422 (ASTM does not
advocate the use of one vendor over another)
7.7 Magnetic Stirrer, with small TFE-fluorocarbon stirring
bar.
8.8 Sulfuric Acid (1 + 1)—Slowly and carefully add 1
volume of sulfuric acid (H2SO4, sp gr 1.84) to 1 volume of
water, stirring and cooling the solution during the addition
(optional HCl replacement).
7.8 Glass Separatory-Funnel, 500mL, with fluoropolymer
stopcock and stopper.
7.9 Volumetric Flasks, glass, various (10, 25, 50, 100, and
200-mL).
8.9 Hydrochloric acid, ACS, 1 + 1. Mix equal volumes of
concentrated HCl and water
7.10 Teflon spritz bottle, one-piece wash bottle for rinsing.
8.10 Sodium Chloride (NaCl), crystalline, ACS—or use in
breaking emulsions, if needed. Wet thoroughly with solvent
before using.
3
Consult the manufacturer’s operation manual for the specific instructions
related to the infrared spectrometer or analyzer to be used.
2
D7066 − 04 (2011)
9. Sampling
and between laboratories with different wastewater matrices, calibration
with the known oil and grease in a sample should not be used in this
method.
9.1 Collect the sample in accordance with the principles
described in Practices D3370, using a glass bottle equipped
with a screw cap having a fluoropolymer liner. Prerinse the
sample bottle and cap with the solvent prior to sample
collection. Do not rinse the sample bottle with the sample to be
analyzed. Fill bottle with minimal headspace to prevent loss of
volatile constituants. Do not allow the sample to overflow the
bottle during collection. Preventing overflow may not be
possible in all sampling situations, however, measures should
be taken to minimize overflow at all times.
10.1 Calibration and Solvent Mixtures:
NOTE 2—The calibration procedure below calls for transferring, by
pipette or syringe, a volume of standard into a volumetric flask to obtain
a desired concentration. Transfer volumes have been rounded for ease of
measurement and calculation. It is highly recommended that calibration
standards be prepared on a weight basis (that is, pipette a volume into a
tared flask and weigh the amount pipetted), then converted to mg/mL by
using the densities of octanoic acid (0.9100 g/mL) and isooctane (0.6920
g/mL). A solution containing equal volumes of isooctane and octanoic
acid will have a density of 0.801 g/mL.To assure the most accurate
9.2 A sample of about 250mL is required for this test. Use
the entire sample because removing a portion would not
apportion the oil and grease that adheres to the bottle surfaces.
The high probability that extractable matter may adhere to
sampling equipment and result in measurements that are biased
low precludes the collection of composite samples for determination of oil and grease. Therefore, samples must be
collected as grab samples. If a composite measurement is
required, individual grab samples collected at prescribed time
intervals may be analyzed separately and the concentrations
averaged. Alternatively, samples can be collected in the field
and composited in the laboratory. For example, collect four
individual 63-mL samples over the course of a day. In the
laboratory, pour each 63-mL sample into the separatory funnel,
rinse each of the four bottles (and caps) sequentially with
10mL of solvent, and use the solvent for the extraction (Section
12.2.2). Do not exceed 50 mL of total solvent during the
extraction and rinse procedure.
concentrations, use the smallest serological pipet or syringe for
measurements. The volume should always be greater than 1⁄2
the volume of the pipet or syringe.
Ideally, a linear calibration curve will be obtained from these
standards. As discussed in Section 11, the concentrations of
these standards can be adjusted to stay within the linear range
of the IR instrument.
10.1.1 Calibration Stock Solution—Place 0.55 mL of octanoic acid and 0.72 mL of isooctane in a 10-mL volumetric
flask and fill to the mark with solvent. Mix well. The resulting
concentration is 50 mg/mL each octanoic acid and isooctane
(100 mg/mL total oil and grease). This solution will be termed
“Stock Solution”.
10.1.2 Diluted Stock Solution—Place 2.5 mL of the Stock
Solution to a 50-mL volumetric flask and fill to mark with
solvent. Diluted Stock Solution = 5.0 mg/mL (5000 µg/mL).
10.1.3 Calibration Solution A—Place 1.0 mL of Diluted
Stock Solution in a 10-mL volumetric flask and fill to the mark
with solvent. Calibration Solution A = 0.5 mg/mL (500 µg/mL),
equivalent to 100 mg/L oil and grease in a 250-mL water
sample extracted into a 50-mL volume of solvent.
10.1.4 Calibration Solution B—Place 0.50 mL of Diluted
Stock Solution in a 10-mL volumetric flask and fill to the mark
with solvent. Calibration Solution B = 0.25 mg/mL (250
µg/mL), equivalent to 50 mg/L oil and grease in a 250-mL
water sample extracted into a 50-mL volume of solvent.
10.1.5 Calibration Solution C—Place 0.20 mL of Diluted
Stock Solution in a 10-mL volumetric flask and fill to the mark
with solvent. Calibration Solution C = 0.1 mg/mL (100
µg/mL), equivalent to 20 mg/L of oil and grease in a 250-mL
water sample extracted into a 50-mL solvent volume.
10.1.6 Calibration Solution D—Place 0.10 mL of Diluted
Stock Solution in a 10-mL volumetric flask and fill to the mark
with solvent. Calibration Solution D = 0.050 mg/mL (50
µg/mL), equivalent to 10 mg/L of oil and grease in a 250-mL
water sample extracted into a 50-mL solvent volume.
10.1.7 Calibration Solution E—Place 0.05 mL of Diluted
Stock Solution in a 10-mL volumetric flask and fill to the mark
with solvent. Calibration Solution E = 0.025 mg/mL (25
µg/mL), equivalent to 5 mg/L of oil and grease in a 250-mL
water sample extracted into a 50-mL solvent volume.
9.3 Preserve the sample with a sufficient quantity of either
sulfuric (see Section 8.8) or hydrochloric acid (see Section 8.9)
to a pH of 2 or lower and refrigerate at 0-4°C from the time of
collection until extraction. The amount of acid required will be
dependent upon the pH and buffer capacity of the sample at the
time of collection. If the amount of acid required is not known,
make the pH measurement on a separate sample that will not be
analyzed. Introduction of pH paper to an actual sample or
sample cap may remove some oil from the sample. To more
accurately calculate the final oil concentration of the extract,
the volume of acid added to each sample can be recorded, then
subtracted from the final measured sample volume.
If the sample is to be shipped by commercial carrier, U.S.
Department of Transportation regulations limit the pH to a
minimum (see 40CFR Part 136, Table II Footnote 3) of 1.96 if
HCl is used and 1.15 if H2SO4 is used (see 49 CFR part 172).
Collect an additional 1 or 2 sample aliquots for the matrix spike
and matrix spike duplicate (Section 14.5) and preserve with
acid.
9.4 Refrigerate the sample at <4°C from the time of
collection until extraction. Freezing the sample may break the
bottle.
10. Preparation of Calibration and Spiking Solutions
10.2 Spiking Solution:
10.2.1 Transfer equal volumes of octanoic acid and isooctane in a volumetric flask, beaker, or jar. Mix well.
10.2.2 Pour 220 to 250 mL of water into a sample bottle.
Record the volume.
NOTE 1—The calibration standard specified in this procedure reflects
the objective of the test to detect recoverable oil and grease and nonpolar
material in wastewater with an unknown composition of oil and grease. In
a few cases, the composition of the oil and grease in a sample will be
known. However, in order to obtain consistent results between sample sets
3
D7066 − 04 (2011)
11.2 For double-beam operation, fill the reference cell and
the sample cell with solvent and scan from 3200 cm-1 (3.13
microns) to 2700 cm-1 (3.70 microns). A nearly horizontal,
straight line should be obtained. If not, check cells for
cleanliness, matching, etc. Drain and clean the sample cell. For
single-beam and infrared filtometer analyzers, obtain spectral
data for the solvent at this time. After running, drain, and clean
the sample cell.
10.2.3 Using a syringe, dispense 15 µL of the octanoic
acid/isooctane solution under the surface of the water. Cap the
bottle and shake well.
10.2.4 Calculate the total oil and grease concentration by
dividing 12.0 mg (mass of 15 µL for solution density of 0.801
g/mL assuming no loss of volume due to mixing) by the water
volume in liters (0.220 to 0.250 L).
10.2.5 Calculate the isooctane concentration by dividing
5.80 mg (mass of 7.5 µL of isooctane) by the water volume in
liters.
10.2.6 Calculate the octanoic acid concentration by dividing
6.83 mg (mass of 7.5 µL of octanoic acid) by the water volume
in liters.
10.2.7 If necessary, this solution can be made more or less
concentrated to suit the concentration needed for the matrix
spike. A fresh spiking solution should be prepared weekly or
bi-weekly.
11.3 Fill the sample cell with Calibration Solution E. Scan
as in 11.2; drain, and clean the sample cell.
11.4 Fill the sample cell with Calibration Solution D. Scan
as in 11.2; drain, and clean the sample cell.
11.5 Fill the sample cell with Calibration Solution C. Scan
as in 11.2; drain, and clean the sample cell.
11.6 Fill the sample cell with Calibration Solution B. Scan
as in 11.2; drain, and clean the sample cell.
11. Calibration
11.7 Fill the sample cell with Calibration Solution A. Scan
as in 11.2; drain, and clean the sample cell.
NOTE 3—The cell(s) used for calibration must be initially thoroughly
cleaned with solvent and dried prior to beginning the calibration procedure. To reduce the solvent expense, it may be prudent to use methylene
chloride or a solvent other than the solvent used for extraction. However,
all traces of methylene chloride or other solvent must be removed so that
they do not compromise the measurement. Baking the cell at an elevated
temperature to remove all traces of solvent is recommended. Cool cell to
room temperature before use.
11.8 For each double-beam spectrum obtained in 11.3 –
11.7, draw a baseline. Obtain the net absorbance for the peak
that occurs near 2930 cm-1 (3.41 microns). Obtain net values
for single-beam and infrared filtometer analyzer runs as recommended by IR manufacturer.
The same cell or matched cells should be used throughout the
calibration. Take care to avoid insertion of the cell stopper so
tightly that the cell could burst from expansion of its contents
as it resides in the light beam. It is desirable to flush the cell
compartment of the spectrometer with nitrogen or dry air to
prevent chemical reaction of solvent fumes with components of
the instrument. For double-beam operation, either block the
light beam from the reference cell containing solvent or
remove the reference cell from the instrument during the
intervals between scans in order to protect the solvent from
unnecessary warming. However, place the reference cell in the
reference beam during all scans. Rely upon recommendations
of the manufacturer for single-beam and infrared filtometer
analyzers because variations in design make it impractical to
offer instructions for their use with this method. Also, in
relation to infrared filtometer operation, reference to scanning
or running, or both, should be interpreted to mean obtaining a
reading or a plot at 2930-cm–1 or 3.4 microns.
In the procedure below, the IR instrument is calibrated from
0.025 to 0.5 mg/mL (25 to 500 µg/mL), equivalent to 5 to 100
mg/L of oil and grease in water, assuming a 250-mL sample
extracted into 50 mL of solvent. If the IR instrument cannot be
calibrated to 0.5 mg/mL (500 µg/mL), calibrate to a lesser
range, but always use 5 calibration points if the IR instrument
allows it. Ideally, the calibration curve obtained will be linear
(refer to Section 11.11). If linearity cannot be achieved past a
certain concentration, consider that concentration the upper
bounds of the calibration and adjust the calibration standards
accordingly. If a sample is encountered that exceeds the
calibration range, dilute the sample extract to bring the
concentration into the calibration range.
NOTE 4—For infrared instruments having computer capability, data may
be obtained automatically or as described in 11.9. However, all data must
be obtained consistently by one means or the other, not a combination of
the two.
11.9 For each point, subtract the response of the reference
blank (Section 11.2) from the response for the standard.
Calculate the calibration factor (CFx) in each of the five
standards using the reference-blank-subtracted response and
the following equation:
CFx 5 ~ H x 2 H RB! /C x
where:
CFx =
=
Hx
HRB =
=
Cx
(1)
calibration factor,
response of standard,
response of reference blank, and
concentration of standard.
11.10 Calculate the mean calibration factor (CFm), the
standard deviation of the calibration factor (SD), and the
relative standard deviation (RSD) of the calibration factor,
RSD 5 100 3 SD/CFm
(2)
where:
RSD = relative standard deviation of calibration factor,
SD = standard deviation of calibration factor, and
CFm = average of calibration factors (CFx).
11.11 If RSD ≤ 15 %, linearity through the origin can be
assumed and CFm may be used for calculations. If RSD >
15 %, a calibration curve must be used or the calibration
standards must be adjusted to bound the linear range (see
Section 11 note). Either the average calibration factor (CFm) or
the calibration curve is used, not both. Verification is done on
the chosen calibration.
11.1 The calibration contains a minimum of 5 nonzero
points and a solvent blank (Section 11.2).
4
D7066 − 04 (2011)
separatory funnel, Na2SO4, filter paper, and filter funnel with a
small (approximately 1-mL) portion of solvent and collect in
the volumetric flask
11.12 Verify calibration after each 10 analyses using calibration solution C or D, or alternating the calibration solutions.
Calibration is verified if CFX is within 615 % of CFm or its
respective point on the calibration curve.
NOTE 7—A milky extract indicates the presence of water. If the extract
is milky, remove the Na2SO4 cake (Section 11.2.5), add approximately 1
g of fresh Na2SO4 to the filter funnel, and pass the extract through the
Na2SO4 into a precleaned 50-mL volumetric flask.
11.13 If calibration is not verified, prepare a fresh calibration solution and repeat the calibration verification test (Section
11.12). If calibration is not verified with the fresh calibration
standard, recalibrate and reanalyze all extracts of all samples
analyzed since the last calibration or verification, whichever is
most recent.
12.2.8 Bring the solvent extract volume to 50 mL with
solvent.
12.2.9 To verify the pH is correct, dip pH paper into the
separatory funnel. Record the value.
12.2.10 Fill the sample bottle to the mark with water and
determine the sample volume, or weigh the empty sample
bottle and cap and determine the sample volume by difference,
assuming a sample density of 1.00 g/mL. Alternatively, the
actual sample density can be determined by weighing 100 mL
of the sample water in a tared 100-mL flask. Subtract the
volume of acid added to the sample, as recorded in 9.3.
12. Procedure
12.1 Sample Pretreatment:
12.1.1 Bring the sample and QC (that is, MS/MSD) aliquots
to room temperature.
12.1.2 Either mark the sample bottle at the water meniscus
or weigh the bottle for later determination of the sample
volume. Weighing will be more accurate.
12.2 Extraction:
12.2.1 Transfer the sample from the sample bottle to a clean
separatory funnel via a clean transfer funnel.
12.2.2 Place a filter paper in a filter funnel, add approximately 1 g of Na2SO4, rinse with a small portion of solvent and
discard the rinsate.
12.3 First Infrared Absorbance Measurement—Measure
and record the infrared absorbance of the extract in a manner
identical to that used for the calibration standards. If the
concentration of oil and grease exceeds the calibration range,
dilute extract to bring sample within calibration range. Keep a
record of each dilution for determination of the concentration
in the sample in 13.2.
NOTE 5—Use of the sodium sulfate is necessary to prevent water from
interfering in the determination. Because the sample is extracted three
times, it is not necessary to remove all of the solvent from the separatory
funnel; it is better to preclude water from reaching the sodium sulfate. If
the sodium sulfate cakes when contacted with the extract, flush once with
2 mL of solvent into the 50-mL volumetric flask. Remove the solid with
a clean spatula, and add about 1 g of fresh sodium sulfate to the filter.
Rewet sodium sulfate with solvent before use.
12.4 Silica Gel Treatment—For the removal of polar material for a nonpolar material measurement.
12.4.1 Place a filter paper in a filter funnel and add a
minimum of 3 g of silica gel. Rinse with a small portion of
solvent and discard the rinsate.
NOTE 8—The amount of silica gel needed has been estimated at 3 g for
every 100 mg of polar material. However, this amount may be insufficient
for some samples. If there is doubt about whether the amount of silica gel
is adequate, the amount needed should be determined by test.
12.2.3 Add 15 mL of solvent to the sample bottle. Cap with
the original cap and shake the sample bottle to rinse all interior
surfaces. Pour the solvent into the separatory funnel, rinsing
down the sides of the transfer funnel.
12.2.4 Extract the sample by shaking the separatory funnel
vigorously for 2 minutes with periodic venting into a hood to
release excess pressure. Vent the funnel slowly to prevent loss
of sample.
12.2.5 Allow the phases to separate.
12.2.6 Drain the solvent (lower) layer from the separatory
funnel through the sodium sulfate into a pre-cleaned 50-mL
volumetric flask.
12.4.2 Slowly pour an aliquot of the extract over the silica
gel and collect in a clean volumetric flask.
12.5 Second Infrared Absorbance Measurement—Measure
and record the infrared absorbance of the silica gel treated
extract in a manner identical to that used in 12.3. If the
concentration of non-polar material exceeds the calibration
range, dilute the extract to bring the concentration within the
calibration range. Keep a record of each dilution for use in
13.2.
NOTE 6—Certain types of samples, such as those containing a large
amount of detergent, may form an emulsion during the extraction. If
emulsion forms between the phases and the emulsion is greater than
one-third the volume of the solvent layer, the laboratory should employ
emulsion-breaking techniques to complete the phase separation. The
optimum technique depends upon the sample, but may include stirring,
filtration through glass wool, use of solvent phase separation paper,
centrifugation, use of an ultrasonic bath with ice, addition of NaCl,
increasing the temperature, lowering the pH, or other physical methods.
Alternatively, solid-phase extraction (SPE), continuous liquid-liquid
extraction, or other extraction techniques may be used to prevent emulsion
formation. If such an emulsion cannot be broken by any attempted means,
the test method is not applicable to the problem sample. Do not attempt to
proceed since accurate, quantitative results for the test are not obtainable.
13. Calculation
13.1 Determine the concentration of oil and grease and/or
nonpolar material in the extract (Ce) using the average calibration factor (CFm), the calibration curve (Section 11.11), or as
directed by the IR analyzer manufacturer.
13.2 Calculate the concentration of oil and grease or nonpolar material (Cs), or both, in the water sample as follows:
C s 5 C e 3 D 3 E/V
where:
Cs = concentration in the water sample in mg/L,
Ce = concentration in the extract in mg/mL,
12.2.7 Repeat the extraction (Section 12.2.2 – 12.2.6) twice
more with 15-mL portions of solvent. Rinse the tip of the
5
(3)
D7066 − 04 (2011)
D
E
V
sample preservation and pretreatment. Calculate the percent
recovery of the LCS using the following equation:
= dilution factor of extract from Sections 12.3 or 12.4, or
both,
= extract volume in mL, and
= sample volume in L.
% recovery 5 1001 @ 100* ~ concentration of LCS
2 true value! /true value#
14. Quality Control (QC)
In order to be certain that analytical values obtained using
this test method are valid and accurate within the confidence
limits of the test, the following QC procedures must be
followed when running the test:
14.1 Calibration and Calibration Verification—See Section
11 of this test method for the calibration procedure and
Sections 11.11 and 11.12 for the QC acceptance criteria for
calibration and calibration verification.
The LCS shall have a percent recovery of oil and grease in
the range of 59 % - 100 %.
If the result is not within these limits, analysis of samples is
halted until the problem is corrected, and either all samples in
the batch must be reanalyzed, or the results must be qualified
with an indication that they do not fall within the performance
criteria of the test method.
14.4 Method Blank (Blank)—Analyze a reagent water test
blank with each batch. The test blank must be taken through all
of the steps of the analytical method including sample preservation and pretreatment. The concentration of oil and grease
and/or nonpolar material found in the Blank must be less than
5 mg/L or 1/10 the concentration (which ever is lower) in the
sample under test. If the concentration of oil and grease and/or
nonpolar material is found above this level, analysis of samples
is halted until the contamination is eliminated and a blank
shows no contamination at or above this level, or the results
must be qualified with an indication that they do not fall within
the performance criteria of the test method.
14.2 Initial Demonstration of Laboratory Capability—If a
laboratory has not performed the test before or if there has been
a major change in the measurement system, for example, new
analyst, new instrument, and so forth, a precision and bias
study must be performed to demonstrate laboratory capability.
14.2.1 Analyze seven replicates of a standard solution
prepared from an aqueous independent reference material
(IRM) containing 50 mg/L of oil and grease and/or nonpolar
material. Spiking solution (10.2) may be used if it is from a
separate batch than that used for calibration. The matrix and
chemistry of the solution should be equivalent to the solution
used in the collaborative study. Be sure to record the concentration added to each replicate. This concentration is the “true
value” used in the below calculation. Each replicate must be
taken through the complete analytical test method including
any sample preservation and pretreatment steps. The replicates
may be interspersed with samples.
14.2.2 Calculate the mean, standard deviation, relative
precision, bias, and % recovery of the seven values using the
below equations:
Relative Precision 5 100* ~ std dev/mean!
(5)
14.5 Matrix Spike (MS)—To check for interferences in the
specific matrix being tested, perform an MS on at least one
sample from each batch of 20 samples. Spike an aliquot of the
sample with a known concentration of oil and grease and/or
nonpolar (Spiking solution, 10.2 may be used) and take it
through the analytical method including preservation and
pretreatment. Be sure to record the concentration of oil and
grease and non-polar material added.
14.5.1 The spike concentration plus the background concentration must not exceed the calibration range of the analytical
system. If the spike plus the background concentration exceeds
the calibration range, perform an appropriate dilution so that
the reading is within the calibration range. The spike must
produce a concentration in the spiked sample that is 2–5 times
the background concentration or 10 times the detection limit of
the test method, whichever is greater.
14.5.2 Calculate the percent recovery of both oil and grease
(POG) and non-polar material (PNP) by using the appropriate
values in the below formula.
(4)
Bias 5 100* ~ mean 2 true value! /true value
% Recovery 5 1001bias
The seven replicates must have an average % recovery of oil
and grease in the range of 59 % - 100 % with a relative
precision no grater than 8 %. If the relative precision and
average percent recovery are outside of theses limits, the initial
demonstration should be repeated.
If a concentration other than the recommended concentration
is used, refer to Practice D5847 for information on applying the
F test and t test in evaluating the acceptability of the mean and
standard deviation.
P OG 5 100 @ ~ A OG ~ V s 1V !! 2 B OGV s # /COGVs
(6)
where:
AOG = concentration of oil and grease found in spiked
sample,
BOG = concentration of oil and grease found in unspiked
sample,
COG = concentration of oil and grease analyte in spiking
solution ,
POG = percent recovery of oil and grease of matrix spike,
= volume of sample used, and
Vs
V
= volume of spiking solution added.
14.3 Laboratory Control Sample (LCS)—To insure that the
test method is in control, analyze an LCS containing 50 mg/L
of oil and grease and/or nonpolar material for each batch of 20
samples. The LCS can be the standard spiking solution (10.2)
adjusted for the midrange of analysis but it must be made
independently from the standard spiking solution. Commercial
verified standards are also acceptable. Be sure to record the
concentration added to the LCS. This concentration is the “true
value” used in the below calculation. The LCS must be taken
through all of the steps of the analytical method including
P NP 5 100 @ ~ A NP ~ V s 1V ! 2 B NP V s # /C NPV s
6
(7)
D7066 − 04 (2011)
analyze an IRM submitted as a regular sample (if practical) to
the laboratory at least once per quarter. The concentration of
the reference material should be in the range of 5 to 100 mg/L.
The value obtained must fall within the control limits specified
by the outside source. The spiking solution may be used as an
IRM.
where:
ANP = concentration of non-polar material found in spiked
sample,
BNP = concentration of non-polar material found in unspiked sample,
CNP = concentration of non-polar material analyte in spiking solution,
PNP = percent recovery of non-polar material of matrix
spike,
= volume of sample used, and
Vs
V
= volume of spiking solution added.
15. Precision and Bias4
15.1 The precision and bias data for this test method are
based on an interlaboratory validation study.
15.2 The test design of the study meets the requirements of
Practice D2777 for the analytes listed in this test method with
one exception. Due to the cost of performing the analysis, each
matrix tested contained only one set of Youden pair concentrations. In accordance with Section 1.5 of D2777, an exemption from the requirement for using three Youden pairs within
each matrix was granted by the Technical Operations Committee of D19 on the recommendation of the Results Advisor in
order to enable evaluation of the method based on more than
one matrix. The exemption specified that a single Youden pair
be used for each matrix and that the range of concentrations
represented by all three Youden pairs thus formed cover the
range of the test method.
14.5.3 The percent recovery of the matrix spike sample shall
be between 67 % and 100 % for oil and grease and between
35.5 % and 100 % for non-polar material.
If the percent recovery is not within these limits, a matrix
interference may be present in the sample selected for spiking.
Under these circumstances, one of the following remedies must
be employed: (1) the matrix interference must be removed, (2)
all samples in the batch must be analyzed by a test method not
affected by the matrix interference, or (3) the results must be
qualified with an indication that they do not fall within the
performance criteria of the test method.
14.6 Duplicate:
14.6.1 To check the precision of sample analyses, analyze a
sample in duplicate with each batch. If the concentration of the
analyte is less than five times the detection limit for the analyte,
a matrix spike duplicate (MSD) should be used.
14.6.2 Calculate the Relative Percent Difference (RPD)
between the matrix spike and matrix spike duplicate concentration using the below equation. The RPD shall be 8 % or less
for oil and grease and 17 % or less for non-polar material:
RPD 5 100* ~ conc of MS 2 conc of MSD! /conc of MS
15.3 The true values of the oil and grease concentrations
were determined using Freon-113 as a solvent, then diluted to
create the Youden pairs. Due to the nature of the sample
preparation, the exact true values may vary from those
reported, therefore the bias data presented here are “best
estimates.” In this case, the average recovery of the matrix
spike and matrix spike duplicate samples are a better estimate
of matrix interference than bias.
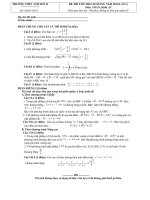
15.4 All calculated statistical parameters are presented in
Table 1. It is the user’s responsibility to ensure the validity of
precision and bias outside of the interlaboratory validation
study ranges and matrixes.
(8)
14.6.3 If the result exceeds the precision limit, the batch
must be reanalyzed or the results must be qualified with an
indication that they do not fall within the performance criteria
of the test method.
4
Supporting data have been filed at ASTM International Headquarters and may
be obtained by requesting Research Report RR:D19-1176. Contact ASTM Customer
Service at
14.7 Independent Reference Material (IRM)—In order to
verify the quantitative value produced by the test method,
7
D7066 − 04 (2011)
TABLE 1 Statistical Results of Interlaboratory Validation Study – S-316 Solvent
Analyte
Matrix
True Value (mg/L)
No. Participating Labs
No. Labs ReportedA
No. Values Retained
Mean (mg/L)
Overall Std Dev (mg/L)
Precision (%)
Bias (%)
Single Operator Std Dev
(mg ⁄L)
Avg Recovery of
MS and MSD (%)
Relative % Difference of
MS and MSD (%)
Site 1 – Can
Producer
55
9
8
7
30.5
14.4
47.1
−44.6
40
9
8
7
21.2
10.6
49.9
−47.0
Oil and Grease
Site 2 – Meat
Processor,
Clarifier Effluent
5
7
9
9
8
8
7
7
6.6
6.4
4.4
3.2
66.3
50.3
32.7
−8.9
3.7
Site 3 – Oil
Reprocessor
350
9
8
6B
429.9
159.8
37.2
22.8
2.6
470
9
8
6B
551.2
136.4
24.7
17.3
Site 1 – Can
Producer
55
9
7
7
11.2
3.9
34.3
NA
69.7
40
9
7
7
8.4
4.3
51.1
NA
Non-Polar Material
Site 2 – Meat
Processor, Clarifier
Effluent
5
7
9
9
7
7
7
7
4.4
2.9
4.56
2.5
105.5
85.9
NA
NA
1.1
Site 3 – Oil
Reprocessor
350
9
7
6B
314.4
93.0
29.6
NA
2.7
470
9
7
6B
454.5
124.7
27.4
NA
73.4
NA
72.4
NA
67.0
NA
79.2
NA
42.4
NA
70.3
NA
70.3
NA
8.26
NA
7.82
NA
4.74
NA
14.19
NA
17.4
NA
12.40
A
One laboratory failed the initial demonstration of laboratory capability, and thus is not considered to have returned valid results for any of the samples. One laboratory
disposed of its samples before performing the non-polar analysis.
B
Values obtained for Site 3 samples from one lab were extraordinarily high - over twice the known concentration - in contrast to those from other labs, which generally
were lower than the true concentration. Application of the single outlier procedure in Section 4 of ASTM Practice E178, “Standard Practice for Dealing With Outlying
Observations,” indicates that these results would be considered single outliers at a significance level of less than 0.5 %.
APPENDIX
(Nonmandatory Information)
X1. PRECISION AND BIAS
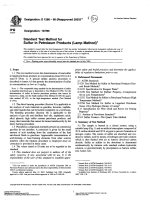
X1.1 The statistical parameters presented in Table X1.1
were derived from the interlaboratory method validation study,
but did not meet the requirements of 7.2.3 of Practice D2777.
The interlaboratory method validation study was designed to
evaluate the performance of two solvents—dimer/trimer of
chlorotrifluoroethylene (S-316) and dichloropentafluoropropane (AK-225) manufactured by AGC (www.ak-225.com).
Several labs reported problems calibrating or detecting low
levels of oil and grease using AK-225. Other labs used AK-225
with no issues, indicating the use of AK-225 is dependent on
the type and model of IR instrument used. The data presented
here is for reference or information only and may be useful if
another interlaboratory method validation study is performed.
8
D7066 − 04 (2011)
TABLE X1.1 Statistical Results of Interlaboratory Validation Study – AK-225
Analyte
Site 1 – Can
Producer
Matrix
True Value (mg/L)
No. Participating Labs
No. Labs ReportedA
No. Values RetainedB
Mean (mg/L)
Overall Std Dev (mg/L)
Precision (%)
Bias (%)
Single Operator Std Dev
(mg ⁄L)
Avg Recovery of MS and
MSD (%)
Relative % Difference of
MS an MSD (%)
55
9
7
6
33.5
12.8
38.2
−39.1
40
9
6
5
22.6
12.3
54.5
−43.6
Oil and Grease
Site 2 – Meat
Processor,
Clarifier Effluent
5
7
9
9
7
7
6
6
12.6
12.4
5.7
3.9
45.3
31.4
151
77.1
6.0
Site 3 – Oil
Reprocessor
350
9
7
6
458
114
24,9
30.7
3.7
470
9
6
4C
629
28.0
4.4
33.8
Site 1 – Can
Producer
55
9
7
6
19.5
5.9
30.4
NA
99.2
40
9
6
5
13.2
4.1
31.0
NA
Non-Polar Material
Site 2 – Meat
Processor, Clarifier
Effluent
5
7
9
9
7
7
6
6
5.0
3.6
6.4
3.8
130
104
NA
NA
2.1
Site 3 – Oil
Reprocessor
350
9
5
5
333
148
44.5
NA
2.3
470
9
5
4C
375
202
53.9
NA
76.4
NA
72.4
NA
78.8
NA
87.4
NA
47.6
NA
29.4
NA
76.1
NA
16.5
NA
17.7
NA
54.2
NA
27.8
NA
192
NA
21.9
A
Two laboratories failed the initial demonstration of laboratory capability, and thus are not considered to have returned valid results for any of the samples.
One laboratory reported non-detects for 10 of the 12 samples; all data from this laboratory are subsequently excluded, even though their 2 detected values (for oil & grease
at Site 3) did appear reasonable.
C
One laboratory reported a result of 1832 for oil and grease, nearly 3 times the mean recovery among the other laboratories, and a value of zero for non-polar material,
which are highly suspect results. Application of the single outlier procedure in Section 4 of ASTM Practice E178, “Standard Practice for Dealing With Outlying
Observations,” indicates that these results would be considered single outliers at a significance level of less than 0.1 %.
B
ASTM International takes no position respecting the validity of any patent rights asserted in connection with any item mentioned
in this standard. Users of this standard are expressly advised that determination of the validity of any such patent rights, and the risk
of infringement of such rights, are entirely their own responsibility.
This standard is subject to revision at any time by the responsible technical committee and must be reviewed every five years and
if not revised, either reapproved or withdrawn. Your comments are invited either for revision of this standard or for additional standards
and should be addressed to ASTM International Headquarters. Your comments will receive careful consideration at a meeting of the
responsible technical committee, which you may attend. If you feel that your comments have not received a fair hearing you should
make your views known to the ASTM Committee on Standards, at the address shown below.
This standard is copyrighted by ASTM International, 100 Barr Harbor Drive, PO Box C700, West Conshohocken, PA 19428-2959,
United States. Individual reprints (single or multiple copies) of this standard may be obtained by contacting ASTM at the above
address or at 610-832-9585 (phone), 610-832-9555 (fax), or (e-mail); or through the ASTM website
(www.astm.org). Permission rights to photocopy the standard may also be secured from the Copyright Clearance Center, 222
Rosewood Drive, Danvers, MA 01923, Tel: (978) 646-2600; />
9