physics in daily life [coll. of newspaper columns from europhysics news] - j. hermans (edp, 2012) ww
Bạn đang xem bản rút gọn của tài liệu. Xem và tải ngay bản đầy đủ của tài liệu tại đây (1.41 MB, 113 trang )
Physics
in Daily Life
ABOUT THE AUTHORS
P
rof. L.J.F. Hermans is Emeritus Professor of Physics at Leiden
University, The Netherlands. In addition to his academic teaching
and research career he was quite active in promoting and explaining
science for the general public. In this context he published, among
others, a book about Every-day science (in Dutch) and two books
about Energy (in Dutch and English). He is presently Science Editor
of Europhysics News. He was appointed Knight in the Order of Oranje
Nassau by Queen Beatrix in 2010.
Wiebke Drenckhan is CNRS researcher at the Laboratoire de
Physique des Solides at the outskirts of Paris, where she tries to unravel
the physical properties of soft materials, such as foams or emulsions. In
her spare time she fi nds great pleasure in letting scientifi c issues come
to life with pen and paper in the form of illustrations or cartoons.
JO HERMANS
With illustrations by Wiebke Drenckhan
17, avenue du Hoggar – P.A. de Courtabœuf
BP 112, 91944 Les Ulis Cedex A
Physics
in Daily Life
Tous droits de traduction, d’adaptation et de reproduction par tous procédés, réservés
pour tous pays. La loi du 11 mars 1957 n’autorisant, aux termes des alinéas 2 et 3 de
l’article 41, d’une part, que les «-copies ou reproductions strictement réservées à l’usage
privé du copiste et non destinés à une utilisation collective-», et d’autre part, que les
analyses et les courtes citations dans un but d’exemple et d’illustration, « toute repré-
sentation intégrale, ou partielle, faite sans le consentement de l’auteur ou de ses ayants
droit ou ayants cause est illicite » (alinéa 1
er
de l’article 40). Cette représentation ou
reproduction, par quelque procédé que ce soit, constituerait donc une contrefaçon
sanctionnée par les articles 425 et suivants du code pénal.
© EDP Sciences, 2012
Mise en pages : Patrick Leleux PAO
Imprimé en France
ISBN : 978-2-7598-0705-5
This is a collection of ‘Physics in Daily Life’ columns which appeared
in Europhysics News, volumes 34 - 42 (2003 – 2011)
5
CONTENTS
CONTENTS
Foreword 7
1. The human engine 11
2. Moving around effi ciently 14
3. Hear, hear 16
4. Drag‘n roll 19
5. Old ears 22
6. Fresh air 25
7. Diffraction-limited photography 28
8. Time and money 31
9. Blue skies, blue seas 33
10. Cycling in the wind 36
11. Seeing under water 39
12. Cycling really fast 41
13. Water from heaven 43
14. Surviving the sauna 45
15. Black vs. white 48
16. Hearing the curtains 50
17. Fun with the setting sun 52
18. NOT seeing the light 54
CONTENTS
PHYSICS IN DAILY LIFE
6
19. Thirsty passengers 57
20. The sauna – revisited 59
21. Refueling 62
22. Counting fl ames 64
23. Drink or drive 66
24. Feeling hot, feeling cold 68
25. The way we walk 70
26. Wine temperature 72
27. Over the rainbow 74
28. New light 77
29. Windmill nuisance 80
30. Fog and raindrops 83
31. Why planes fl y 85
32. Heating problems 87
33. Bubbles and balloons 89
34. Funny microwaves 92
35. Brave ducks 95
36. Muddy cyclist 98
37. Flying (s)low 100
38. Funny ice 103
39. Amazing candle fl ames 106
40. Capricious suntime 109
7
FOREWORD
FOREWORD
T
he history of Physics in Europe is one of brilliance and the sun
is still shining, indeed it is getting ever brighter, despite the
economic problems. The European Physical Society is a composite
of all the national physical societies and it occupies an important
role in providing advice to its members and a forum for discussion.
Its house journal, Europhysics News, is an exciting small publication,
packed with interesting articles about conferences, national societies,
highlights from European journals and ‘features’. In addition there has
been, for the past decade, a page entitled ‘Physics in Daily Life’. The
present volume is a collection of these pages and is a feast of erudition
and humour, by way of the excellent accompanying cartoons as well
as the subject matter.
It is easy for those of us steeped in our disciplines, of astrophysics,
condensed matter, nuclear physics, or whatever, to think that
‘everyday physics’ is child’s play compared with the deep subtleties
of our chosen subjects. Surely, if we can understand the mysteries
of parallel universes, the behaviour of superconductors or exotic
atomic nuclei, the V-shaped pattern of a duck’s wake in the lake at
the local Wildfowl Park will be a ‘piece of cake’. However, it would
be wise, before telling ones child/grandchild/lady or gentleman
friend or… to read the contribution ‘Brave Ducks’ herein. Quite
fascinating…
FOREWORD
PHYSICS IN DAILY LIFE
8
In a similar vein, the Astrophysicist who knows all about the recently
found bubbles in the interstellar medium just outside the heliopause,
and the Local Bubble in which the solar system is immersed, had
better read the ‘Bubbles and Balloons’ piece before setting himself
or herself up as an authority on such matters at the next Christmas
Children’s Party.
Michael Faraday, that physicist of genius, whose discoveries led to
the electrical power industry amongst many other things, lectured
for one hour on the physics and chemistry of the candle fl ame.
He probably knew the points made in ‘Amazing Candle Flames’
(contribution number 39) but I didn’t. Henceforth, my over-dinner
description of the candle fl ames at the table will be the envy of my
guests – even the physicists and chemists amongst them (unless they
happen to belong to the EPS).
Turning to our activities on the high seas, where many of us use
our SKI funds (‘Spending the kids’ inheritance’) to take exotic cruises,
we have the oft-sought ‘green fl ash’ from the sun as it sinks below
the horizon. Wearing our tuxedos and leaning over the rail with our
new-found friends, we have languidly explained what we should have
seen as the sun gently disappeared (only occasionally does it make
an appearance). Beware, however, your explanation may not be quite
right – ‘Fun with the setting sun’ (contribution number 17) will put
you right. Even one’s description of why the sea sometimes looks
blue may turn out to have been wrong! Better to take with you an
absorption curve for water, from 400-700 nm, to nonchalantly fi sh
out of your pocket at the appropriate moment.
Now to taxi-drivers, most are sources of information, freely
imparted, and their views are strongly held. In order to keep one step
ahead it would be wise to dip into our compendium and produce
such gems as ‘Hearing the Curtain’ (contribution number 16) which
relates to the reason why we all like to sing in the bath. The driver
will be enthralled when you explain that the sound absorption
properties of the curtains are the same whether they are drawn shut
9
FOREWORD
or quite open. Indeed it may lead to some interesting descriptions
of sights that the taxi driver himself has witnessed during his late
night excursions.
So, what about this collection? For me, at least, it scores 10/10
and I recommend it to all who have an interest in the physical
world and explanations of what seem to be – but are often not –
simple phenomena. Not only that, but buy it for your friends and
relatives.
Arnold Wolfendale
(Sir Arnold Wolfendale FRS is a Past-President of the EPS. He is
emeritus Professor of Physics in Durham University, UK)
© David Haldane.
7KLVSDJHLQWHQWLRQDOO\OHIWEODQN
11
1
The human engine
(and how to keep it cool)
W
e don’t usually think of ourselves in that way, but each of us
is an engine, running on sustainable energy. It differs from
ordinary engines in more than just the fuel. The human engine
cannot be shut off; for instance, it keeps idling even if no work is
required. This is needed to keep the system going, to keep our heart
pumping, for example, and to keep the temperature around 37 °C.
Because – and here is another difference – our human engine works
in a very small temperature range.
THE HUMAN ENGINE (AND HOW TO KEEP IT COOL)
PHYSICS IN DAILY LIFE
12
It’s interesting to look at this a bit more quantitatively. Our daily
food has an energy content of 8 to 10 MJ. That, incidentally, is
equivalent to a quarter of a litre of gasoline, barely enough to keep
our car going on the highway for about 2 minutes. Those 8 to 10 MJ
per day represent just about 100 W on a continuous basis. Only a
small fraction is needed to keep our heart pumping, as we can easily
estimate from a pΔV consideration (p being on the order of 10 kPa
and ΔV on the order of 0.1 litre, with a heart beat frequency of around
1 Hz).
In the end, those 100 W are released as heat: by radiation,
conduction and evaporation. Under normal conditions, sitting
behind our desk in our usual clothing in an offi ce at 20 °C, radiation
and conduction are the leading terms, while evaporation gives only a
small contribution. But when we start doing external work, on a home
trainer, for example, the energy consumption goes up, and so does
the heat production. Schematically, the total energy consumption P
tot
vs. external work P
work
is shown in the fi gure, where an effi ciency of
25% has been assumed. Thus, if we work with a power of 100 W, we
increase the total power by 400 W, and the heat part P
heat
by 300 W.
Now our body must try to keep its temperature constant. That’s
not trivial: if we don’t change clothing, or switch on a fan to make the
temperature gradients near our skin somewhat larger, the radiation
and conduction terms cannot change much. They are determined
by the difference between the temperature of our skin and clothing
on the one hand, and the ambient temperature on the other. When
working hard, we increase that difference only slightly. Granted, due
to the enhanced blood circulation, our skin temperature will get
closer to that of our inner body, but the limit is reached at 37 °C.
Fortunately, there is also the evaporation term. Sweating comes
to our rescue, as also, of course, does drinking! Each additional
100 W of released heat that has to be compensated by evaporation
requires a glass of water per hour (0.15 litre, to be more precise).
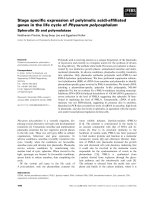
The various terms are schematically shown in the figure.
One conclusion: heavy exercise requires evaporation. Don’t try to
swim a 1000 m world record if your pool is heated to 37 °C. You might
not live to collect your prize, because where would the heat go?
13
THE HUMAN ENGINE (AND HOW TO KEEP IT COOL)
Image 1.1 | Total energy production, heat production and heat release vs. external
mechanical power, schematically.
PHYSICS IN DAILY LIFE
14
2
Moving around effi ciently
E
ver considered the effi ciency of a human being moving from A
to B? Not by using a car or a plane, but just our muscles. Not
burning oil, but food.
Many physicists will immediately shout: A bike! Use a bicycle! It is
because we all know from experience that using wheels gets us around
about fi ve times as fast as going by foot with the same effort.
But just how effi cient is a bike ride? First, we have to examine the
human engine. The power we produce is easily estimated by climbing
stairs. If we want to do that on a more or less continuous basis, one
step per second is a reasonable guess. Assuming a step height of 15 cm
15
MOVING AROUND EFFICIENTLY
and a mass of 70 kg, this yields a power of roughly 100 W. Mountain
climbers will fi nd the assumed vertical speed quite realistic, since it
takes us about 500 m high in an hour, and that is pretty tough exercise.
Riding our bike is pretty much like climbing the stairs: same
muscles, same pace. In other words, we propel our bike with about
100 W of power. But that is not the whole story. The effi ciency of
our muscles comes into play. For this type of activity, the effi ciency is
not so bad (a lot better than e.g. weight lifting). We may reach 25%.
The total energy consumption needed for riding is therefore around
400 W.
What does this tell us about the overall transport effi ciency? How
does this compare with other vehicles? Now it’s time to do a back-of-
the-envelope calculation. If we express 400 W of continuous energy
use in terms of oil consumption per day, we fi nd pretty much exactly
one litre per day, given that the heat of combustion for most types
of oil and gasoline is about 35 MJ per litre. In other words: if, for
the sake of the argument, we ride for 24 hours continuously without
getting off our bike, we have used the equivalent of 1 litre of gasoline
for keeping moving. How far will that get us? That, of course, depends
on the type of bike, the shape of the rider, and other parameters. If we
take a speed of 20 km/h as a fair estimate, the 24 hours of pedaling
will get us as far as 480 km. In other words: a cyclist averages about
500 km per litre.
That’s not bad, compared to a car, or even a motorbike. So, we
should all ride our bike if we want to conserve energy? Careful, there
is a catch. We have been moving on food, not gasoline or oil. And it
takes a lot more energy to get our food on the table than its energy
content may suggest. A glass of milk, for example, takes roughly 0.1
litre of oil, and a kg of cheese even about 1 litre. It’s because the
cow has to be milked, the milk has to be cooled, transported, heated,
bottled, cooled again, transported again, etc. It’s the same (or worse)
for cheese, meat, etc.
Conclusion: Riding our bike is fun. It’s healthy. It keeps us in good
shape. And, if we have to slim down anyway, it conserves energy.
Otherwise – I hate to admit it – a light motorbike, if not ridden too
fast, might beat them all.
PHYSICS IN DAILY LIFE
16
3
Hear, hear
E
ven a tiny cricket can make a lot of noise, without having to
‘refuel’ every other minute. It illustrates what we physicists
have known all along: audible sound waves carry very little energy.
Or, if you wish, the human ear is pretty sensitive – if the sound
waves are in the right frequency range, of course.
Exactly how our ears respond to sound waves has been sorted
out by our biophysical and medical colleagues, and is illustrated
by the familiar isophone plots that many of us remember from
the textbooks. They are reproduced here for convenience.
17
HEAR, HEAR
Image 3.1 | Isophone curves, with vertical scales in dB (left) and W/m
2
(right).
Each isophone curve represents sound that seems to be equally
loud for the average person.
The fi gure reminds us that the human ear is not only rather sensitive,
but that it also has an astonishingly large range: 12 orders of magnitude
around 1 kHz. This is, in a way, a crazy result, if we think of noise
pollution. It means that, if we experience noise loud enough to reach
the threshold of pain, and we assume that the sound intensity decays
with distance as 1/r
2
, we would have to increase the distance from the
source r by a factor of 10
6
to get rid of the noise. Or, if we stand at
10 m from the source, we would have to walk away some 10 000 km.
Here we have assumed that the attenuation can be neglected, since
we have been taught that sound wave propagation is an adiabatic
process. Obviously, real life isn’t that simple. There are several
dissipative terms. For example, think of the irreversible heat leaks
between the compressed and the expanded air. An interesting feature
here is that the classical absorption coeffi cient is proportional to the
frequency squared, which makes distant thunder rumble. Then there
is attenuation by obstacles. In addition, there is the curvature of the
earth, and the curvature of the sound waves themselves, usually away
from the earth due to the vertical temperature gradient. Without loss
terms like these, forget a solid sleep.
HEAR, HEAR
PHYSICS IN DAILY LIFE
18
A second feature worth noticing is the shape of the curves. Whereas
the pain threshold curve is relatively fl at, the threshold of hearing
increases steeply with decreasing frequency below 1 kHz. If we turn
our audio amplifi er from a high to a low volume, we tend to loose the
lowest frequencies. The ‘loudness control’ is intended to compensate
for this.
Finally, it is interesting to notice the magnitude of the sound
intensity. How much sound energy do we produce when we speak?
Let us assume that the listener hears us speak at an average sound
level of 60 dB, which corresponds to 10
–6
W/m
2
as seen from the
right-hand vertical scale. Assuming that the listener is at 2 m, the
energy is ‘smeared out’ over some 10 m
2
. This means that we produce,
typically, 10
–5
W of sound energy when we talk. That is very little
indeed. During our whole life, even if we talk day and night and we
get to live 100 years, we will not talk for more than 10
6
hours. With the
above 10
–5
W, this means a total energy of 10 Wh. Even at a relatively
high price of € 0.50/kWh, this boils down to less than one cent for
life-long speaking. Cheap talk, so to speak.
19
4
Drag‘n roll
W
hether we ride our bike or drive our car, there is resistance
to be overcome, even on a flat road; that much we know. But
when it comes to the details, it’s not that trivial. Both components
of the resistance – rolling resistance and drag – deserve a closer
look. Let’s first remember the main cause of the rolling resistance.
It’s not friction in the ball bearings, provided they are well greased
and in good shape. It’s the tires, getting deformed by the road. In a
way, that may be surprising: the deformation seems elastic, it’s not
permanent. But there is a catch here: the forces for compression
are not compensated for by those for expansion of the rubber
DRAG‘N ROLL
PHYSICS IN DAILY LIFE
20
(there is some hysteresis, if you wish). The net work done shows
up as heat.
The corresponding rolling resistance is, to a reasonable
approximation, independent of speed (which will become obvious
below). It is proportional to the weight of the car, and is therefore
written: F
roll
= C
r
mg, with C
r
the appropriate coefficient. Now
we can make an educated guess as to the value of C
r
. Could it
be 0.1? No way: this would mean that it would take a slope of
10% to get our car moving. We know from experience that a 1%
slope would be a better guess. Right! For most tires inflated to the
recommended pressure, C
r
= 0.01 is a standard value. By the way:
for bicycle tires, with pressures about twice as high, C
r
can get as
low as 0.005.
The conclusion is that, for a 1000 kg car, the rolling resistance
is about 100N.
What about the drag? In view of the Reynolds numbers involved
(Re ≈ 10
6
) forget about Stokes with its linear dependence on
speed v.
Image 4.1 | Rolling resistance, air resistance (‘drag’) and their sum, for a 1000 kg model car.
21
DRAG‘N ROLL
Instead, we should expect the drag F
D
to be proportional to ½ ρv
2
,
as already suggested by Bernoulli’s law (ρ is the air density). On a
vehicle with frontal area A, one can write F
D
= C
D
·A·½ρv
2
. Now, C
D
is
a complicated function of speed, but for the relevant v-range we may
take C
D
constant. For most cars, the value is between 0.3 and 0.4.
The total resistance is now shown in the fi gure, for a mid-size
model car (m=1000 kg, C
r
= 0.01, C
D
= 0.4 and A=2 m
2
).
It is funny to realize that the vertical scale immediately tells us
the energy consumption. Since 1 N is also 1 J/m, we fi nd that at
100 km/h this is approximately 500 kJ/km for this car. Assuming an
engine effi ciency of 20%, this corresponds to about 7 litres of gas
per 100 km. At still higher speeds, the fi gure suggests a dramatic
increase in the fuel consumption. Fortunately, it’s not that bad, since
the engine effi ciency goes up, compensating part of the increase.
What about the engine power P? Since P = F·v, we fi nd at 100 km/h
about 15 kW. That’s a moderate value. But note that, at high speed
where drag is dominant, the power increases almost as v
3
! Should we
want to drive at 200 km/h, the engine would have to deliver 8-fold
the power, or 120 kW. That’s no longer moderate, I would say, and
I’m sure the police will agree…
PHYSICS IN DAILY LIFE
22
5
Old ears
I
f you are under, say, 35, you might as well stop reading: you should
have no reason to worry about your ears. But for many of us who
are somewhat older, a noticeable hearing loss may become a bit
cumbersome every now and then. And as it turns out, the loss is
worst where it hurts most: in the high frequency regime.
Let us fi rst look at the data. In the fi gure, hearing loss data are given
as a function of frequency for a large sample of people at various
ages (Courtesy: Dr. Jan de Laat, Leiden University Medical Center).
And indeed, already at age 60, the loss of high-frequency tones is
frightening: over 35 dB at 8 kHz, increasing about 10 dB for every
23
OLD EARS
Figure 5.1 | Average hearing loss as a function of frequency, for persons aged 30 – 85.
5 years of age. Once we’re 80, we’ll be practically deaf for 8 kHz
and up.
Why is hearing loss at the higher frequencies so bad? When listening
to our stereo at home, we can turn up the treble a bit for compensation,
no problem. And in a person to person conversation, we don’t really
have problems either, until we are having this conversation at some
cocktail party. Then we notice: the background noise makes things
worse.
One aspect playing a role here concerns consonants like p, t, k,
f and s. They contain mainly high-frequency information, and will
therefore easily be masked, or will get mixed up. Another aspect
relates to the role of sound localization in selecting one conversation
out of a background noise (sometimes referred to as the ‘cocktail
party effect’). We are pretty good at localizing sound: up to 1-2
o
in
the forward direction (see William M. Hartmann in Physics Today,
November 1999, p. 24 ff).
We use two mechanisms to do that. First, by using the phase- (or
arrival time) difference between the two ears: the Interaural Time
Difference (ITD). Of course, the information is unambiguous only if
OLD EARS
PHYSICS IN DAILY LIFE
24
the wave length is large compared to the distance between our ears.
ITD is therefore effective only at the lower frequencies, say, below
1.5 kHz. However, in ordinary rooms and halls, refl ected sound
often dominates, especially for low frequencies. This is because the
acoustical absorption decreases with decreasing frequency for almost
all refl ecting surfaces. As a result, the ITD becomes unreliable in such
situations, and the low frequencies are not much of a help to spatially
isolate one conversation from the noise.
Fortunately, we have a second mechanism, which uses the intensity
difference between the two ears for sound coming from aside: the
Interaural Level Difference (ILD). We remember that sound waves
become effectively diffracted when their wavelength is much shorter
than our head: the head casts a shadow, so to speak. Therefore, ILD
works well above, say, 3 kHz.
Alas, look at the graph: the high-frequency region is where old ears
have problems. So the ILD doesn’t work too well either. In the end,
we may have to resort to what deaf people do all along: use our eyes,
and see the talking…