ultrafast spectroscopy of cdse nanocrystals morphological and environmental effects on nonradiative and nonadiabatic relaxation
Bạn đang xem bản rút gọn của tài liệu. Xem và tải ngay bản đầy đủ của tài liệu tại đây (558.15 KB, 7 trang )
Ultrafast Spectroscopy of CdSe Nanocrystals: Morphological and
Environmental Effects on Nonradiative and Nonadiabatic Relaxation
Bryan T. Spann and Xianfan Xu*
School of Mechanical Engineering and Birck Nanotechnology Center, Purdue University, West Lafayette, Indiana 47907, United
States
ABSTRACT: Ultrafast transient absorption spectroscopy was employed to
investigate intraband relaxation and coherent acoustic phonons in quantum dots
(QDs) and quantum rods (QRs) of various sizes. We found that the hot
electrons and hot holes relaxed through a nonradiative Auger thermalization
mechanism that circumvents the phonon bottleneck effect, resulting in sub-2.5
ps intraband relaxation times. The QRs showed an increased intraband
relaxation time when compared with QDs as a result of the formation of a 1D
exciton along the axial dimension, which partially mitigates the Auger
thermalization mechanism. The longer intraband relaxation times for QRs
suggest that QRs would act as better sensitizers for hot electron nanocrystal
solar cells. The QD samples prepared in thin-film form showed longer intraband
relaxation times when compared with their colloidal counterpart; this is a result
of the hydrazine treatment used, which mitigates the dominant ligand relaxation pathway for holes. Furthermore, we found that
the frequencies of coherent acoustic phonon modes were reduced for both QD and QR thin-film samples as a result of
neighboring NC interaction, suggesting that there is a strong dependence on environmental conditions that govern the
nonadiabatic relaxation.
■
INTRODUCTION
Semiconducting nanocrystals (NCs) exhibit unique electronic
structures that have potential to be exploited in various ways.
Delicate control of NC size and morphology provides precisely
tuned electronic levels between that of molecular and bulk
phases.
1
In general, volumetrically smaller NCs facilitate
sharper transitions between electronic states, while larger
NCstendtowardbulk-likeelectronicstructures,with
broadened transitions. NC geometry can also lend itself to
electronic transition control.
2
Synthesis of various morpholo-
gies has been demonstrated in CdSe, such as quantum dots
(QDs),
3
quantum rods (QRs),
4
quantum tetrapods (QTs),
5
and quantum wires (QWs).
6
Through size and morphological
control, various novel devices and technologies have come to
fruition, for example, nanocrystal solar cells (NCSC),
7
lasers,
8
and LEDs.
9
Here, we focus our study on aspects of NC
implementation into solar cells.
Perhaps one of the most intriguing properties of semi-
conducting NCs is the modification of excited-state electron
relaxation. It has been shown in our earlier work as well as by
others that the geometrical modifications can directly modify
electron relaxation pathways.
6,10−12
For example, by elongating
a QD to create a QR, one can maintain quantum confinement
in the radial direction, thus controlling the band edge exciton
energy, while the axial dimension can be used to control Auger
phenomena.
10−12
In particular, we showed previously that QRs
show a reduction in the Auger thermalization mechanism, that
is, when a high-energy electron scatters its energy with a more
massive hole.
12
The Auger thermalization process circumvents
the phonon bottleneck effect; therefore, suppressing it is of
paramount importance in hot carrier solar cells.
In this work, we build upon our previous efforts
12
to
thoroughly investigate the effects of NC confinement,
morphology, and environment on excited-state properties
using ultrafast transient absorp tion (TA) spectroscopy.
Specifically, we directly compare nonradiative hot exciton
relaxation times of three sets of QDs and QRs. The three sets
of QDs and QRs are of different sizes; however, each set is
controlled such that their band edge energies are similar. By
employing this strategy, we can decipher which morphology
will have more optimal intraband relaxation times without
ambiguity and thus distinguish which morphology will be best
suited for NCSC applications. Furthermore, we study both
colloidal and thin-film versions of the NCs to establish the
differences between NC excited-state properties in suspension
and those in an in situ type device environment. By studying
the hydrazine-treated thin-film samples, we are able to
simultaneously observe the effects of removing the organic
ligands from the surface, which have been found to provide a
relaxation pathway for the holes in CdSe.
13,14
Finally, we
investigate nonadiabatic relaxation by comparing coherent
acoustic phonon modes in both the colloidal and thin-film
NC environments, which show non-Condon-like behavior in
their coherent vibrational modes as a result of neighboring NC
interactions.
Received: November 15, 2013
Revised: January 10, 2014
Published: January 12, 2014
Article
pubs.acs.org/JPCC
© 2014 American Chemical Society 2844 dx.doi.org/10.1021/jp4112553 | J. Phys. Chem. C 2014, 118, 2844−2850
■
EXPERIMENTAL DETAILS
The CdSe NCs were synthesized by NN-Laboratories
(Fayetteville, AK, U.S.A.) using wet chemistry techniques
such as those described by Murray et al.
3
and Peng et al.
4
QD
samples were synthesized wi th different diameters, each
dispersed in toluene solvent and stabilized using surface-
attached octadecyl amine (ODA) organic capping ligands. QR
samples were synthesized with diameters of approximately 3, 4,
and 5 nm and constant lengths of ∼11 nm. The QR samples
were stabilized by the following organic capping ligands:
octadecanephosphonic acid (ODPA), trioctylphosphine oxide
(TOPO), and oleylamine for the 3 nm diameter sample; ODPA
and TOPO for the 4 nm diameter sample; and 2-octenoic acid
for the 5 nm diameter sample. Sample concentrations were
controlled to be 2.5 mg/mL of CdSe to toluene solvent for the
colloidal samples.
Details of NC size and morphology were studied by means of
high-resolution transmission electron microscopy (HRTEM).
Each NC sample was drop-cast from solution onto copper grids
for imaging. A Titan 80−300 kV TEM was used for imaging.
The c rystalline phase was determined by digital image
processing from the TEM images (ImageJ software was used).
This work focuses on both colloidal and film forms of sample
preparation to test for NC environmental effects on electronic
relaxation. Even though many prior studies have focused on
colloidal NCs, a vast majority of proposed optoelectronic and
solar applications require film-cast NCs rather than colloids.
7−9
To prepare the thin-film samples, the following dip-coating
procedure was used: first, a cleaned quartz substrate was dipped
into the NC solutions with concentrations of 5.0 mg/mL of
CdSe to toluene solvent. Next, it was dipped into a mixture of
30 μL of hydrazine hydrate in 10 mL of deionized water.
Finally, it was dipped into 15 mL of acetonitrile for final
cleaning. After each dip, a nitrogen gun was used to assist with
drying between dipping processes. The aforementioned dip
procedure was performed 20 times for each sample.
Linear absorption (LA) and TA spectroscopy was used to
investigate ground-state and excited-state electronic properties
of the NC samples. A Perkin−Elmer Lambda 950 was used for
the LA measurements for both colloidal (2 mm path length
cuvette) and thin-film samples. For the TA studies, a two-color
pump−probe scheme was employed. The pump and probe
beam are derived from a Spectra Physics amplified ultrafast
laser system with 70 fs pulses centered at 800 nm with a 5 kHz
repetition rate. The probe beam is sent into an optical
parametric amplifier (OPA) with a wavelength range from 450
to 2500 nm. The output beam from the OPA is sent to an
optical delay stage and is then split into reference and signal
beams, with the former going to one side of a balanced
photodetector and the latter going through the sample and then
into the other side of the balanced photodetector. The pump
beam is sent through a barium borate (BBO) crystal to
generate frequency-doubled 400 nm light, sent though an
optical chopper (500 Hz), and finally focused into the sample.
Spot sizes for the pump and probe beams are focused on the
samples noncollinearly to 1/e
2
spot diameters of 320 and 150
μm for the pump and probe, respectively. A low pump fluence
of approximately 5 μJ/cm
2
is used to ensure the absence of
multiparticle Auger recombination.
7
The balanced photo-
detector signal is sent to a signal preamplifier and lock-in
amplifier for ∼10
−6
signal detection ability. Typical scans
consist of 20 passes of the optical delay stage while averaging
over 1000 pulses per temporal delay step. In addition, colloidal
samples are stirred via a magnetic stir bar during each TA
experiment to reduce potential photodegradation and charg-
ing.
15
■
RESULTS AND DISCUSSION
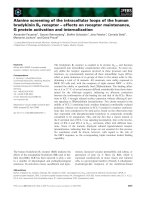
Structural Characterization. The TEM images of QDs
and QRs are shown in Figure 1. Upon analyzing the TEM
images, the QD samples in Figure 1A−C have diameters of 4.5,
6.0, and 7.4 nm, respectively. The QR samples presented in
Figure 1D−F each have lengths of roughly 11 nm and
diameters of 3.0, 4.0, and 5.0 nm, respectively. A summary of
the synthesized NCs can be found in Table 1, with ±1 standard
deviation values based on TEM image analysis.
Figure 1. TEM images of QDs (A−C) and QRs (D−F).
The Journal of Physical Chemistry C Article
dx.doi.org/10.1021/jp4112553 | J. Phys. Chem. C 2014, 118, 2844−28502845
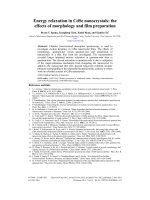
HRTEM images were also obtained in order to identify the
crystalline phase of the NCs. Representative HRTEM images
are presented in Figure 2A and C, with corresponding fast
Fourier transform (FFT) data of the QD3 and QR3 samples
shown in panels B and D, respectively. All NCs were
predominantly in the zinc blende cubic phase. We were able
to identify the spacing between adjacent crystal planes as d ≈
0.35 nm, which matches well with the standard published data
of d = 0.351 nm for the (111) planar spacing of zinc blende
cubic CdSe.
16
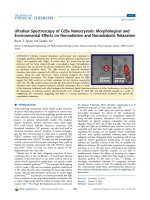
Optical Characterization. LA data for colloidal and thin-
film samples are shown in Figure 3A and B for the QDs and
QRs, respectively. In an attempt to directly compare intraband
relaxation rates between morphologies, QDs were in fact
chosen to match the band edge energies of the QR samples.
For example, the peak of the 1S transitions of QD1 is
comparable in wavelength to that of QR1, approximately 600
nm, and similarly for QD2−QR2 (∼625 nm) and QD3−QR3
(∼650 nm). In regard to sample preparation, as illustrated in
Figure 3, the film samples show electronic state splitting, as is
evident by the broadening near the band edge states; this is
likely due to electronic wave function overlap between the
closely spaced NCs in the films.
17,18
It should be noted that all
spectra in Figure 3 have been normalized to the 1S transition
for easy comparison. For reference of scale, each colloidal
sample had an absorbance at the 1S transitions of roughly 30
mOD, whereas the thin-film samples had a 10−20 mOD
absorbance at the 1S transition.
Intraband Relaxation Studies. We employed TA spec-
troscopy to understand the ultrafast physical processes in NCs.
An important phenomenon during TA spectroscopy measure-
ments is the carrier-induced Stark effect (CISE), which was
proposed by Norris et al.
19
and confirmed by others.
12,20
The
CISE is the result of spatial confinement of an exciton in NCs,
which leads to a DC Stark field in the NC. The DC Stark field
causes neighboring electronic transitions to repel one another.
It was shown that the CISE can be qualitatively described by
the second derivative of the linear absorbance spectra.
20
To
illustrate, we calculated the second derivative of the linear
absorbance, and an example (QR2 thin-film) is shown in Figure
4A by the dashed line. We then used several probing energies
around the 1S transition to query theoretical agreement. Near
the band edge energy, the minimum of the second derivative
data is marked by B1 for photoinduced bleaching, and the
maximum is noted as PA for photoinduced absorption.
20
The
results of the TA experiment for the QR2 thin-film sample are
shown in Figure 4B and are in agreement with the CISE
picture. The blue trend in Figure 3B corresponds to the
maximum TA signal. The maximum bleaching signal can be
descr ibed by the superposition of three indistinguishable
photophysical phenomena, stimulated emission, spontaneous
Table 1. Sample Geometries with ±1 Standard Deviation
Values Obtained via TEM Image Analysis
sample diameter (nm) length (nm)
QD1 4.5 ± 0.2 na
QD2 6.0 ± 0.4 na
QD3 7.4 ± 0.6 na
QR1 3.0 ± 0.1 11 ± 2
QR2 4.0 ± 0.1 11 ± 2
QR3 5.0 ± 0.2 11 ± 2
Figure 2. HRTEM images of QD3 (A) with respective FFT data (B)
of the selected region shown by the dashed circle. Similarly, (C) shows
HRTEM of QR3 with respective FFT data (D) of the selected region
shown by the dashed circle.
Figure 3. Linear absorbance of colloidal (solid lines) and thin-film (dashed lines) (A) QDs and (B) QRs.
The Journal of Physical Chemistry C Article
dx.doi.org/10.1021/jp4112553 | J. Phys. Chem. C 2014, 118, 2844−28502846
emission, and state-filling induced bleaching (as a result of the
Pauli exclusion principle).
13,20
As we probe further to the red to
test for PA, we see that there is a negative dip in the TA data,
which signifies that once the pump photon has arrived, the
CISE causes a red shift in the band edge energy; thus, the
lower-energy probe photons can be absorbed. Once this level is
saturated, the same three photophysical processes for the B1
probe become possible. All colloid and thin-film samples were
tested and were in agreement with the CISE theory and
exhibited similar trends to that of the example given in Figure 4.
As mentioned above, an overarching goal of this work is to
establish which morphology will work best for NCSCs. This
evaluation can be done by comparing intraband relaxation
times between the QDs and the QRs. Our experimental design
of synthesizing QDs with similar band edge energies as the QRs
allows us to compare each set of samples one-by-one, that is,
QR1 compared with QD1 and so forth. We can determine the
intraband relaxation time by simply considering the rise time of
the TA signals for probing energies at the band edge.
20,21
The
rise time of the TA data show the time at which the electrons
have populated the band edge level and can no longer support
additional electron s (as a result of the Pauli exclusion
principle). Thus, the TA rise time corresponds to electrons
being excited high into the conduction band (CB) followed by
intraband relaxation to the band edge. Presented in Figure 5A
and B are the results of the TA rise time studies for the colloidal
QDs and QRs, respectively. Figure 5C and D provides a more
succinct picture of the TA rise time measurements, showing the
rise time values for both colloid and thin-film samples with
respecttobandedge/probingenergyandNCvolume,
respectively.
Figure 4. (A) Linear absorbance and second derivative data for the QR2 film with color-coordinated arrows denoting various probing wavelengths
used for the TA measurement. (B) The TA experimental results for the probing wavelengths from (A).
Figure 5. (A,B) TA rise time traces for colloidal QD and QR samples, respectively. (C,D) Rise time data comparison for QD and QR colloidal and
thin-film samples with respect to the respective probe energies and NC volume, respectively.
The Journal of Physical Chemistry C Article
dx.doi.org/10.1021/jp4112553 | J. Phys. Chem. C 2014, 118, 2844−28502847
A fundamental reason for considering CdSe NCs as
sensitizers in solar cells is because of the predicted phonon
bottleneck phenomenon. Theoretically, the phonon bottleneck
effect causes hot electrons and hot holes to remain in their
excited states for an extended period of time due to the large
energy difference between electronic transitions. The large
energy spacing requires multiphonon emission for charge
carrier relaxation and thus reduces the probability of electronic
transition.
1
The phonon bottleneck mediated relaxation time
(τ
PB
) can be approximated by the following expression
1
τ
ω≈ΔEkTexp( / )
PB
(1)
where ω is the optical phonon frequency (∼210 cm
−1
),
13
ΔE is
the energy level spacing between states (∼0.1 ev), k is the
Boltzmann constant, and T is the temperature. For the NCs
studied in this work, eq 1 provides τ
PB
> 8 ps. As shown in
Figure 4C, all samples have relaxation times less than 2.5 ps,
signifying that all samples experience exciton relaxation
mechanisms that circumvent the phonon bottleneck effect.
We believe the mechanism for exciton relaxation to be Auger
thermalization for the samples studied here. Auger thermal-
ization occurs when an electron from a high-energy exciton,
such as the one generated by the pump photon in the TA
experiment, scatters its energy with a hole.
13,22
In CdSe, the
valence band (VB) manifold is significantly more dense than
that of the CB as a result of the difference in electron and hole
effective mass (m
h
≈ 6m
e
). Once the electron inelastically
scatters its energy with the hole, it can quickly relax through the
dense VB manifold.
23
As depicted in Figure 5C and D, we find that the QD
intraband relaxation times decrease for higher band edge
energies and consequently increase with larger NC volumes,
consistent with what was found previously.
20
However, by
changing the morphology from a spherically symmetric pseudo-
zero-dimensional (0D) QD structure to a pseudo-one-dimen-
sional (1D) QR structure, we see an increase in intraband
relaxation times for the QR samples, both with respect to band
edge energy and NC volume. To explain this increase in
intraband relaxation time, we propose similar phenomeno-
logical events to those for Auger recombination in NCs. Htoon
et al.
10,11
found that the Auger recombination rates were
reduced for QRs when compared with similar volume QDs.
The Auger recombination decay for QRs was indicative of
bimolecular exciton−exciton interactions rather than the three-
particle nonradiative relaxation in QDs.
10,11
We propose the
same fundamental interaction for Auger thermalization in QRs,
that is, the excitons generated become polarized along the
length of the QR, which reduces the confinement of the
exciton, and thus, the coulomb interaction of the electron and
hole for a given bound exciton is reduced and exciton−exciton
interactions become more dominant. However, the Auger
thermalization mechanism is still evident in the QR samples, as
illustrated by QR3 and QR2 having similar intraband relaxation
times. This is likely due to the length constraint on the QR
samples, which is still in the intermediate confinement regime
(CdSe Bohr radius ≈ 5.6 nm).
2
Therefore, extending the length
further could potentially increase the intraband relaxation time
further for the QR with the same diameter.
The NC environment also appears to have an effect on
intraband relaxation, as illustrated by the difference in rise time
values for the thin-film and colloidal samples shown in Figure
4C and D. For the QD samples, the thin-film samples show
extended relaxation times when compared to their colloidal
counterparts. The difference in sample preparation for the QR
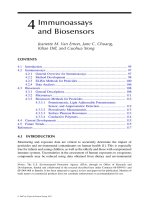
Figure 6. Fourier-transformed TA data probed at the band edge energy for the (A) colloidal QD, (D) thin-film QD, (B) colloidal QR, and (E) thin-
film QR. (C,F) Comparisons between the fundamental modes (i.e., the first most intense mode) and calculated modes.
The Journal of Physical Chemistry C Article
dx.doi.org/10.1021/jp4112553 | J. Phys. Chem. C 2014, 118, 2844−28502848
samples on intraband relaxation is less significant. For both
QDs a nd QRs, the thin-film samples exhibit intraband
relaxation trends qualitatively similar to the colloidal samples
with respect to band edge energy and NC volume. The
fundamental mechanism behind the increased relaxation time
in the QD thin-film samples is likely due to the partial removal
of surface ligands. It has been shown by Kambhampati that the
organic ligands play an important role in exciton relaxation.
13
Here, we apply a hydrazine treatment to the thin films, which is
used to assist with the removal of surface-attached ligands.
Furthermore, for QDs, the ligands predominantly affect the hot
hole relaxation pathway, while the hot electrons r elax
predominantly through the Auger thermalization.
13
This further
validates our hypothesis of the 1D exciton formation in the
QRs, justifying why we see little difference between the
colloidal and thin-film samples for the QRs. Due to the 1D
exciton formation, the electron and hole will be spatially further
from one another, thereby reducing the potential for electron to
hole scattering, and because the hole does not receive that
energy from the electron, the electron is more likely to relax
through the more time-consuming phonon bottleneck pathway.
Therefore, the ligands have a relatively smaller contribution to
intraband relaxation for the QRs when compared to that for
QDs. This also implies that even though different ligands were
used to stabilize the QR samples, the intraband relaxations in
different samples are not affected.
Aspects of Nonadiabatic Relaxation. In addition to the
charge carrier aspects of the TA measurements, we can also
extract the superimposed nonadiabatic relaxation, that is, the
coherent lattice vibrations. Therefore, we also evaluate the
environmental effects on nonadia batic relaxation, name ly,
through emission of coherent acoustic phonons. Upon pump
photon excitation, a coherent phonon is generated within the
NCs. This coherent acoustic phonon is coupled via a
piezoelectric and deformation potential; thus, the coherent
lattice vibrations deform the lattice, which consequently
modulates the band edge energy coherently.
13
For example,
small oscillations are visible in the TA signal probed at the band
edge of that sample (625 nm), as depicted in Figure 4B.
To analyze the acoustic phonon modes, we computed the
FFT of the TA data for each sample (both colloid and thin-
film) probed at the band edge energy, and the results are shown
in Figure 6. The FFT data show fundamental modes with
higher-frequency modes present for each sample. We compare
our experimental results with the relevant elastic continuum
theory results for vibrating spheres,
24,25
and in doing so, a
simple relationship between vibrational frequency (ω
lm
) and
particle size (d) was derived for QDs
25
ω =
Sv
d
lm
lm i
(2)
where v
i
is either the longitudinal acoustic velocity in CdSe
(3570 m/s) or the transverse acoustic velocity in CdSe (1540
m/s). S
lm
is a constant associated with boundary conditions.
25
For our calculations, we only consider the first two dominant
modes; those are the radial breathing mode (RBM, l =0,m =1,
2, 3, ) and the ellipsoidal breathing mode (EBM, l =2,m =1,
2, 3, ).
25
For the first-order RBM (S
0,1
= 0.92) and for the
first-order EBM (S
2,1
= 0.84), we use the longitudinal acoustic
velocity and transverse acoustic velocity in eq 2, respectively.
25
The results of these calculations are shown in Figure 6C. As
illustrated in Figure 6C, the colloidal samples match more
closely to the RBM, while the thin-film samples match the EBM
more closely, suggesting an environmentally dependent non-
adiabatic relaxation.
The higher-frequency modes that show up in the FFT
spectra in Figure 6A, B, D, and E are not overtones of the first
dominant mode, for example, the first-order peak for the
colloidal QD2 sample in Figure 6 A is ∼0.375 THz; thus, the
overtone would be ∼0.75 THz. However, the second peak
shows a frequency of ∼0.625 THz. This suggests that the
higher-frequency peaks are physical manifestations . While
Saviot et al. observed some evidence of these higher-frequency
modes using stimulated Raman spectroscopy,
25
we show a
much greater degree of clarity in frequency resolution of
higher-frequency modes. However, assigning the higher-order
peaks from the FFT to specific physical modes is quite difficult
because both the RBM and EBM are possible and higher-order
EBM modes can have similar frequencies as lower-order RBM
modes;
25
thus, we do not specify each individual higher-order
mode resolved by FFT.
For the QR samples, a simple analytic expression is not
available; however, an empirical one does exist for nanowires
and has been applied successfully to high aspect ratio QRs.
26
The relationship for the nanowire radial breathing mode
(NWRBM) for CdSe can be calculated as ω
NWRBM
= 2.73[THz·
nm]/d and is shown in Figure 6F.
26
Again, for QR samples, the
colloids show closer agreement with the NWRBM, while the
thin-film samples show a lower-frequency mode. For both the
QRs and QDs, the thin-film sample shows a reduction in
acoustic phonon frequency, suggesting that there are important
environment/non-Condon-like factors modifying the dominant
modes. It is difficult to specify the exact physical mechanism
modifying the acoustic phonon modes in the films’ samples;
however, we can gain insight from the work done by Gupalov
and Merkulov on NCs in glassy solid matrices.
27
Gupalov and
Merkulov showed that when the NCs are prepared in a glassy
matrix, the interaction with the neighboring medium will cause
reflections of energy carriers from the NC− matrix interface;
electronically, this leads to a superposition of the eigenstates of
both heavy and light holes, consequently modifying the exciton
states. In a similar fashion, this same concept applies to the
acoustic eigenmodes of the NC, resulting in a superposition of
LA and TA modes.
27
Here, instead of a glassy dielectric matrix
that encases individual dots, we have a porous system of NCs
that act as the dielectric interfacial medium. The superposition
of the LA and TA modes would theoretically red shift the
vibrational frequencies, which is precisely what we observe.
Another possible mechanism that could be acting simulta-
neously with the previous explanation is that the NC surface
energy changes for the two sample preparation methods.
Huxter et al. have shown that the changes in surface energy for
NC contribute significantly to modification of elastic properties
of the NC.
28
In accordance with this, we expect the thin-film
samples to also have altered surface energies when compared to
the colloidal s amples due to the interaction with other
neighboring NCs and the reduction in surface ligands from
the hydrazine treatment.
■
CONCLUSION
Time-resolved ultrafast TA spectroscopy was used to explore
the intraband relaxation and coherent acoustic phonons in QDs
and QRs of various sizes. We found that intraband relaxation
for the NCs was lower than 2.5 ps for all samples, indicating
that the NCs experienced Auger thermalization. Furthermore,
we showed that QRs had an increased intraband relaxation time
The Journal of Physical Chemistry C Article
dx.doi.org/10.1021/jp4112553 | J. Phys. Chem. C 2014, 118, 2844−28502849
when compared with QDs as a result of the formation of a 1D
exciton along the elongated axis of the QR, which reduces the
electron to hole scattering potential. Furthermore, the QD
samples showed increased intraband relaxation times as a result
of the film preparation and hydrazine treatment, which
removed (in part) the ligand relaxation pathway for the
holes. The longer intraband relaxation times for QRs suggest
that they would act as better sensitizers for hot electron
NCSCs. In addition, we showed that the thin-film version of
the QD samples had longer intraband relaxation times as a
result of the hydrazine treatment, which partially removed
surface-attached ligands, thus partially eliminating a relaxation
pathway for the hot holes. We also found that the coherent
acoustic phonons for the colloidal samples of QDs and QRs
were in reasonable agreement with the calculated RBM and
NWRBM, respectively. However, the coherent acoustic phonon
modes become reduced for the thin-film samples for both QDs
and QRs. This suggests that there are strong environmental
factors that will determine the nonadiabatic relaxation pathway.
We believe that the frequency reduction is a result of the
superposition of LA and TA acoustic eigenmodes as a result of
neighboring NC interaction. Furthermore, frequency modifica-
tion could also be due in part to changes in surface energy for
the NCs when prepared in the thin-film form without surface-
attached ligands.
■
AUTHOR INFORMATION
Corresponding Author
*E-mail:
Notes
The authors declare no competing financial interest.
■
ACKNOWLEDGMENTS
Support for this work was provided by the National Science
Foundation and is gratefully acknowledged. We also thank NN-
Laboratories, Dr. A. Garrelts, and Dr. S. Suslov for assistance
with TEM images. Finally, we thank K. Rickey for helpful
discussions regarding thin-film sample preparation.
■
REFERENCES
(1) Nozik, A. Spectroscopy and Hot Electron Relaxation Dynamics in
Semiconductor Quantum Wells and Quantum Dots. Annu. Rev. Phys.
Chem. 2001, 52, 193−231.
(2) Katz, D.; Wizansky, T.; Millo, O.; Rothenberg, E.; Mokari, T.;
Banin, U. Size-Dependent Tunneling and Optical Spectroscopy of
CdSe Quantum Rods. Phys. Rev. Lett. 2002, 89, 086801/1−086801/4.
(3) Murray, C.; Norris, D.; Bawendi, M. Synthesis and Character-
ization of Nearly M onodisperse CdE (E = Sulfur, Selenium,
Tellurium) Semiconductor Nanocrystallites. J. Am. Chem. Soc. 1993,
115, 8706−8715.
(4) Peng, X.; Manna, L.; Yang, W.; Wickham, J.; Scher, E.;
Kadavanich, A.; Alivisatos, A. Shape Control of CdSe Nanocrystals.
Nature 2000, 404,59−61.
(5) Shieh, F.; Saunders, A. E.; Korgel, B. A. General Shape Control of
Colloidal CdS, CdSe, CdTe Quantum Rods and Quantum Rod
Heterostructures. J. Phys. Chem. B 2005, 109, 8538−8542.
(6) Robel, I.; Bunker, B. A.; Kamat, P. V.; Kuno, M. Exciton
Recombination Dynamics in CdSe Nanowires: Bimolecular to Three-
Carrier Auger Kinetics. Nano Lett. 2006, 6, 1344−1349.
(7) Robel, I.; Subramanian, V.; Kuno, M.; Kamat, P. V. Quantum Dot
Solar Cells. Harvesting Light Energy with CdSe Nanocrystals
Molecularly Linked to Mesoscopic TiO
2
Films. J. Am. Chem. Soc.
2006, 128, 2385−2393.
(8) Klimov, V. I. Optical Gain and Stimulated Emission in
Nanocrystal Quantum Dots. Science 2000, 290, 314−317.
(9) Kim, T.; Cho, K.; Lee, E.; Lee, S.; Chae, J. Full-Colour Quantum
Dot Displays Fabricated by Transfer Printing. Nat. Photonics 2011, 5,
176−182.
(10) Htoon, H.; Hollingsworth, J. A.; Dickerson, R.; Klimov, V. I.
Effect of Zero- to One-Dimensional Transformation on Multiparticle
Auger Recombination in Semiconductor Quantum Rods. Phys. Rev.
Lett. 2003, 91, 227401/1−227401/4.
(11) Htoon, H.; Hollingworth, J. A.; Malko, A. V.; Dickerson, R.;
Klimov, V. I. Light Amplification in Semiconductor Nanocrystals:
Quantum Rods versus Quantum Dots. Appl. Phys. Lett. 2003, 82,
4776−4778.
(12) Spann, B. T.; Chen, L.; Ruan, X.; Xu, X. Energy Relaxation in
CdSe Nanocrystals: The Effects of Morphology and Film Preparation.
Opt. Express 2013, 21, 1018−1024.
(13) Kambhampati, P. Hot Exciton Relaxation Dynamics in
Semiconductor Quantum Dots: Radiationless Transitions on the
Nanoscale. J. Phys. Chem. C 2011, 115, 22089−22109.
(14) Kambhampati, P. Unraveling the Structure and Dynamics of
Excitons in Semiconductor Quantum Dots. Acc. Chem. Res. 2011, 44,
1−13.
(15) Taguchi, S.; Saruyama, M.; Teranishi, T.; Kanemitsu, Y.
Quantized Auger Recombination of Biexcitons in CdSe Nanorods
Studied by Time-Resolved Photoluminescence and Transient-
Absorption Spectroscopy. Phys. Rev. B 2011, 83, 155324/1−155324/7.
(16) JCPDS Data File No. 19-191.
(17) Schedelbeck, G.; Wegscheider, W.; Bichler, M.; Abstreiter, G.
Coupled Quantum Dots Fabricated by Cleaved Edge Overgrowth:
From Artificial Atoms to Molecules. Science 1997, 278, 1792−1795.
(18) Luther, J. M.; Beard, M. C.; Song, Q.; Law, M.; Ellingson, R. J.;
Nozik, A. J. Multiple Exciton Generation in Films of Electronically
Coupled PbSe Quantum Dots. Nano Lett.
2007, 7, 1779−1784.
(19) Norris, D.; Sacra, A.; Murray, C.; Bawendi, M. Measurement of
the Size Dependent Hole Spectrum in CdSe Quantum Dots. Phys. Rev.
Lett. 1994, 72, 2612−2615.
(20) Klimov, V. I. Optical Nonlinearities and Ultrafast Carrier
Dynamics in Semiconductor Nanocrystals. J. Phys. Chem. B 2000, 104,
6112−6123.
(21) Mohamed, M. B.; Burda, C.; El-Sayed, M. A. Shape Dependent
Ultrafast Relaxation Dynamics of CdSe Nanocrystals: Nanorods vs
Nanodots. Nano Lett. 2001, 1, 589−593.
(22) Wang, L W.; Califano, M.; Zunger, A.; Franceschetti, A.
Pseudopotential Theory of Auger Processes in CdSe Quantum Dots.
Phys. Rev. Lett. 2003, 91, 056404/1−056404/4.
(23) Efros, A.; Kharchenko, V.; Rosen, M. Breaking the Phonon
Bottleneck in Nan ometer Quantum Dots: Role of Auger-Like
Processes. Solid State Commun. 1995, 93, 281−284.
(24) Saviot, L.; Murray, D. Long Lived Acoustic Vibrational Modes
of an Embedded Nanoparticle. Phys. Rev. Lett. 2004, 93, 055506/1−
055506/4.
(25) Saviot, L.; Champagnon, B.; Duval, E.; Kudriavtsev, I. A.;
Ekimov, A. I. Size Dependence of Acoustic and Optical Vibrational
Modes of CdSe Nanocrystals in Glasses. J. Non. Cryst. Solids 1996, 197,
238−246.
(26) Lange, H.; Mohr, M.; Artemyev, M.; Woggon, U.; Thomsen, C.
Direct Observation of the Radial Breathing Mode in CdSe Nanorods.
Nano Lett. 2008, 8, 4614−4617.
(27) Gupalov, S.; Merkulov, I. Theory of Raman Light Scattering by
Nanocrystal Acoustic Vibrations. Phys. Solid State 1999, 41, 1349−
1358.
(28) Huxter, V. M.; Lee, A.; Lo, S. S.; Scholes, G. D. CdSe
Nanoparticle Elasticity and Surface Energy. Nano Lett. 2009, 9, 405−
409.
■
NOTE ADDED AFTER ASAP PUBLICATION
This article was published ASAP on January 22, 2014. Figure 6
has been revised. The correct version was published on January
28, 2014.
The Journal of Physical Chemistry C Article
dx.doi.org/10.1021/jp4112553 | J. Phys. Chem. C 2014, 118, 2844−28502850