effects of cuo nanoparticles on compressive strength
Bạn đang xem bản rút gọn của tài liệu. Xem và tải ngay bản đầy đủ của tài liệu tại đây (618.01 KB, 21 trang )
S
¯
adhan
¯
a Vol. 36, Part 3, June 2011, pp. 371–391.
c
Indian Academy of Sciences
Effects of CuO nanoparticles on compressive strength
of self-compacting concrete
ALI NAZARI
∗
and SHADI RIAHI
Department of Materials Science and Engineering, Saveh Branch, Islamic Azad
University, Saveh 39187-366, Iran
e-mail:
MS received 31 August 2010; revised 18 December 2010; accepted 24 February 2011
Abstract. In the present study, the compressive strength, thermal properties and
microstructure of self-compacting concrete with different amounts of CuO nanopar-
ticles have been investigated. CuO nanoparticles with an average particle size of
15 nm were added to self-compacting concrete and various properties of the speci-
mens were measured. The results indicate that CuO nanoparticles are able to improve
the compressive strength of self-compacting concrete and reverse the negative effects
of superplasticizer on compressive strength of the specimens. CuO nanoparticles as a
partial replacement of cement up to 4 wt.% could accelerate C–S–H gel formation as
a result of the increased crystalline Ca(OH)
2
amount at the early ages of hydration.
Increasing CuO nanoparticle content to more than 4 wt.%, causes reduced compres-
sive strength because of unsuitable dispersion of nanoparticles in the concrete matrix.
Accelerated peak appearance in conduction calorimetry tests, more weight loss in
thermogravimetric analysis and more rapid appearance of peaks related to hydrated
products in X-ray diffraction results, all indicate that CuO nanoparticles up to 4 wt.%
could improve the mechanical and physical properties of the specimens. Finally, CuO
nanoparticles improved the pore structure of concrete and caused shifting of the
distributed pores from harmless to low harm.
Keywords. SCC; CuO nanoparticles; compressive strength; pore structure;
thermogravimetric analysis.
1. Introduction
Self-compacting concrete (SCC) is one of the most significant advances in concrete technology
in recent years. SCC may be defined as a concrete with the capacity to flow inside the frame-
∗
For correspondence
371
372 Ali Nazari and Shadi Riahi
work, to pass around the reinforcements and through the narrow sections, consolidating simply
under its own weight without needing additional vibration and without showing segregation or
bleeding. This behaviour is achieved in normally vibrated concretes (NVC) in which the same
components are used with a higher content of fines and using very powerful superplasticizers. In
addition, to increase the viscosity of the paste, viscosity-modifying admixtures can also be used.
These are usually comprised of polymers made up of long-chain molecules which are capable
of absorbing and fixing the free water content. This modification in the mix design may have an
influence on the mechanical properties of the concrete; therefore it is important to ensure that all
the basic assumptions and test results for design models of NVC construction are also valid for
SCC construction.
Most articles which are published until now show that for a certain compressive strength, SCC
tend to reach strength slightly higher than that of NVC (Köning et al 2001; Hauke 2001 and
Fava et al 2003). Mostly, all research has used SCC which includes active additions to satisfy
the great demand for fines needed for this type of concrete, thereby improving the mechanical
properties in comparison with NVC. For instance, Köning et al (2001) and Hauke (2001) reg-
istered strength increase in SCCs made with different amounts of fly ash. According to Fava
et al (2003), in SCCs with granulated blast furnace slag this increase is also evident. On the
other hand, when limestone filler is used, Fava et al (2003) and Daoud et al (2003) achieved
a tensile strength in SCC lower than the equivalent NVC. Bosiljkov (2003) has illustrated the
behaviour of both types of concrete are similar. As for the modulus of elasticity, it is generally
seen that this rises with age at a similar rate to that of NVCs (Köning et al 2001), though it
seems that SCCs are a little more deformable (Makishima et al 2001; Klug & Holschemacher
2003 and Chopin et al 2003). These small differences in stiffness between the two types of con-
crete can be attributed to the SCCs’ high paste content; although according to Su et al (2001),
increasing the fine aggregate/total aggregate ratio does not have a significant effect on the SCCs’
modulus of elasticity. In any case, it should be pointed out that most of the results available in
the bibliography usually refer to high strength SCCs, where high cement contents (higher than
400 kg/m
3
) are used, usually accompanied by active additions, such as fly ash or blast furnace
slag. However, there are few studies that give results for low to medium compressive strength
of SCCs.
To the knowledge of authors, there are few works on incorporating nanoparticles into SCCs
to achieve improved physical and mechanical properties. There are several reports on incor-
poration of nanoparticles in NVCs, most of which have focused on using SiO
2
nanoparticles
(Bjornstrom et al 2004; Ji 2005 and Jo et al 2007). In addition, some of the works have utilized
nano-Al
2
O
3
(Li et al 2006 and Campillo et al 2007), nano-Fe
2
O
3
(Li et al 2004) and zinc–iron
oxide nanoparticles (Flores-Velez & Dominguez 2002). Previously, the effects of SiO
2
(Nazari
& Riahi 2010a), TiO
2
[Nazari 2010; Nazari & Riahi 2010b, 2010c) and ZnO
2
(Nazari & Riahi
2010d, 2010e) nanoparticles on different properties of self-compacting concrete have been stud-
ied. In addition, in a series of works (Nazari & Riahi 2010f, 2010g, 2010h, 2010i, 2010j, 2010k),
the effects of several types of nanoparticles on properties of concrete specimens which are cured
in different curing media have been investigated.
Incorporation of other nanoparticles is rarely reported. Therefore, introducing some other
nanoparticles which probably could improve the mechanical and physical properties of cementi-
tious composites would be interesting. The aim of this study is incorporating CuO nanoparticles
into SCCs to study the compressive strength and pore structure of the concrete. Several speci-
mens with different amounts of polycarboxylate superplasticizer (PC) have been prepared and
their physical and mechanical properties have been considered when, instead of cement, CuO
nanoparticles were partially added to the cement paste.
CuO nanoparticles’ effects on self compacting concrete 373
Table 1. Chemical and physical properties of Portland cement (Wt.%).
Material SiO
2
Al
2
O
3
Fe
2
O
3
CaO MgO SO
3
Na
2
OK
2
O Loss on ignition
Cement 21.89 5.3 3.34 53.27 6.45 3.67 0.18 0.98 3.21
Specific gravity: 1.7 g/cm
3
2. Materials and methods
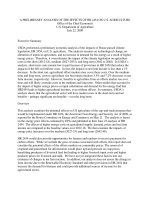
Ordinary Portland Cement (OPC) conforming to ASTM C150 standard was used as received.
The chemical and physical properties of the cement are shown in table 1. The particle size
distribution pattern of the used OPC is illustrated in figure 1.
CuO nanoparticles with an average particle size of 15 nm and 45 m
2
g
−1
Blaine fineness from
Suzhou Fuer Import & Export Trade Co., Ltd were used as received. The properties of CuO
nanoparticles are shown in table 2. Scanning electron micrographs (SEM) and powder X-ray
diffraction (XRD) diagrams of CuO nanoparticles are shown in figures 2 and 3.
Crushed limestone aggregates were used to produce self-compacting concretes, with gravel
4/12 and two types of sand. One of them was coarse 0/4, for fine aggregates and the other was
fine 0/2, with a very high fines content (particle size <0.063 mm) of 19.2%. The main function
of them was to provide a greater volume of fine materials to improve the stability of the fresh
concrete.
A polycarboxylate with a polyethylene condensate defoamed based admixture (Glenium C303
SCC) was used. Table 3 shows some of the physical and chemical properties of polycarboxylate
admixture used in this study.
Two series of mixtures were prepared in the laboratory trials. C0-SCC series mixtures were
prepared with cement, fine and ultra-fine crushed limestone aggregates with 19.2% by weight
of ultra-fines and 0%, 0.3%, 0.5%, 0.7% and 1.0% by weight of polycarboxylate admixture
replaced by required water for each specimen. N-SCC series were prepared with different con-
tents of CuO nanoparticles with average particle size of 15 nm. The mixtures were prepared
with the cement replacement by CuO nanoparticles from 1 to 5 wt.% and 1 wt.% polycarboxy-
late admixture. The superplasticizer was dissolved in water and then the nano-CuO was added
and stirred at a high speed for 3 min. Though nano-CuO cannot be dissolved in water, a small
amount of nano-CuO can be dispersed evenly by the superplasticizer. The water to binder ratio
0
20
40
60
80
100
120
0 20 40 60 80 100 120 140 160
Particle size (µm)
Percentage finer than
Figure 1. Particles distribution pattern of ordinary Portland cement.
374 Ali Nazari and Shadi Riahi
Table 2. The properties of nano-CuO.
Diameter (nm) Surface volume ratio (m
2
/g) Density (g/cm
3
) Purity (%)
15 ± 3 155 ± 12 <0.13 >99.9
Figure 2. SEM micrograph of CuO nanoparticles.
Figure 3. XRD analysis of CuO nanoparticles.
CuO nanoparticles’ effects on self compacting concrete 375
Table 3. Physical and chemical characteristics of the
polycarboxylate admixture.
Appearance Yellow-brown liquid
% solid residue Approximately 36%
pH 5.2–5.3
Specific gravity (kg/l) Approximately 1.06
Rotational viscosity (MPa) 79.30
% C 52.25
ppm Na
+
9150
ppm K
+
158
for all mixtures was set at 0.40 (Zivica 2009). The binder content of all mixtures was 450 kgm
−3
.
The proportions of the mixtures are presented in table 4.
The mixing sequence for SCCs consisted of homogenizing the sand and cementitious mate-
rials for one minute in the mixer and then adding approximately 75% of the mixing water. The
coarse aggregate was introduced and then the superplasticizer was pre-dissolved in the remain-
ing water and was added at the end of the mixing sequence. The total mixing time including
homogenizing was 5 minutes.
Several types of tests were carried out on the prepared specimens:
(i) Compressive strength: Cubic specimens with 100 mm edge length were made for compres-
sive tests. The moulds were covered with polyethylene sheets and moistened for 24 h. Then
the specimens were demoulded and cured in water at a temperature of 20
◦
C in the room
condition prior to test days. The compressive strength tests were conducted after 2, 7 and
28 days of curing. Compressive tests were carried out according to the ASTM C 39 standard.
After the specified curing period was over, the concrete cubes were subjected to compres-
sive test by using a universal testing machine. The tests were carried out in triplicate and
average compressive strength values were obtained.
(ii) Mercury intrusion porosimetry: There are several methods generally used to measure the
pore structure, such as optical methods, mercury intrusion porosimetry (MIP), helium flow
Table 4. Mixture proportion of nano-CuO particles blended concretes.
Sample designation CuO nanoparticles (%) PC content (%) Quantities (kg/m
3
)
Cement CuO nanoparticles
C0-SCC0 0 0 450 0
C0-SCC0.3 0 0.3 450 0
C0-SCC0.5 0 0.5 450 0
C0-SCC0.7 0 0.7 450 0
C0-SCC1 0 1.0 450 0
N1-SCC1 1 1.0 445.5 4.5
N2-SCC1 2 1.0 441.0 9.0
N3-SCC1 3 1.0 437.5 13.5
N4-SCC1 4 1.0 432.0 18.0
N5-SCC1 5 1.0 427.5 22.5
Water to binder [cement + nano-CuO] ratio of 0.40
376 Ali Nazari and Shadi Riahi
and gas adsorption (Abell et al 1999). The MIP technique is used extensively to charac-
terize the pore structure in porous material as a result of its simplicity, quickness and wide
measuring range of pore diameter (Abell et al 1999; Tanaka & Kurumisawa 2002). MIP
provides information about the connectivity of pores (Abell et al 1999).
In this study, the pore structure of concrete was evaluated by using MIP. To prepare the
samples for MIP measurement, concrete specimens with 28 days of curing were first broken
into smaller pieces, and then the cement paste fragments selected from the center of prisms
were used to measure the pore structure. The samples were immersed in acetone to stop
hydration as fast as possible. Before the mercury intrusion test, the samples were dried in an
oven at about 110
◦
C until reaching constant weight to remove moisture in the pores. MIP
is based on the assumption that the non-wetting liquid mercury (the contact angle between
mercury and solid is greater than 90) will only intrude in the pores of porous material under
pressure (Abell et al 1999; Tanaka & Kurumisawa 2002). Each pore size is quantitatively
determined from the relationship between the volume of intruded mercury and the applied
pressure (Abell et al 1999). The relationship between the pore diameter and applied pressure
is generally described by the Washburn equation as follows (Abell et al 1999; Tanaka &
Kurumisawa 2002):
D =−4γ cos θ/P, (1)
where, D is the pore diameter (nm), γ is the surface tension of mercury (dyne/cm), θ is the
contact angle between mercury and solid (
◦
) and P is the applied pressure (MPa).
The test apparatus used for pore structure measurement was an Auto Pore III mercury
porosimeter. Mercury density is 13.5335 g/ml
1
. The surface tension of mercury is taken as
485 dynes/cm
1
, and the contact angle selected is 130. The maximum measuring pressure
applied is 200 MPa (30000 psi), which means that the smallest pore diameter that can be
measured is about 6 nm (on the assumption that all pores are cylindrical in shape).
(iii) Conduction calorimetry: This test was run on a Wexham Developments JAF model isother-
mal calorimeter, using the IBM program AWCAL-4, at 22
◦
C for a maximum of 70 h.
Fifteen grams of cement was mixed with water and saturated limewater and admixture
before introducing it into the calorimeter cell.
(iv) Thermogravimetric analysis (TGA): A Netzsch model STA 409 simultaneous thermal ana-
lyzer equipped with a Data Acquisition System 414/1 programmer was used for the tests.
Specimens which had been cured for 28 days were heated from 110 to 650
◦
C, at a heating
rate of 4
◦
Cmin
−1
andinaninertN
2
atmosphere.
(v) Scanning electron microscopy (SEM): SEM investigations were conducted on a Hitachi
apparatus. Backscattered electron (BSE) and secondary electron (SE) imaging was used
to study the samples, which were prepared under conditions that ensured their subsequent
viability for analytical purposes.
(vi) X-ray diffraction (XRD): A Philips PW-1730 unit was used for XRD analysis which was
taken from 4 to 70
◦
.
3. Results and discussion
3.1 Strength analysis of C0-SCC specimens
Table 5 shows the compressive strengths of C0-SCC specimens after 2, 7 and 28 days of curing
which are all reduced by increasing PC content especially at early age of curing. This fact may
be due to various factors, such as using different superplasticizers or greater fines content in the
SCCs. Roncero & Gettu (2002) have pointed out the formation of large CH crystals when using
CuO nanoparticles’ effects on self compacting concrete 377
Table 5. Compressive strength of C0-SCC specimens.
Sample designation PC content (%) Compressive strength (MPa)
2 days 7 days 28 days
C0-SCC0 0 16.9 25.4 34.8
C0-SCC0.3 0.3 15.7 24.3 34.0
C0-SCC0.5 0.5 15.1 23.2 33.1
C0-SCC0.7 0.7 14.5 22.0 32.5
C0-SCC1 1.0 14.0 20.6 31.6
polycarboxylate superplasticizers. These large crystals weaken the aggregate–paste transition
zone and hence decrease the compressive strength of concrete by decreasing the aggregate–paste
bond. As for the influence of the fines content, the bigger particles leads to the greater shrinkage
(Song et al 2001 and Hammer et al 2001), giving rise to the appearance of a greater number
of micro-cracks in the aggregate paste interface which also reduce the compressive strength.
Moreover, by increasing the volume of fines, the specific surface area of the aggregates increases,
with the aggregate–paste transition zone being precisely the weakest phase of the concrete.
During the early days of hydration, the strength is affected by two opposing effects: (i) the
limestone fines raise the rate of hydration of some clinker compounds since the fines act as
nucleation sites for the hydrates formed in the hydration reactions (Ye et al 2007). (ii) PC has
a delaying effect on hydration of CH crystals and formation of C
3
H (Puertas et al 2005a and
2005b).
At higher ages, 28 days, the two aforementioned effects disappear and it can clearly be seen
that there is less effect on reducing the compressive strength in SCCs by increasing PC. This
is due to a longer development over time for the cement’s hydration processes in the SCCs
with higher content of PC as a result of the SCCs’ greater capacity to retain water (Puertas
et al 2005a), which allows pozzolanic additions to continue reacting at higher ages with the
lime resulting from the cement hydration. Furthermore, although PC retards the initial hydration
reactions, according to Puertas et al (2005a) these reactions are intensified in later stages as a
result of particle dispersion.
The pore structure of concrete is the general embodiment of porosity, pore size distribution,
pore scale and pore geometry. The test results of MIP in this study include the pore structure
parameters such as total specific pore volume, most probable pore diameter, pore size distribu-
tion, porosity, average diameter, and median diameter (volume). In terms of the different effect
of pore size on concrete performance, the pore in concrete are classified as harmless (<20 nm),
Table 6. Total specific pore volumes and most probable pore diameters
of C0-SCC specimens.
Sample designation Total specific pore Most probable pore
volume (mL/g) diameter (nm)
C0-SCC0 0.0381 32
C0-SCC0.3 0.0346 24
C0-SCC0.5 0.0332 20
C0-SCC0.7 0.0320 18
C0-SCC1 0.0304 14
378 Ali Nazari and Shadi Riahi
Table 7. Prosities, average diameters and median diameters (volume) of C0-SCC specimens.
Sample designation Prosity (%) Average diameter (nm) Median diameter (volume) (nm)
C0-SCC0 8.99 27.53 41.4
C0-SCC0.3 8.11 20.9 30.3
C0-SCC0.5 7.70 16.8 28.7
C0-SCC0.7 7.46 12.1 25.4
C0-SCC1 7.17 10.2 22.2
low-harm (20–50 nm), harmful (50–200 nm) and very-harmful pore (>200 nm) (Wu & Lian
1999). In order to analyse and compare conveniently, the pore structure of concrete is divided
into four ranges according to this sort method in this work.
Table 6 shows that with increasing PC content, the total specific pore volumes of concretes
are decreased, and the most probable pore diameters shift to smaller pores and fall in the range
of low-harm pore, which indicates that the addition of PC refines the pore structure of concretes.
Table 7 gives the porosities, average diameters and median diameters (volume) of various
concretes. The regularity of porosity is similar to that of total specific pore volume. The regularity
of average diameter and median diameter (volume) is similar to that of most probable pore
diameter.
The pore size distribution of the concretes is shown in table 8. It is seen that by increasing PC
content, the amount of pores decreases, which shows that the density is increased and the pore
structure is improved.
Table 9 shows the results of conduction calorimetry of C0-SCC specimens. Two signals can
be distinguished on all test results: a peak corresponding to the acceleration or post-induction
period, associated with the precipitation of C–S–H gel and CH, and a shoulder related to a
second, weaker signal with a later peak time, associated with the transformation from the ettrin-
gite (AFt) to the calcium monosulphoaluminate (AFm) phase via dissolution and reaction with
Al(OH)
4−
(Jawed et al 1983). The numerical values corresponding to these two signals (heat
release rate, peak times) and the total released heat are shown in table 9. The time period over
the total heat was measured until the heat release rate was below 1% of the maximum of the
second peak.
The heat release rate values in table 9 show that increasing the percentage of PC in the pastes
retards peak times and raises heat release rate values. This is indicative of a delay in initial
cement hydration because of higher content of PC. The retardation is much less marked in the
second peak. The total heat released under identical conditions (at times when the heat release
Table 8. Pore size distribution of C0-SCC specimens.
Sample Pore size distribution (mL/g(%)) Total specific pore
designation Harmless pores Few-harm pores Harmful pores Multi-harm pores volume (mL/g)
(<20 nm) (20–50 nm) (50–200 nm) (>200 nm)
C0-SCC0 0.0045 0.0127 0.0149 0.0079 0.0381
C0-SCC0.3 0.0044 0.0116 0.0121 0.0064 0.0346
C0-SCC0.5 0.0043 0.0108 0.0114 0.0056 0.0332
C0-SCC0.7 0.0041 0.0101 0.0108 0.0045 0.0320
C0-SCC1 0.0039 0.0090 0.0100 0.0038 0.0304
CuO nanoparticles’ effects on self compacting concrete 379
Table 9. Calorimetric results of C0–SCC specimens.
Sample designation Total heat First peak Second peak
kJ/kg Time (h) Rate (W/kg) Time (h) Rate (W/kg)
C0-SCC0 319.8 1.8 0.62 16.1 2.71
C0-SCC0.3 333.5 1.9 0.64 17.2 2.86
C0-SCC0.5 345.3 2.1 0.67 18.6 3.02
C0-SCC0.7 359.5 2.25 0.69 19.5 3.29
C0-SCC1 371.7 2.4 0.71 20.6 3.41
Table 10. Weight loss (%) of the pastes in the range of
110–650
◦
C at 28 days of curing of C0-SCC specimens.
Sample designation Weight loss (%)
C0-SCC0 10.4
C0-SCC0.3 10.7
C0-SCC0.5 11.0
C0-SCC0.7 11.2
C0-SCC1 11.4
Figure 4. XRD results indicating the formation of hydrated products for different C0-SCC specimens:
(a) C0-SCC0, (b) C0-SCC0.3, (c) C0-SCC0.5, (d) C0-SCC0.7 and (e) C0-SCC1.
380 Ali Nazari and Shadi Riahi
rate is less than 1% of the maximum amount of heat released in the first peak) decreases with
higher percentages of PC in the mix.
Table 10 shows the thermogravimetric analysis results of C0-SCC specimens measured in the
110–650
◦
C range in which dehydration of the hydrated products occurred. The results show that
after 28 days of curing, the loss in weight of the specimens is increased by decreasing the PC
content in concretes.
(1)
(2)
(3)
(a) (b)
Figure 5. SEM micrographs of (a) C0-SCC0 specimen and (b) C0-SCC1 specimen at 2 days (series 1),
7 days (series 2) and 28 days (series 3) of curing.
CuO nanoparticles’ effects on self compacting concrete 381
Figure 4 shows XRD analysis of C0-SCC specimens at different times after curing. As figure 4
also shows, the peak related to formation of the hydrated products shifts to appear at later times
indicating the negative impact of PC on formation of Ca(OH)
2
and C–S–H gel at early ages of
cement hydration.
Finally, figure 5 shows SEM micrographs of C0-SCC specimens without and with PC. The
morphological analysis evinced no substantial differences in either the form or the texture of the
different reaction products in pastes with and without admixtures. The micrographs correspond-
ing to paste cured for 2 and 7 days show anhydrous cement that has not yet reacted, along with a
relatively porous mass analogous to the reaction products. This region is more compact and less
porous in the paste with admixture. After 28 days, the reaction is observed to progress, with a
considerable decrease in the amount of anhydrous cement particles.
The results obtained with respect to the effect of PC on cement hydration show that at early
ages PC retards the initial cement hydration. This effect is more evident at higher doses of super-
plasticizer. This phenomenon is confirmed by the results obtained in conduction calorimetry,
with a retardation of the peak time for the first peak in the heat release rate, associated with C
3
H
and CH formation. This lower initial formation of reaction products is further corroborated by
the smaller weight loss detected in 2 day cured pastes with admixtures, when subjected to tem-
peratures of 110–650
◦
C. Such weight loss is related to the partial and total dehydration of C
3
H
and CH.
Since the amount of superplasticizer do not mainly affect on the compressive strength of
the specimens while improve the workability of concrete, only cement paste with 1 wt.% PC
admixture was selected because of its high workability and cement was partially replaced by
different amount of CuO nanoparticles. The results are discussed in the following section.
3.2 Strength analysis of N-SCC specimens
Table 11 shows the compressive strength of N-SCC specimens after 2, 7 and 28 days of curing.
The results show that the compressive strength increases by adding CuO nanoparticles up to
4.0wt.% replacement (N4-SCC series) and then it decreases, although adding 5.0 percent CuO
nanoparticles produces specimens with much higher compressive strength with respect to the all
other C0-SCC concretes. The reduced compressive strength by adding more than 4 wt.% CuO
nanoparticles may be due to the fact that the quantity of CuO nanoparticles present in the mix
is higher than the amount required to combine with the liberated lime during the process of
hydration. This is leading to excess silica leaching out and causing a deficiency in strength as
it replaces part of the cementitious material but does not contribute to strength. Also, it may be
due to the defects generated in dispersion of nanoparticles that causes weak zones.
Table 11. Compressive strength of N-SCC specimens.
Sample designation CuO nanoparticles (%) Compressive strength (MPa)
2 days 7 days 28 days
N1-SCC1 1 13.9 22.5 32.9
N2-SCC1 2 15.1 27.0 35.8
N3-SCC1 3 16.6 30.4 41.6
N4-SCC1 4 17.7 35.2 46.9
N5-SCC1 5 19.0 33.1 45.6
382 Ali Nazari and Shadi Riahi
Table 12. Total specific pore volumes and most probable pore diameters of N-SCC specimens.
Sample designation Total specific pore volume (mL/g) Most probable pore diameter (nm)
N1-SCC1 0.0268 11.2
N2-SCC1 0.0247 11.2
N3-SCC1 0.0229 10.3
N4-SCC1 0.0213 9.3
N5-SCC1 0.0223 10.3
The higher compressive strength in the N-SCC series mixtures with respect to C0-SCC series
is due to the rapid consumption of crystalline Ca(OH)
2
which quickly forms during hydration of
Portland cement, especially at early ages as a result of high reactivity of CuO nanoparticles. As
a consequence, the hydration of cement is accelerated and larger volumes of reaction products
are formed. Also, CuO nanoparticles recover the particle packing density of the blended cement,
leading to a reduced volume of larger pores in the cement paste.
Table 12 shows that with increasing CuO nanoparticles up to 4 wt.%, the total specific pore
volume of concrete decreases, and the most probable pore diameters reduces and falls in the
range of low-harm pores, which indicates that the addition of PC refines the pore structure of
concretes.
Table 13 gives the porosities, average diameters and median diameters (volume) of various
concretes. The regularity of porosity is similar to that of total specific pore volume. The regularity
of average diameter and median diameter (volume) is similar to that of most probable pore
diameter.
The pore size distribution is shown in table 14. It is observed that by adding nanoparticles,
the amount of pores is decreased, which shows that the density of concretes is increased and the
pore structure is improved.
The effectiveness of nano-CuO in improving the pore structure of concretes increases in
the order: N1-SCC <N2-SCC <N3-SCC <N5-SCC <N4-SCC. The mechanism by which the
nanoparticles improve the pore structure of concrete can be interpreted as follows (Li et al 2007).
Suppose that nanoparticles are uniformly dispersed in concrete and each particle is contained
in a cube pattern, therefore the distance between nanoparticles can be determined. After the
hydration begins, hydrate products diffuse and envelop nanoparticles as kernels (Li et al 2007).
If the nanoparticle content and the distance between them are appropriate, the crystallization
will be controlled through restricting the growth of Ca(OH)
2
crystals by nanoparticles. More-
over, the nanoparticles located in cement paste as kernels can further promote cement hydration
due to their high activity. This makes the cement matrix more homogeneous and compact. Con-
sequently, the pore structure of concrete is clearly improved such as the concrete containing
nano-CuO in the amount of 1% by weight of binder (Li et al 2007).
Table 13. Prosities, average diameters and median diameters (volume) of N-SCC specimens.
Sample designation Prosity (%) Average diameter (nm) Median diameter (volume) (nm)
N1-SCC1 6.51 9.3 19.9
N2-SCC1 6.22 8.9 18.5
N3-SCC1 6.02 8.3 15.4
N4-SCC1 5.82 7.7 11.4
N5-SCC1 5.91 8.0 13.6
CuO nanoparticles’ effects on self compacting concrete 383
Table 14. Pore size distribution of N-SCC specimens.
Sample Pore size distribution (mL/g(%)) Total specific pore
designation
Harmless pores Few-harm pores Harmful pores Multi-harm pores
volume (mL/g)
(<20 nm) (20–50 nm) (50–200 nm) (>200 nm)
N1-SCC1 0.0035 0.0083 0.0089 0.0028 0.0267
N2-SCC1 0.0033 0.0078 0.0083 0.0024 0.0247
N3-SCC1 0.0030 0.0070 0.0066 0.0018 0.0229
N4-SCC1 0.0027 0.0063 0.0047 0.0013 0.0213
N5-SCC1 0.0028 0.0066 0.0060 0.0016 0.0223
With increasing the CuO nanoparticle content above 4 wt.%, the improvement in the pore
structure is weakened. This can be attributed to the distance between nanoparticles decreasing
with increasing nanoparticle content, and Ca(OH)
2
crystals cannot grow enough due to limited
space and the crystal quantity is decreased, which leads to the ratio of crystal to strengthening
gel being low and the shrinkage and creep of the cement matrix increased (Ye 2001), thus the
pore structure of the cement matrix is loosened relatively.
On the whole, the addition of nanoparticles improves the pore structure of concrete. On one
hand, nanoparticles can act as a filler to enhance the density of concrete, which leads to the
porosity of concrete being reduced significantly. On the other hand, nanoparticles can not only
act as an activator to accelerate cement hydration due to their high activity, but also act as a kernel
in cement paste which reduces the size of Ca(OH)
2
crystal and the tropism more stochastic.
The heat release rate values in table 15 show that increasing the percentage of CuO nanoparti-
cles up to 4 wt.% in the pastes accelerates peak times and drops heat release rate values. This is
indicative of acceleration in initial cement hydration due to higher content of CuO nanoparticles.
CuO nanoparticles as a nucleation site can accelerate the cement hydration and hence increase
the heat release rate. As stated above, the appearance of the peaks in conduction calorimetry tests
are due to CH and C
3
H compound formation in the cement paste. When CuO nanoparticles are
added to cement paste, the acceleration in formation of CH and C
3
H would result in more rapid
appearance of the related peaks.
Table 16 shows the thermogravimetric analysis results of N-SCC specimens measured in the
110–650
◦
C range in which dehydration of the hydrated products occurred. The results show
that after 28 days of curing, the loss in weight of the specimens is increased by increasing
CuO nanoparticles in concretes up to 4wt.%. Again, as with the results obtained for conduction
Table 15. Calorimetric results of N-SCC specimens.
Sample designation Weight loss First peak Second peak
(%) Time (h) Rate (W/kg) Time (h) Rate (W/kg)
N1-SCC1 304.0 2.0 0.60 16.3 2.66
N2-SCC1 277.8 1.7 0.57 15.2 2.35
N3-SCC1 263.4 1.4 0.54 13.6 2.08
N4-SCC1 243.4 1.1 0.49 12.0 1.88
N5-SCC1 257.3 1.3 0.51 12.9 2.01
384 Ali Nazari and Shadi Riahi
Table 16. Weight loss (%) of the pastes in the range of
110–650
◦
C at 28 days of curing of N-SCC specimens.
Sample designation Weight loss (%)
N1-SCC1 10.4
N2-SCC1 10.3
N3-SCC1 10.1
N4-SCC1 10.0
N5-SCC1 9.8
calorimetry, the increase in weight loss is due to more formation of CH and C
3
H compounds in
the cement paste.
Figure 6 shows XRD analysis of N-SCC specimens at different times after curing. As figure 6
also shows, the peak related to formation of the hydrated products shifts to appear in earlier
times indicating the positive impact of PC on formation of Ca(OH)
2
and C–S–H gel at early age
of cement hydration.
Finally, figure 7 shows SEM micrographs of N-SCC specimens containing 4 wt.% of CuO
nanoparticles. Figure 7 shows a more compact mixture after all days of curing which indicate
rapid formation of C–S–H gel in presence of CuO nanoparticles.
Figure 6. XRD results indicating the formation of hydrated products for different N-SCC specimens:
(a) N1-SCC1, (b) N2-SCC1, (c) N3-SCC1, (d) N4-SCC1 and (e) N5-SCC1.
CuO nanoparticles’ effects on self compacting concrete 385
(1)
(2)
(3)
Figure 7. SEM micrographs of N4-SCC1 specimen at 2 days (1), 7 days (2) and 28 days (3) of curing.
386 Ali Nazari and Shadi Riahi
Some studies have been conducted on compressive strength of cementitious composites rein-
forced by nano-particles and some possible reasons have been represented to show the increment
of compressive strength.
(i) When a small amount of the nano-particles is uniformly dispersed in the cement paste, the
nano-particles act as a nucleus to tightly bond with cement hydrate and further promote
cement hydration due to their high activity, which is favourable for the strength of cement
mortar (Flores-Velez & Dominguez 2002).
(ii) The nano-particles among the hydrate products will prevent crystals from growing which
are positive for the strength of cement paste (Grzeszczyk & Lipowski 1997; Fernandez et al
1999 and Flores-Velez & Dominguez 2004).
(iii) The nano-particles fill the cement pores, thus increasing the strength. Nano–CuO can
contribute in the hydration process to generate C–S–H through reaction with Ca(OH)
2
(Massazza 1987).
In this paper, the strength enhancement under compressive force has been investigated
energetically:
Both nanoparticles and aggregates are exterior particles but the reason why the nanoparticles
are able to make a stronger composite is as a result of the free energy of nucleation sites. The
driving force for the nucleation is the reduction in interfacial free energy between the nucleus
(C–S–H gel) and nucleation site (nanoparticle or aggregates). In comparison between these two
approximately spherical particles (nanoparticle and aggregates), the ratio between surface area to
volume of nanoparticle is much larger than that of aggregates. Therefore, the interaction between
the nanoparticles with CH crystals and formation of C–S–H gel is more accessible than this
reaction between the aggregates and CH crystals.
In addition, the C–S–H gel-nanoparticle interface is probably coherent or semi-coherent. This
is due to this fact that C–S–H gel formed around the nanoparticle could maintain its coherency
with the nanoparticle because both C–S–H gel and nanoparticle have nano-scale dimensions.
But the C–S–H gel formed around the aggregate has a completely incoherent interface with
aggregate. In other words, the sand particle is too large to maintain its coherency with nanoscale
C–S–H gel. Furthermore, in the vicinity of the aggregates, the probability of void formation
and presence of un-reacted cement, other aggregates and even nanoparticles is much more with
respect to the nanoparticle and causes more weak zones in the vicinity of sand. Although sands
act as reinforcement in cementitious matrix, as a result of incoherency under compressive load-
ing, fracture occurrence and crack propagation from the C–S–H gel formed at the surface of the
sand is more probable with respect to the nanoparticle. This phenomenon is very similar to the
effects inclusions and precipitations in metallic alloys where inclusions with incoherent interface
(like aggregate in concrete) can not improve the mechanical properties of the alloy while pre-
cipitates with coherent or semi-coherent interfaces (like nanoparticles in concrete) can improve
mechanical properties of the alloy. Therefore, the smaller nanoparticle size leads to the genera-
tion of heterogeneous nucleation sites and hence shorter early age according to Eq. (2) (Porter
& Easterling 1992; Müller 2007);
I = A.N
T
. exp
−G
∗
kT
, (2)
where I the nucleation rate,
G* the critical free energy for nucleation,
T the absolute temperature,
CuO nanoparticles’ effects on self compacting concrete 387
k the Bultzman’s constant,
A a constant and
N
T
the number of nucleation sites.
In a constant temperature, by increasing N
T
(the smaller nanoparticles) the rate of C–S–H gel
formation is increased causes shorter early age.
In general, the free energy of heterogeneous nucleation from gel on the surface of a foreign
particle (G
het
which here is CuO in the form of aggregate or nanoparticle) could be obtained
from Eq. (3) (Lu & Young 1992; Lin et al 2004);
G
het
=−V
S
.G
V
+ A
sg
.γ
sg
+ A
sp
.γ
sp
− A
sp
.γ
pg
, (3)
where V
S
the volume of solid nucleus,
G
V
the volume energy of solid nucleus,
A
sg
the interface between solid nucleus and gel,
A
sp
the interface between solid nucleus and nanoparticle,
γ
sg
the surface free energy between solid nucleus and gel,
γ
sp
the interface between solid nucleus and nanoparticle and
γ
pg
the surface free energy between nanoparticle and gel.
The negative signs are due to conversion of gel to solid nucleus. In heterogeneous nucleation,
to minimize G*, the nucleus shape must be a part of hemisphere (figure 8). The values of V
S
,
A
sg
and A
sp
could be obtained as (Lu & Young 1992; Porter & Easterling 1992):
V
S
=
πr
3
(
2 +cosθ
)(
1 −cosθ
)
2
2πr
2
(
1 −cosθ
)
(4)
A
sg
= 2πr
2
(
1 −cosθ
)
(5)
A
sp
= πr
2
sin
2
θ, (6)
where r the nucleus radius and θ the wetting angle and is constant during the growth of nucleus
(figure 8).
sg
Gel Solid Gel
pg
γγ
θ
γ
sp
Particle
Figure 8. Heterogeneous nucleation of C–S–H gel upon the sands and nanoparticles.
388 Ali Nazari and Shadi Riahi
Figure 8 shows that the equilibrium condition is obtained when (Porter & Easterling 1992):
γ
pg
= γ
sp
+γ
pg
cos θ or cos θ =
γ
pg
−γ
sp
γ
sg
. (7)
By substituting of Eqs. (4)–(7) into Eq. (3) one may write (Porter & Easterling 1992):
G
het
=
−
4
3
πr
3
G
V
+4πr
2
γ
sg
.S
(
θ
)
, (8)
where S(θ) is the shape factor and could be written as (Porter & Easterling 1992):
S
(
θ
)
=
(
2 +cosθ
)(
1 −cosθ
)
3
4
. (9)
The critical radius of nucleation (r*) could be obtained from the first derivative of Eq. (8) with
respect to r and equalling to zero (Porter & Easterling 1992; Baierlein 2003):
r
∗
=
2γ
sg
G
V
. (10)
By substituting Eq. (10) into Eq. (8) one may write (Porter & Easterling 1992):
G
∗
=
16πγ
3
sg
3G
2
V
.S(θ), (11)
γ
sg
and G
V
depend on the particle composition and are equal for different particle sizes. Eq.
(11) shows that by decreasing θ, G* is also decreased. If both nucleus and nucleation site have
the same crystalline structure and have approximately equal cell parameters, then γ
sp
could be
maintained at its minimum amount and according to Eq. (7), θ is minimized.
From this point of view, G* could be different for nanoparticles and aggregates and may
be greater for aggregates. On the other hand, Eq. (11) could be written as (Porter & Easterling
1992);
G
∗
=
2
3
π
2γ
sg
G
V
3
.G
V
.
(
2 +cosθ
)(
1 −cosθ
)
3
4
=
π
(
r
∗
)
3
(
2 +cosθ
)(
1 −cosθ
)
3
4
.
1
2
G
V
=
1
2
V
∗
G
V
, (12)
where V* is the critical volume of nucleus.
The difference between nucleation on aggregates and nanoparticles is in the volume of nucle-
ated material for reaching to r*. C–S–H gel which is formed around the sand propagates over the
time and makes a large amount of C–S–H gel with incoherent interface since its critical volume
probably reaches to r*.
4. Conclusions
The results obtained in this study can be summarized as follows.
(i) The increased PC content results in decreased compressive strength. It has been argued
that PC retards cement hydration especially at early ages. However, there were no evident
differences between compressive strength of specimens with and without PC.
CuO nanoparticles’ effects on self compacting concrete 389
(ii) As the CuO nanoparticle content is increased up to 4 wt.%, the compressive strength of SCC
specimens is increased. This is due to more formation of hydrated products in the presence
of CuO nanoparticles.
(iii) CuO nanoparticles up to 4 wt.% could accelerate the appearance of the first peak in conduc-
tion calorimetry testing which is related to the acceleration in formation of hydrated cement
products.
(iv) Thermogravimetric analysis shows that CuO nanoparticles could increase the weight loss
of the specimens when partially added to cement paste up to 4 wt.%. More rapid formation
of hydrated products in the presence of CuO nanoparticles (which was confirmed by XRD
results) could be the reason for more weight loss.
(v) The pore structure of self compacting concrete containing CuO nanoparticles is improved
and the content of all mesopores and macropores is decreased.
References
Abell A B, Willis K L and Lange D A 1999 Mercury Intrusion Porosimetry and Image nalysis of Cement-
Based Materials, J. Colloid Interface Sci. 211: 39–44
Baierlein R 2003 Thermal physics. Cambridge University Press. ISBN 0-521-658381
Bjornstrom J, Martinelli A, Matic A, Borjesson L and Panas I 2004 Accelerating effects of colloidal nano-
silica for beneficial calcium–silicate–hydrate formation in cement, Chem. Phys. Lett. 392(1–3): 242–248
Bosiljkov V B 2003 SCC mixes with poorly graded aggregate and high volume of limestone filler, Cem.
Concr. Res. 33(9): 1279–1286
Campillo I, Guerrero A, Dolado J S, Porro A, Ibáñez J A and Goñi S 2007 Improvement of initial
mechanical strength by nanoalumina in belite cements, Mater. Lett. 61: 1889–1892
Chopin D, Francy O, Lebourgeois S and Rougeau P 2003 ‘Aleep and shrinkage of heat-cured self compact-
ing concrete (SCC)’, In: O Wallevik and I Nielsson, (eds.), Proceedings of the 3rd international RILEM
symposium on self-compacting concrete, RILEM Publications S.A.R.L., Reykjavik, 672–683
Daoud A, Lorrain M and Laborderie C 2003 ‘Anchorage and cracking behaviour of self-compacting con-
crete’, In: O Wallevik and I Nielsson, (eds.) Proceedings of the 3rd international RILEM symposium on
self compacting concrete, RILEM Publications S.A.R.L., Reykjavik, 692–702
Fava C, Bergol L, Fornasier G, Giangrasso F and Rocco C 2003 ‘Fracture behaviour of self–compacting
concrete’, In: O Wallevik and I Nielsson, (eds.) Proceedings of the 3rd international RILEM symposium
on self-compacting concrete, RILEM Publications S.A.R.L., Reykjavik, 628–636
Fernandez E, Gil F J, Ginebra M P, Driessens F C M, Planell J A and Best S M 1999 ‘Production and
characterisation of new calcium phosphate bone cements in the CaHPO4-a-Ca3(PO4)2 system: pH,
workability and setting times’, J. Mater. Sci. Mater. Med. 10: 223–230
Flores-Velez L M and Dominguez O 2002 ‘Characterization and properties of Portland cement composites
incorporating zinc-iron oxide nanoparticles’, J. Mater. Sci. 37: 983–988
Grzeszczyk S and Lipowski G 1997 ‘Effect of content and particle size distribution of high calcium fly ash
on the rheological properties of cement pastes’, Cem. Concr. Res. 27(6): 907–916
Hammer T A, Johansen K and Bjøntegaard Ø 2001 ‘Volume changes as driving forces to self-induced
cracking of norwegian SCC’, In: K Ozawa and M Ouchi, (eds.) Proceedings of the 2nd international
RILEM symposium on self-compacting concrete, Published by COMS Engineering Corporation, Tokyo,
423–432
Hauke B 2001 ‘Self-compacting concrete for precast concrete products in Germany’, In: K Ozawa and
M Ouchi, (eds.) Proceedings of the 2nd international RILEM symposium on self-compacting concrete,
Published by COMS Engineering Corporation, Tokyo, 633–642
Jawed J, Skalny J and Young J F 1983 ‘Hydration of Portland Cement. Structure and Performance of
Cements, P Barnes (ed.)’, Essex: Applied Science Publishers, 284–285
390 Ali Nazari and Shadi Riahi
Ji T 2005 ‘Preliminary study on the water permeability and microstructure of concrete incorporating nano-
SiO2’, Cem. Concr. Res. 35(10): 1943–1947
Jo B-W, Kim C-H, Tae G-h and Park J-B 2007 ‘Characteristics of cement mortar with nano-SiO2 particles’,
Construct. Build. Mater. 21(6): 1351–1355
Klug Y and Holschemacher K 2003 ‘Comparison of the hardened properties of self-compacting and normal
vibrated concrete’, In: O Wallevik and I Nielsson, (eds.) Proceedings of the 3rd international RILEM
symposium on self-compacting concrete, RILEM Publications S.A.R.L., Reykjavik, 596–605
Köning G, Holsechemacher K, Dehn F and Weiβe D 2001 ‘Self-compacting concrete-time development of
material properties and bond behavior’, In: K Ozawa and M Ouchi, (eds.) Proceedings of the 2nd interna-
tional RILEM symposium on self-compacting concrete, Published by COMS Engineering Corporation,
Tokyo, 507–516
Li H, Xiao H and Ou J 2004 ‘A study on mechanical and pressure-sensitive properties of cement mortar
with nanophase materials’, Cement and Concrete Res. 34: 435–438
Li H, Zhang M and Ou J 2007 ‘Flexural fatigue performance of concrete containing nanoparticles for
pavement’, Int. J. Fatigue, 29: 1292–1301
Li Z, Wang H, He S, Lu Y and Wang M 2006 ‘Investigations on the preparation and mechanical properties
of the nano-alumina reinforced cement composite’, Mater. Lett. 60: 356–359
Lin Y H, Tyan Y Y, Chang T P, Chang C Y 2004 An assessment of optimal mixture for concrete made with
recycled concrete aggregates. Cem. Concr. Res. 34(8): 1373–1380
Lu P, Young J F 1992 Hot pressed DSP cement paste, Material Res. Soc. Symposium Proceedings, 245
Makishima O, Tanaka H, Itoh Y, Komada K and Satoh F 2001 ‘Evaluation of mechanical properties and
durability of super quality concrete’, In: K Ozawa and M Ouchi, (eds.) Proceedings of the 2nd interna-
tional RILEM symposium on self-compacting concrete, Published by COMS Engineering Corporation,
Tokyo, 475–482
Massazza F 1987 ‘The role of the additions to cement in the concrete durability’, Cemento 84: 359–382
Müller I 2007 A history of thermodynamics - The doctrine of energy and entropy. Springer. ISBN 978-3-
540-46226-2
Nazari A 2010 The effects of curing medium on flexural strength and water permeability of concrete
incorporating TiO
2
nanoparticles, Mater. Struct. doi:10.1617/s11527-010-9664-y
Nazari A, Riahi S 2010a Microstructural, thermal, physical and mechanical behavior of the self compacting
concrete containing SiO2 nanoparticles, Mater. Sci. Eng. A 527: 7663–7672
Nazari A, Riahi S 2010b The effects of TiO
2
nanoparticles on flexural damage of self-compacting concrete,
Int. J. Damage Mech. doi:10.1177/1056789510385262
Nazari A, Riahi S 2010c The effect of TiO
2
nanoparticles on water permeability and ther-
mal and mechanical properties of high strength self-compacting concrete, Mater. Sci. Eng. A.
doi:10.1016/j.msea.2010.09.074
Nazari A, Riahi S 2010d The effects of zinc dioxide nanoparticles on flexural strength of self-compacting
concrete, Composites Part B: Engineering, doi:10.1016/j.compositesb.2010.09.001
Nazari A, Riahi S 2010e The effects of ZnO
2
nanoparticles on split tensile strength of self-compacting
concrete, J. Exp. Nanoscience. doi:10.1080/17458080.2010.524669
Nazari A, Riahi S 2010f Limewater effects on properties of ZrO
2
nanoparticle blended cementitious
composite, J. Compos. Mater. doi:10.1177/0021998310376118
Nazari A, Riahi S 2010g Assessment of the effects of Fe
2
O
3
nanoparticles on water permeability,
workability, and setting time of concrete, J. Compos. Mater. doi:10.1177/0021998310377945
Nazari A, Riahi S 2010h The effects of limewater on flexural strength and water permeability of Al
2
O
3
nanoparticles binary blended concrete, J. Compos. Mater. doi:10.1177/0021998310378907
Nazari A, Riahi S 2010i The effects of limewater on split tensile strength and workability of Al
2
O
3
nanoparticles binary blended concrete, J. Compos. Mater. doi:10.1177/0021998310378909
Nazari A, Riahi S 2010j The effects of TiO
2
nanoparticles on properties of binary blended concrete,
J. Compos. Mater. doi:10.1177/0021998310378910
Nazari A, Riahi S 2010k Optimization mechanical properties of Cr
2
O
3
nanoparticle binary blended
cementitious composite, J. Compos. Mater. doi:10.1177/0021998310377944
CuO nanoparticles’ effects on self compacting concrete 391
Porter D A and Easterling K E 1992 Phase Transformation in Metals and Alloys, 2nd ed. London: Chapman
Hall
Puertas F, Santos H, Palacios M and Martínez-Ramírez S 2005a ‘Polycarboxylate superplasticiser admix-
tures: effect on hydration, microstructure and rheological behavior’, Advances in Cement Res. 17(2):
77–89
Puertas F, Alonso M M and Vázquez T 2005b ‘Effect of polycarboxylate admixtures on portland cement
paste setting and rheological behavior’, Materiales de Construcción 55(277): 61–73
Roncero J and Gettu R 2002 ‘Influencia de los superplastificantes en la microestructura de la pasta hidratada
y en el comportamiento diferido de los morteros de cement’, Cemento Hormigón 832: 12–28
Song H W, Byun K J, Kim S H and Choi D H 2001 ‘Early-age creep and shrinkage in self-compacting
concrete incorporating GGBFS’, In: K Ozawa and M Ouchi, (eds.) Proceedings of the 2nd international
RILEM symposium on self-compacting concrete, Published by COMS Engineering Corporation, Tokyo,
413–422
Su N, Hsu K and Chai H 2001 ‘A simple mix design method for self-compacting concrete’, Cement and
Concrete Res. 31(12): 1799–1807
Tanaka K and Kurumisawa K 2002 ‘Development of technique for observing pores in hardened cement
paste’, Cement and Concrete Res. 32: 1435–1441
Wu Z W and Lian H Z 1999 ‘High performance concrete’, Beijing: Railway Press of China, 43
Ye Q 2001 ‘The study and development of the nano-composite cement structure materials’, New Building
Materials, 1: 4–6
Ye G, Xiu X, De Schutter G, Poppe A M, Taerwe L 2007 Influence of limestone powder as filler in SCC
on hydration and microstructure of cement pastes, Cem. Concr. Compos. 29(2): 94–102
Zivica V 2009 ‘Effects of the very low water/cement ratio’, Constr. Build. Mater. 23(8): 2846–2850