hydrothermal synthesis and humidity sensing property of zno nanostructures
Bạn đang xem bản rút gọn của tài liệu. Xem và tải ngay bản đầy đủ của tài liệu tại đây (2.1 MB, 10 trang )
Hydrothermal synthesis and humidity sensing property of ZnO nanostructures
and ZnOAIn(OH)
3
nanocomposites
Edit Pál
a,
⇑
, Viktória Hornok
b
, Robert Kun
a
, Albert Oszkó
c
, Torben Seemann
d
, Imre Dékány
b
,
Matthias Busse
a,d
a
University of Bremen, Faculty of Production Engineering, FB 04, Near Net Shape Technologies, Wiener Str. 12, 28359 Bremen, Germany
b
Supramolecular and Nanostructured Materials Research Group of the Hungarian Academy of Sciences, Aradi vt. 1, 6720 Szeged, Hungary
c
Department of Physical Chemistry and Material Science, University of Szeged, Aradi vt. 1, 6720 Szeged, Hungary
d
Fraunhofer Institute for Manufacturing Technology and Advanced Materials Research (IFAM), Wiener Str. 12, 28359 Bremen, Germany
article info
Article history:
Received 27 February 2012
Accepted 18 April 2012
Available online 26 April 2012
Keywords:
ZnO nanoparticles
Indium hydroxide
Hydrothermal method
Nanocomposites
Photoluminescence
Water vapor sensor
abstract
Prism- and raspberry-like ZnO nanoparticles and ZnOAIn(OH)
3
nanocomposites were prepared by tem-
plate free hydrothermal method. XRD investigations and microscopic studies showed that pill-like
In(OH)
3
particles with body-centered cubic crystal structure formed on the surface of ZnO nanoparticles
resulting in increased specific surface area. TEM–EDX mapping images demonstrated that not only nano-
composite formation took place in the course of the synthesis, but zinc ions were also built into the crys-
tal lattice of the In(OH)
3
. However, only undoped In(OH)
3
was found on the surface of the pill-like particle
aggregates by XPS analyses. The raspberry- and prism-like ZnO particles exhibit strong visible emission
with a maximum at 585 and 595 nm, respectively, whose intensity significantly increase due to nano-
composite formation. Photoelectric investigations revealed that photocurrent intensity decreased with
increasing indium ion concentration during UV light excitation, which was explained by increase in vis-
ible fluorescence emission. QCM measurements showed that morphology of ZnO and concentration of
In(OH)
3
had an influence on the water vapor sensing properties.
Ó 2012 Elsevier Inc. All rights reserved.
1. Introduction
Sensing the relative humidity of our environment is a very
important issue in various fields like medical, automotive, food
processing and semiconductor industries, in agriculture and for
human comfort [1]. Humidity or gas sensors of nanostructured
material allow better sensing properties than their bulk phase
materials owing to their huge surface-to-volume ratio. In the last
years, many metal oxide nanostructures including In
2
O
3
,WO
3
,
SnO
2
, ZrO
2
, TiO
2
, ZnO, etc. have been studied [2,3]. ZnO is an n-type
semiconductor oxide with a wide band gap energy (3.37 eV) and a
large excitation binding energy (60 meV). Due to its favorable
structural, optical and catalytic properties, it is often used as
photocatalyst [4–6], UV nanolaser [7] in UV light emitting diode
[8,9] in solar cell [10,11] and in biosensing application [12,13] as
well.
ZnO nanoparticles have been synthesized by various physical
and chemical methods like rf magnetron sputtering [14] thermal
evaporation [15,16], chemical vapor deposition [17], chemical bath
deposition [18], spray pyrolysis [19,20], sol–gel technique [21,22],
precipitation reaction [23], hydrolysis [24,25], microwave assisted
synthesis [26] and hydrothermal method [27,28]. Hydrothermal
method is a relatively simple preparation technique of hierarchical
ZnO nano- and micro-structures such as ZnO prisms, flowers, rods
and spheres. In the course of the hydrothermal reaction, water-
soluble capping or chelating agent like polymers [29,30], polyelec-
trolytes [31], anions [32], surfactants [33] or other organic
compounds [34,35] are often used, which can influence the forma-
tion of the hierarchical structures during the self-assembly reac-
tion. Not only the capping or chelating agent can influence the
growth pattern of the structure, but also the concentration of reac-
tants, the temperature and time of hydrothermal process, and pH
value [36,37].
ZnO nanocomposites (e.g. ZnOAAu, ZnOACdS or ZnOApolyelec-
trolyte) provide the possibility for enhanced functionality, such as
optical property [38], photocatalytic activity [39], UV photosensi-
tivity [40] or humidity sensitivity [41]. In(OH)
3
is an important
semiconductor having potential application in solar energy and
electronics [42]. Its band gap is 5.15 eV [43]. Recently, only several
papers deal with the investigation of In(OH)
3
nanoparticles. These
papers report the preparation of In(OH)
3
nanostructures with
different morphologies, like cubes, flowers, rods, spheres by wet
chemical methods, for example hydrolysis [44], double-jet
0021-9797/$ - see front matter Ó 2012 Elsevier Inc. All rights reserved.
/>⇑
Corresponding author. Fax: +49 421 2246300.
E-mail address: (E. Pál).
Journal of Colloid and Interface Science 378 (2012) 100–109
Contents lists available at SciVerse ScienceDirect
Journal of Colloid and Interface Science
www.elsevier.com/locate/jcis
precipitation [45], solvothermal [46] and hydrothermal method
[47,48], and their structural and optical characterization. But to
our knowledge, the synthesis of ZnOAIn(OH)
3
nanocomposites
has not been reported yet.
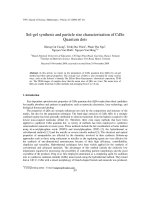
Fig. 1. SEM image of prism-like ZnO (a), and ZnOAIn(OH)
3
nanocomposites at 1 at.% (b), 5 at.% (c), and 10 at.% (d) In(III) concentration.
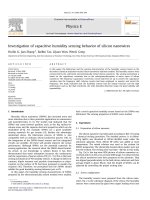
Fig. 2. SEM image of raspberry-like ZnO (a), and ZnOAIn(OH)
3
nanocomposites at 1 at.% (b), 5 at.% (c), and 10 at.% (d) In(III) ion concentration.
E. Pál et al. /Journal of Colloid and Interface Science 378 (2012) 100–109
101
In this study, prism-like and raspberry-like ZnO particles and
their In(OH)
3
nanocomposites with different indium ion content
were prepared by template free hydrothermal method at 80 °C.
Their morphology, structure, chemical composition and growth
mechanism are discussed; furthermore, we would like to point
out the effect of nanocomposite formation and morphology on
the optical, and humidity sensing properties of the samples.
2. Experimental
2.1. Materials
Zinc nitrate hexahydrate (Zn(NO
3
)
2
Á6H
2
O Fluka,P99 %), sodium
hydroxide (NaOH, Fluka,P99 %), indium chloride tetrahydrate (In-
Cl
3
Á4H
2
O, Sigma–Aldrich, 97 %) and distilled water were used as re-
ceived to prepare zinc oxide nanoparticles.
2.2. Preparation of ZnO nanoparticles with different morphology
0.744 g zinc nitrate was dissolved in 37.5 ml distilled water and
heated in a 100 ml autoclave at 80 °C, then 12.5 ml sodium hydrox-
ide solution (c = 0.4 mol/dm
3
) was added into the solution under
vigorous stirring. By the preparation of raspberry-like ZnO parti-
cles, the sodium hydroxide solution was added dropwise that re-
sults in the formation of a white suspension immediately. In case
of the prism-like ZnO particles, sodium hydroxide solution was
added simultaneously; thus, first a colorless solution then a white
suspension was formed. In the course of the preparation of nano-
composite samples, the zinc nitrate and indium chloride at ade-
quate atomic ratio (1, 5, 10 at.% In(III)) were dissolved together in
distilled water. After 3 h heat treatment, the autoclave was cooled
naturally and the white precipitate was collected by centrifugation
at 9000 rpm/10 min, washed with distilled water and dried in air at
50 °C.
2.3. Methods
Morphology of ZnO nanoparticles was studied by a FEI Helios
Nanolab™ 600 Dualbeam™ scanning electron microscope (FIB–
SEM).
X-ray diffraction (XRD) measurements were taken on a Siemens
D5000 (Cu K
a
radiation, 40 kV, 30 mA) diffractometer at ambient
temperature in 20–80° 2
H
range. Specific surface areas (a
s,BET
)
were determined using a Quantachrome gas adsorption analyzer
at À196 °C in liquid nitrogen. Prior to the measurements, samples
were preheated at 50 °C in vacuum (0.01 Torr) for 48 h. The
adsorption isotherms were analyzed by the means of BET equation.
The chemical composition of alloy nanoparticle surfaces was
analyzed by X-ray photoelectron spectroscopy (XPS) and energy-
dispersive X-ray spectroscopy (EDX). X-ray photoelectron spec-
troscopy (XPS) measurements were taken on a Specs, PHoibos
150 MCD9 X-ray photoelectron spectrometer. The excitation
source was the non-monochromatic K
a
radiation of magnesium
anode (h
m
= 1253.6 eV). The gun was operated at 225 W power
(15 kV, 15 mA). The pressure in the analyzing chamber was less
then 5 Â 10
À9
mbar during the spectrum acquisition. The C 1s
binding energy of adventitious carbon was used as energy refer-
ence: it was taken at 285.1 eV. EDX spectra and EDX mapping
images were taken by a Tecnai F20 S-Twin transmission electron
microscope (TEM) equipped with an EDAX r-TEM energy-
dispersive X-ray detector (EDX) using gold/silicon TEM grids.
Thermogravimetric (TG) and differential scanning calorimetric
(DSC) measurements were taken on a Netzsch STA 409 thermoan-
alytical instrument. The samples (m = 40 mg) were heated in Al
2
O
3
Table 1
Primary particle size of In(OH)
3
nanoparticles determined from SEM images.
Sample d (nm)
Prism-like Raspberry-like
ZnOAIn(OH)
3
1 at.% In(III) 78.7 ± 6.0 35.6 ± 9.2
ZnOAIn(OH)
3
5 at.% In(III) 14.6 ± 4.8 21.0 ± 4.7
ZnOAIn(OH)
3
10 at.% In(III) 9.2 ± 4.6 11.2 ± 3.3
20 30 40 50 60 70 80
2
Θ
(°)
I (a.u.)
ZnO-In(OH)
3
10 at. % In(III)
ZnO
ZnO-In(OH)
3
1 at. % In(III)
ZnO-In(OH)
3
5 at. % In(III)
ZnO
d
(100)
ZnO
d
(201)
ZnO
d
(112)
ZnO
d
(200)
ZnO
d
(103)
ZnO
d
(110)
ZnO
d
(102)
ZnO
d
(101)
ZnO
d
(002)
ZnO
d
(202)
ZnO
d
(004)
200 cps
In(OH)
3
d
(200)
In(OH)
3
d
(220)
In(OH)
3
d
(420)
In(OH)
3
d
(400)
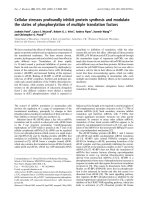
Fig. 3. XRD patterns of the raspberry-like ZnO and ZnOAIn(OH)
3
nanocomposites.
Table 2
Average crystallite size of ZnO and In(OH)
3
determined from the XRD patterns.
Sample Prism-like Raspberry-like
d
(101)ZnO
(nm)
d
ð200ÞInðOHÞ
3
(nm)
d
(101)ZnO
(nm)
d
ð200ÞInðOHÞ
3
(nm)
ZnO 126.1 – 41.4 –
ZnOAIn(OH)
3
1 at.%
In(III)
137.3 80.4 41.3 41.5
ZnOAIn(OH)
3
5 at.%
In(III)
132.7 17.1 36.8 23.5
ZnOAIn(OH)
3
10 at.% In(III)
117.8 12.3 34.4 13.9
102 E. Pál et al. /Journal of Colloid and Interface Science 378 (2012) 100–109
sample holder in the temperature range of 25–1000 °C with
10 °C/min heating rate in air.
Absorbance spectrum of powder samples was measured by a
Micropack Nanocalc spectrophotometer equipped with a Micro-
pack HPX-2000 xenon light source (P = 50 W) using an integration
sphere. Fluorescence emission properties of the powder samples
were determined by a Horiba Jobin Yvone Fluoromax-4 spectroflu-
orometer at 350 nm excitation wavelength. Photoelectric measure-
ments were taken by a Keithley Model 2001 Series Multimeter
using an EA-PSI8160-04 DT power supply. The applied light source
was a Dymax Blue Wave 200 mercury lamp (P = 200 W). During
measurements, the applied voltage was 3 V and the distance be-
tween the electrode and the light source was 5 cm. The baseline
was recorded in dark, followed by the irradiation of the ZnO and
ZnOAIn(OH)
3
nanocomposite coated copper electrode. Due to the
irradiation, a current signal could be detected. The concentration
of samples on the electrode surface was 10 ± 0.05 mg/cm
2
.Water
vapor sensor tests were carried out by quartz crystal microbalance
(SRS QCM 200) at room temperature in a self constructed measur-
ing cell. Thin layers of powder samples (m = 100
l
g) were depos-
ited by dropping of their isopropanolic suspension onto the
surface of 5 MHz chrome/gold crystals, and the frequency and
resistivity decrease were detected over saturated solution of LiCl,
MgCl
2
, NaCl and K
2
SO
4
salts. Response was calculated from the
resistivity change in ZnO covered quartz crystal as follows:
Response ð%Þ¼
R
0
ÀR
RH
R
0
Á 100, where R
0
is the resistivity of the ZnO
layer dried in desiccator and R
RH
is the resistivity measured at gi-
ven relative humidity. The mass change upon water vapor adsorp-
tion was calculated from the following equation:
D
m ¼À
D
f
C
f
, where
D
m is the mass change (g/cm
2
),
D
f is the change in frequency (Hz)
and C
f
sensitivity factor of the crystal (56.6 Hz cm
2
/g).
3. Results and discussion
3.1. Morphological, structural properties and chemical composition of
ZnO and In(OH)
3
nanocomposite samples
The morphology of the samples was studied by scanning elec-
tron microscopy. It was found that prism-like ZnO particles with
an average diameter of 50–100 nm and with 0.5–1.2
l
m of length
were prepared (Fig. 1a). As the SEM images of prism-like
ZnOAIn(OH)
3
nanocomposites illustrate, pill-like particle aggre-
gates were formed on the surface of ZnO prisms whose amount in-
creases with the indium ion concentration (Fig. 1b–d).
In Fig. 2a–d, raspberry-like ZnO particles and ZnOAIn(OH)
3
nanocomposites are presented. According to the acquired images,
the raspberry-like ZnO nanoparticles have a diameter of 200 nm
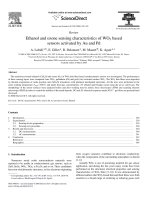
Fig. 4a. TEM–EDX analysis of prism-like ZnOAIn(OH)
3
nanocomposites at 1 at.% In(III) concentration.
Fig. 4b. TEM–EDX mapping images of prism-like ZnOAIn(OH)
3
nanocomposites at 5 at.% In(III) concentration.
E. Pál et al. /Journal of Colloid and Interface Science 378 (2012) 100–109
103
and pill-like aggregates form besides the raspberry-like particles in
the presence of indium ions.
Figs. 1 and 2 show that the primary particle size decreases (Ta-
ble 1), while the aggregate size of In(OH)
3
increases with the in-
dium ion concentration that can be explained as follows: at low
precursors concentrations, the In(OH)
3
nuclei can grow freely,
resulting in larger primary crystallite size and smaller aggregates.
At higher precursor concentrations, the numerous nuclei formed
hinder each other’s growth resulting in smaller crystallite size,
and due to the attractive interactions they form larger aggregates.
The phase structure of the samples was characterized using
XRD. Fig. 3 shows the results of the XRD measurements of rasp-
berry-like ZnO nanoparticles and nanocomposite samples. It can
be established that the ZnO sample has hexagonal wurtzite type
crystal structure, and no other or impurity phase appears in the
patterns (36-1451 JCPDS card). In the XRD pattern of the nanocom-
posite samples, new peaks can be observed, which are characteris-
tic of the In(OH)
3
with body-centered cubic crystal structure
(76-1463 JCPDS card). It can also be seen that the intensity of
ZnO peaks diminishes and their width slightly broadens, while
the intensity of In(OH)
3
peaks increases and their width broadens
as a consequence of rising indium ion concentration indicating that
the average primary particle size of ZnO and In(OH)
3
reduces. The
crystallite sizes determined from the d
(101)
and d
(200)
diffraction
peaks of ZnO and In(OH)
3
are listed in Table 2. The crystallite sizes
of In(OH)
3
determined from the XRD patterns are in a good agree-
ment with the SEM studies.
EDX and XPS measurement were carried out in order to deter-
mine the chemical composition of the nanocomposite samples.
Fig 4a illustrates the results of TEM–EDX analyses of ZnOAIn(OH)
3
nanocomposite sample at 1 at.% In(III) concentration. The EDX
spectrum taken from a prism-like crystal (area 1) shows the pres-
ence of zinc and the absence of indium in this area. The second
analysis was taken from the pill-like particles (area 2), where not
only indium but also zinc peaks could be detected.
TEM–EDX mapping images of the nanocomposite sample at
5 at.% In represent similar results, namely the prism-like particles
are build up from ZnO, while the pill-like In(OH)
3
particles contain
zinc ions (Fig. 4b). The EDX analysis of prism-like nanocomposite
sample at 10 at.% In(III) and raspberry-like nanocomposite series
provided similar results.
The chemical composition of particle surfaces was investigated
by XPS. Fig. 5 shows the Zn 2p
3/2
, O 1s and In 3d XPS spectra of the
prism-like ZnO and ZnOAIn(OH)
3
nanocomposite samples. The Zn
2p
3/2
peak of all samples located at 1021.7 eV is characteristic of
the wurtzite type ZnO [31]. The high resolution O 1s XPS spectrum
of the ZnO sample can be fitted into three peaks. The peak found at
530.4 eV belongs to the ZnAO bonding in ZnO [49], while the peaks
at 531.9 eV and 532.9 eV can be ascribed to the ZnAOH bonding
and to the presence of C@O bonding originated from the surface
adsorbed water and CO
2
molecules, respectively. The O 1s spectra
of the nanocomposite samples are similar, but the peak at ca.
531.9 eV can be assigned not only to the ZnAOH bonding, but also
the InAOH bonding [50]. The indium 3d peaks appear at 444.7 eV
Fig. 5. Zn 2p, O 1s and In 3d XPS spectra of prism-like ZnO and ZnOAIn(OH)
3
nanocomposites.
80
82
84
86
88
90
92
94
96
98
100
0 100 200 300 400 500
T (°C)
Weight loss (%)
0
0.2
0.4
0.6
0.8
1
ZnO
DSC (mW/mg)
Exo
ZnO-In(OH)
3
1 at. % In(III)
ZnO-In(OH)
3
10 at. % In(III)
ZnO-In(OH)
3
5 at. % In(III)
Fig. 6. TG and DSC curves of raspberry-like ZnO and ZnOAIn(OH)
3
nanocomposites.
104 E. Pál et al. /Journal of Colloid and Interface Science 378 (2012) 100–109
(In 3d
5/2
) and at 452.1 eV (In 3d
3/2
), which are characteristic of
In(OH)
3
and verify the presence of indium hydroxide. Since in
the XPS spectra of the samples, no peak shift of Zn 2p, O 1s and
In 3d peaks could be observed, it can be asserted that only pure
(undoped) ZnO and pure In(OH)
3
are on the surface of the particles.
The raspberry-like ZnO and ZnOAIn(OH)
3
nanocomposite samples
demonstrate similar XPS characteristics.
Based on the above discussed results, the formation mechanism
of the ZnO and ZnOAIn(OH)
3
nanocomposite structures are proba-
bly as follows. In case of the preparation of prism-like particles,
adding rate of the NaOH solution is rapid; thus, the concentration
of OH
À
ions in the system becomes suddenly high leading to the
formation of a colorless reaction system containing [Zn(OH)
4
]
2À
complexes. Through the dehydration of [Zn(OH)
4
]
2À
complexes,
ZnO nuclei form [51], which start to grow into the direction of c-
axis due to repeating nucleation occurred on the c-face area of
the crystals [37]. By the preparation of raspberry-like particles,
the adding rate of the room temperature NaOH solution is moder-
ated, thus the concentration of OH
À
ions slowly increases. So thus,
only Zn(OH)
2
precipitate is forming, which can immediately trans-
form to ZnO nuclei. Since during the addition of NaOH solution, the
generation of Zn(OH)
2
particles is continually and their conversion
to ZnO nuclei is continuous as well, we assume that the ZnO nuclei
can grow together developing the raspberry-like form. If indium
ions are also present in the reaction system ZnO particles generate
first followed by the hydrolysis of indium precursor and condensa-
tion of In(OH)
3
nuclei on the ZnO particle surfaces resulting pill-
like In(OH)
3
particles on the ZnO crystals. Since the growth of
the ZnO particles and the generation and condensation of In(OH)
3
nuclei happen simultaneously, zinc complex species still presented
in the system can be capped in course of the formation of In(OH)
3
particles. At the end of the formation process of In(OH)
3
particles,
there is no zinc complex species to be capped eventuate in the
presence of undoped In(OH)
3
on the In(OH)
3
particle surfaces.
Thermal characteristics of ZnO and nanocomposite samples
were also investigated. The TG and DSC curves of raspberry-like
series are presented in Fig. 6. The decomposition of raspberry-like
ZnO sample takes place in two steps. At lower temperature ranges
(ca. 25–150 °C), the physisorbed, while at higher temperature
ranges (up to 260 °C), the chemisorbed, water molecules are re-
leased in two endothermic steps. The mass stability was reached
at 260 °C. In case of the nanocomposite samples, two endothermic
steps can be observed as well, but in the second step, the decom-
position process of In(OH)
3
to In
2
O
3
appears as well making the
DCS peak asymmetric. As the amount of In(OH)
3
in the nanocom-
posite samples raises, the weight losses and DSC peak areas in-
crease in the decomposition steps, the temperature of mass
stability shift toward the higher temperature values. The charac-
teristic decomposition temperature ranges, the weight losses,
DSC peak maxima and total enthalpy values are listed in Table 3.
The prism-like ZnO and ZnOAIn(OH)
3
nanocomposite samples
show similar thermoanalytic characteristics, but as the summa-
rized data in Table 3 show, the corresponding decomposition tem-
perature ranges are developing at even lower temperatures.
Table 3
Thermoanalytic properties of ZnO and ZnO nanocomposite samples.
Sample Prism-like Raspberry-like
TG temperature
range (°C)
Weight loss
(%)
DSC peak maximum
(°C)
D
H (J/
g)
TG temperature
range (°C)
Weight loss
(%)
DSC peak maximum
(°C)
D
H (J/
g)
ZnO 25–105 0.36 57 0.17 25–149 0.77 58 0.90
125–250 1.04 221 0.05 174–259 0.38 228 0.22
ZnOAIn(OH)
3
1 at.%
In(III)
25–97 0.11 58 0.15 25–143 0.78 68 0.85
195–284 0.97 246 0.69 207–296 1.41 267 0.41
ZnOAIn(OH)
3
5 at.%
In(III)
25–138 1.40 68 1.09 25–154 0.91 72 1.22
160–298 4.49 258 1.82 160–310 3.92 271 1.70
ZnOAIn(OH)
3
10 at.%
In(III)
25–149 2.57 79 2.20 25–147 1.52 74 1.12
156–313 9.13 269 5.05 157–316 6.31 276 2.89
Table 4
Specific surface area of the ZnO and ZnO nanocomposite samples.
Sample a
s,BET
(m
2
/g)
Prism-like Raspberry-like
ZnO 7.7 14.2
ZnOAIn(OH)
3
1 at.% In(III) 6.4 20.2
ZnOAIn(OH)
3
5 at.% In(III) 37.3 35.9
ZnOAIn(OH)
3
10 at.% In(III) 76.3 49.8
0
0.1
0.2
0.3
0.4
0.5
0.6
0.7
0.8
0.9
350 400 450 500 550
λ
(nm)
A
ZnO
ZnO-In(OH)
3
1 at. % In(III)
ZnO-In(OH)
3
5 at. % In(III)
ZnO-In(OH)
3
10 at. % In(III)
Fig. 7. Absorbance spectra of raspberry-like ZnO and ZnOAIn(OH)
3
nanocomposites.
Table 5
Optical properties of ZnO and ZnO nanocomposite samples.
Sample E
g
(eV)
Prism-like Raspberry-like
ZnO 3.01 3.06
ZnOAIn(OH)
3
1 at.% In(III) 3.03 3.08
ZnOAIn(OH)
3
5 at.% In(III) 3.05 3.10
ZnOAIn(OH)
3
10 at.% In(III) 3.09 3.13
E. Pál et al. /Journal of Colloid and Interface Science 378 (2012) 100–109
105
To define the effect of nanocomposite formation on the specific
surface area, the samples were subjected to low temperature nitro-
gen adsorption measurements. The adsorption isotherm of ZnO
and ZnOAIn(OH)
3
nanocomposite samples shows no hysteresis
revealing that the samples are not porous. However, the specific
surface area values determined by BET method increase signifi-
cantly with the concentration of indium ions owing to the forma-
tion of rising amount of In(OH)
3
nanoparticles (Table 4).
3.2. Optical properties of nanocomposites
The UV–Vis optical properties of ZnO and ZnOAIn(OH)
3
nano-
composite samples were also examined. Both prism- and rasp-
berry-like series show similar characteristics. As illustrated, the
UV–V is absorbance spectra of raspberry-like ZnO and nanocom-
posite structures are presented in Fig 7. Compared to ZnO, the
spectra of nanocomposites shift toward the shorter wavelength,
indicating the rise of band gap energy (E
g
) explained by decreasing
crystallite size of ZnO particles. The E
g
values determined from the
adsorption edge are summarized in Table 5.
Fig. 8a displays the photoluminescence spectra of prism-like
ZnO and ZnOAIn(OH)
3
nanocomposite samples applying 350 nm
excitation wavelength. The ZnO prisms exhibit a weak UV-emis-
sion peak at 385 nm can be attributed to the direct exciton recom-
bination, and a wide visible emission band with a maximum at
592 nm results from the presence of oxygen vacancies (V
þ
o
)
[52,53]. In the spectrum of ZnOAIn(OH)
3
at 1% In(III) nanocompos-
ite sample, the intensity of UV- and visible-emission peaks of ZnO
increases, in addition two new blue emission bands with a maxi-
mum at 421 nm and 440 nm can also be observed. These new
bands originate from the In(OH)
3
particles attributed to the radia-
tive recombination of photoexcited holes and electrons occupying
the oxygen vacancies in In(OH)
3
[54]. Further intensity increase in
visible-emission band of ZnO can be detected, but the new blue
0.0E+00
4.0E+05
8.0E+05
1.2E+06
1.6E+06
2.0E+06
350 400 450 500 550 600 650 700 750 800 850
λ
(nm)
I (cps)
0.E+00
5.E+04
1.E+05
2.E+05
2.E+05
3.E+05
3.E+05
370 420 470
λ
(nm)
I (cps)
ZnO
ZnO-In(OH)
3
1 at. % In(III)
ZnO-In(OH)
3
5 at. % In(III)
ZnO-In(OH)
3
10 at. % In(III)
ZnO
1 at. % In(III)
5 at. % In(III)
10 at. % In(III)
Fig. 8b. PL emission spectra of raspberry-like ZnO and ZnOAIn(OH)
3
nanocomposites ((k
g
= 350 nm).
0.E+00
1.E+05
2.E+05
3.E+05
4.E+05
5.E+05
6.E+05
7.E+05
λ
(nm)
I (cps)
0.E+00
1.E+05
2.E+05
3.E+05
4.E+05
5.E+05
6.E+05
7.E+05
λ
(nm)
I (cps)
ZnO-In(OH)
3
10 at. % In(III)
ZnO
ZnO-In(OH)
3
1 at. % In(III)
ZnO-In(OH)
3
5 at. % In(III)
ZnO
1 at. % In(III)
5 at. % In(III)
10 at. % In(III)
350 400 450 500 550 600 650 700 750 800 850
370 420 470
Fig. 8a. PL emission spectra of prism-like ZnO and ZnOAIn(OH)3 nanocomposites(k
g
= 350 nm).
106 E. Pál et al. /Journal of Colloid and Interface Science 378 (2012) 100–109
emission bands of In(OH)
3
are absent in the spectrum of the nano-
composite samples at 5 and 10 at.% In(III), meaning that the con-
centration of oxygen vacancies in the ZnO rises, but lowers in the
In(OH)
3
. The ZnO raspberries also represent a weak UV emission
at 384 nm and a broad intensive visible emission at 585 nm, whose
intensity significantly rises upon nanocomposite formation due to
the increasing concentration of oxygen vacancies in the ZnO
(Fig. 8b). The new blue bands at 412 nm and at 440 nm also appear
in the spectrum of the nanocomposite samples, but their intensity
diminishes with the indium ion concentration owing to the con-
centration decrease of oxygen vacancies in In(OH)
3
.
In Figs. 9a and 9b, the photoelectric property of prism-like and
raspberry-like ZnO and nanocomposite can be seen. The detected
current intensity of both series during UV irradiation found to be
decreased with the indium ion concentration. In case of the nano-
composite samples at highest indium ion content, no current
intensity could be measured. This phenomenon can be explained
by the presence of visible PL emission originated from the electron
trapping by surface states, which becomes more intensive at high-
er indium ion concentration (Figs. 8a and 8b) resulting in diminish-
ing photocurrent intensity. It is worth to mention that the current
intensity of raspberry-like samples measured upon their UV irradi-
ation is one order of magnitude smaller than that of the members
of prism-like series due to their more intensive visible emission.
3.3. Humidity sensing property of nanocomposites
The humidity sensing of ZnO and ZnO nanocomposite samples
were determined using QCM sensor crystals. From the frequency
decrease at different relative humidity, the adsorbed mass of water
vapor was calculated. Fig. 10a represents the mass changes in the
prism-like ZnO and ZnOAIn(OH)
3
nanocomposite samples as a
function of relative humidity, which shows almost saturation char-
acteristic. It can also be seen that the adsorption capacity of nano-
composite samples becomes more significant at higher indium ion
concentrations. That can be explained by the presence of more
In(OH)
3
nanoparticles that can promote the adsorption process of
water molecules through their larger specific surface area. In the
course of the adsorption process, the resistivity of the ZnO and
nanocomposite covered QCM crystals lowers due to the formation
of one or several water layers, which accelerate the transfer of H
+
or H
3
O
+
[55].
As Fig. 10b illustrates, the response of the prism-like samples
determined from the resistivity change heightens with the relative
0
2
4
6
8
10
12
RH (%)
Δ
m (
μ
g/cm
2
)
prism-like ZnO
ZnO-In(OH)
3
5 at. % In(III)
ZnO-In(OH)
3
10 at. % In(III)
ZnO-In(OH)
3
1 at. % In(III)
020406080100
Fig. 10a. Adsorbed mass of water vapor of prism-like ZnO and ZnOAIn(OH)
3
nanocomposites.
0
10
20
30
40
50
60
020406080100
RH (%)
R (%)
prism-like ZnO
ZnO-In(OH)
3
5 at. % In(III)
ZnO-In(OH)
3
10 at. % In(III)
ZnO-In(OH)
3
1 at. % In(III)
Fig. 10b. Response (b) of prism-like ZnO and ZnOAIn(OH)
3
nanocomposites to
relative humidity.
0
5
10
15
20
t (a.u.)
I (
μ
A/cm
2
)
raspberry-like ZnO
ZnO-In(OH)
3
1 at.% In(III)
ZnO-In(OH)
3
10 at.% In(III)
ZnO-In(OH)
3
5 at.% In(III)
ffoVUnoVU
Fig. 9b. Photoelectric properties of raspberry-like (b) ZnO and ZnOAIn(OH)
3
nanocomposites.
0
10
20
30
40
50
60
70
80
90
100
t (a.u.)
I (
μ
A/cm
2
)
prism-like ZnO
ZnO-In(OH)
3
1 at.% In(III)
ZnO-In(OH)
3
10 at.% In(III)
ZnO-In(OH)
3
5 at.% In(III)
UV on
UV off
Fig. 9a. Photoelectric properties of prism-like ZnO and ZnOAIn(OH)
3
nanocomposites.
E. Pál et al. /Journal of Colloid and Interface Science 378 (2012) 100–109
107
humidity, meaning that the presence of In(OH)
3
improve the
humidity sensing of ZnO prisms.
In case of raspberry-like series, the water vapor adsorption
shows saturation characteristic; however, the adsorbed mass
found to be decreased with the indium ion concentration
(Fig. 11a). The response of individual nanocomposite samples to
the relative humidity also increases, but it is lower than that of
the ZnO raspberries (Fig. 11b).
The differing water vapor adsorption behavior of prism- and
raspberry-like nanocomposite series can be explained by their dis-
similar morphology. The raspberry-like ZnO grains have more sur-
face sites (surface defects, steps, edges, terraces, etc.) favorable for
adsorption and higher specific surface area that make their adsorp-
tion capacity approximately four times higher than that of ZnO
prisms. The presence of In(OH)
3
nanoparticles raises the specific
surface area of nanocomposite samples, but the In(OH)
3
particles
can partially occupy the active surface sites of ZnO grains hereby
easing the adsorption capacity and worsening the humidity sens-
ing of ZnO raspberries.
4. Conclusion
Hydrothermal method was used for the preparation of ZnO
nanoparticles and ZnOAIn(OH)
3
nanocomposites. The structural
and microscopic investigations showed that prism- and rasp-
berry-like ZnO nanoparticles with hexagonal crystal structure
were generated by changing the addition rate of hydrolyzing agent,
and in the nanocomposite samples, pill-like In(OH)
3
nanoparticle
aggregates with body-centered cubic crystalline structures were
formed on the surface of the ZnO particles. PL studies demon-
strated that the visible intensity of ZnO significantly increased; fur-
thermore two new blue bands appeared in the emission spectra
due to the nanocomposite formation. Humidity sensing tests of
ZnO and ZnOAIn(OH)
3
nanocomposites revealed that the water va-
por adsorption of samples strongly depends on the morphology of
ZnO and on the concentration of In(OH)
3
.
Acknowledgments
This work was supported by the State and University of Bremen
in the framework of the Integrated Solutions in Sensorial Structure
Engineering (ISIS), Fund No. 54 416 915.
References
[1] X. Zhou, J. Zhang, T. Jiang, X. Wang, Z. Zhu, Sens. Actuators A 135 (2007) 209.
[2] L. Zhang, J. Zhao, H. Lu, L. Gong, L. Li, J. Zheng, H.Li.Z. Zhu, Sens. Actuators A 160
(2011) 364.
[3] L. Gu, K. Zheng, Y. Zhou, J. Li, X. Mo, G.R. Patzke, G. Chen, Sens. Actuators B 159
(2011) 1.
[4] W.G. Xu, S.F. Liu, S.X. Lu, S.Y. Kang, Y. Zhou, H.F. Zhang, J. Colloid Interface Sci.
351 (2010) 210.
[5] Q. Wu, X. Chen, P. Zhang, Y. Han, X. Chen, Y. Yan, S. Li, Cryst. Growth Des. 8
(2008) 3010.
[6] A. Umar, M.S. Chauhan, S. Chauhan, R. Kumar, G. Kumar, S.A. Al-Sayari, S.W.
Hwang, A. Al-Hajry, J. Colloid Interface Sci. 363 (2011) 521.
[7] Y.B. Kim, H. Jeong, D.J. Jang, J. Nanopart. Res. 13 (2011) 669.
[8] T.M. Hammad, J.K. Salem, J. Nanopart. Res. 13 (2011) 2205.
[9] Y. Yang, H. Lai, H. Xu, C. Tao, H. Yang, J. Nanopart. Res. 12 (2010) 217.
[10] M. Krunks, A. Katerski, T. Dedova, I.O. Acik, A. Mere, Sol. Energy Mater. Sol.
Cells 92 (2008) 1016.
[11] L.W. Ji, W.S Shih, T.H. Fang, C.Z. Wu, S.M. Peng, T.H. Meen, J. Mater. Sci. 45
(2010) 3266.
[12] J. Hahm, in: C.D. Geddes (Ed.), Metal-enhanced fluorescence, Wiley, New York,
2010, p. 363.
[13] H.C. Ong, D.Y. Lei, J. Li, J.B. Xu, in: C.D. Geddes (Ed.), Metal-enhanced
fluorescence, Wiley, New York, 2010, p. 393.
[14] E. Pál, T. Seemann, V. Zöllmer, M. Busse, I. Dékány, Colloid Polym. Sci. 287
(2009) 481.
[15] N. Bouhssira, S. Abed, E. Tomasella, J. Cellier, A. Mosbah, M.S. Aida, M. Jacquet,
Appl. Surf. Sci. 252 (2006) 5594.
[16] A. Chrissanthopoulos, S. Baskoutas, N. Bouropoulos, V. Dracopoulos, D. Tasis,
S.N. Yannopoulos, Thin Solid Films 515 (2007) 8524.
[17] F.S.S. Chien, C.R. Wang, Y.L. Chan, H.L. Lin, M.H. Chen, R.J. Wu, Sens. Actuators B
144 (2010) 120.
[18] S.H. Yi, S.K. Choi, J.M. Jang, J.A. Kim, W.G. Jung, J. Colloid Interface Sci. 313
(2007) 705.
[19] E. Bacaksiz, S. Aksu, S. Yilmaz, M. Parlak, M. Altunbas, This Solid Films 518
(2010) 4076.
[20] F. Zahedi, R.S. Dariani, This Solid Films 520 (2012) 2132.
[21] L. Spanhel, M.A. Anderson, J. Am. Chem. Soc. 113 (1991) 2826.
[22] L. Naszályi, A. Deák, E. Hild, A. Ayral, A.L. Kovács, Z. Hórvölgyi, Thin Solid Films
515 (2006) 2587.
[23] M. Jitianu, D.V. Goia, J. Collid Interface Sci. 309 (2007) 78.
[24] G. Rodríguez-Gattorno, P. Santiago-Jacinto, L. Rendon-Vázquez, J. Németh, I.
Dékány, D. Díaz, J. Phys. Chem. B 107 (2003) 12597.
[25] J. Németh, G. Rodríguez-Gattorno, D. Díaz, A.R. Vázquez-Olmos, I. Dékány,
Langmuir 20 (2004) 2855.
[26] E. Hammarberg, A. Prodi-Schwab, C. Feldmann, J. Colloid Interface Sci. 334
(2009) 29.
[27] Q. Xiao, Powder Technol. 189 (2009) 103.
[28] E. Pál, V. Hornok, A. Oszkó, I. Dékány, Colloids Surf. A: Physicochem. Eng.
Aspects 340 (2009) 1.
0
2
4
6
8
10
12
RH (%)
Δ
m (
μ
g/cm
2
)
raspberry-like ZnO
ZnO-In(OH)
3
5 at. % In(III)
ZnO-In(OH)
3
10 at. % In(III)
ZnO-In(OH)
3
1 at. % In(III)
020406080100
Fig. 11a. Adsorbed mass of water vapor of raspberry-like ZnO and ZnOAIn(OH)
3
nanocomposites.
0
10
20
30
40
50
60
020406080100
RH (%)
R (%)
raspberry-like ZnO
ZnO-In(OH)
3
5 at. % In(III)
ZnO-In(OH)
3
10 at. % In(III)
ZnO-In(OH)
3
1 at. % In(III)
Fig. 11b. Response of raspberry-like ZnO and ZnOAIn(OH)
3
nanocomposites to
relative humidity.
108 E. Pál et al. /Journal of Colloid and Interface Science 378 (2012) 100–109
[29] Z. Wang, B. Huang, X. Liu, X. Qin, X. Zhang, J. Wei, P. Wang, S. Yao, Q. Zhang, X.
Jing, Mater. Lett. 62 (2008) 2637.
[30] S.A.M. Zobir, Z. Zainal, M.Z. Hussein, Mater. Chem. Phys. 124 (2010) 477.
[31] J. Yu, C. Li, S. Liu, J. Colloid Interface Sci. 326 (2008) 433.
[32] J. Liang, J. Liu, Q. Xie, S. Bai, W. Yu, Y. Qian, J. Phys. Chem. B 109 (2005) 9463.
[33] H. Zhang, D. Yang, Y. Ji, X. Ma, J. Xu, D. Que, J. Phys. Chem. B 108 (2004) 3955.
[34] A. Chittofrati, E. Matijevic, Colloids Surf. 48 (1990) 65.
[35] M.T.Z. Myint, R. Kitsomboonloha, S. Baruah, J. Dutta, J. Colloid Interface Sci. 354
(2011) 810.
[36] Z. Wang, X. Qian, J. Yin, Z. Zhu, J. Solid State Chem. 177 (2004) 2144.
[37] U. Pal, P. Santiago, J Phys. Chem. B 109 (2005) 15317.
[38] G. Shan, M. Zhong, S. Wang, Y. Li, Y. Liu, J. Colloid Interface Sci. 326 (2008) 392.
[39] L. Sun, D. Zhao, Z. Song, C. Shan, Z. Zhang, B. Li, D. Shen, J. Colloid Interface Sci.
363 (2011) 175.
[40] S. Panigrahi, D. Basak, J. Colloid Interface Sci. 364 (2011) 10.
[41] Y. Li, M.J. Yang, Y. She, Talanta 62 (2004) 707.
[42] Z. Shi, W. Wang, Z. Zhang, Mater. Lett. 62 (2008) 4293.
[43] T. Ishida, K. Kuwabara, J. Ceram. Soc. Jpn. 106 (1998) 381.
[44] X.H. Zhang, S.Y. Xie, Z.M. Ni, X. Zhang, Z.Y. Jiang, Z.X. Xie, R.B. Huang, L.S.
Zheng, Inrog. Chem. Commun. 6 (2003) 1445.
[45] L. Wang, L.A. Pérez-Maqueda, E. Matijevic, Colloid Polym. Sci. 276 (1998) 847.
[46] S.G. Chen, Y.F. Huang, Y. Chen, Q. Xia, H.W. Liao, C.G. Long, Mater. Lett. 62
(2008) 1634.
[47] H. Zhu, Y. Wang, N. Wang, Y. Li, J. Yang, Mater. Lett. 58 (2004) 2634.
[48] F.V. Motta, R.C. Lima, A.P.A. Marquesm, M.S. Li, E.R. Leite, J.A. Varela, E. Longo, J.
Alloys Compd. 497 (2010) L25.
[49] A. Ortíz, M. García, C. Falcony, Thin Solid Films 207 (1992) 175.
[50] C. Donley, D. Dunphy, D. Paine, C. Catrer, K. Nebesny, P. Lee, D. Alloway, N.R.
Armstrong, Langmuir 18 (2002) 450.
[51] Z. Wang, X. Qian, J. Yin, Z. Zhu, J. Solid State. Chem. 177 (2004) 2144.
[52] A. Dijken, E.A. Meulenkamp, D. Vanmeakelbergh, A. Meijerink, J. Phys. Chem. B
104 (2000) 1715.
[53] A. Dijken, E.A. Meulenkamp, D. Vanmeakelbergh, A. Meijerink, J. Lumin. 87–89
(2000) 454.
[54] C. Li, S. Lian, Y. Liu, S. Liu, Z. Kang, Mater. Res. Bull. 45 (2010) 109.
[55] W. Wang, Z. Li, L. Liu, H. Zhang, W. Zheng, Y. Wang, H. Huang, Z. Wang, C.
Wang, Sens. Actuators B 141 (2009) 404.
E. Pál et al. /Journal of Colloid and Interface Science 378 (2012) 100–109
109