Nghiên cứu thị trường video streaming marketing ở vietnam
Bạn đang xem bản rút gọn của tài liệu. Xem và tải ngay bản đầy đủ của tài liệu tại đây (858.09 KB, 13 trang )
Vietnam video streaming market study
Asia Plus Inc.
Q&Me is online market research provided by Asia Plus Inc.
Overview
Video streaming service is popular in Vietnam market with many
suppliers like FPT Play, Zing TV, WeTV, Netflix, … With the
current speed of internet development in Vietnam, people can
access these types of services easily.
Therefore, we conducted a survey to understand consumer’s
behavior and habits about video streaming service. This survey
was conducted among 20-49 years old of 617 samples in 2020
February (those who recognize video streaming is 202).
Recognition rate:
31%
aware of
“the video
streaming service”
N=617
To t a l s a m p l e s i z e
Marital status
n=202
43% Single
2% Married without children
City
53% Married with children
1% Divorced/ Separated/
Widow
Hanoi
(47%)
20 – 35 y.o
Other cities
(9%)
86%
HCMC
(44%)
Below 7,500,000 VND/month
7,500,000 – 14,999,999 VND/ month
15,000,000 - 29,999,999 VND/ month
30,000,000 VND/month and above
36 – 49 y.o
Female
Male
14%
58%
42%
Z
Age
4%
Gender
O C C U PAT I O N
46%
19%
24%
46%
32%
9%
Skilled
white
Professional
University
student
7%
Self-employed/
Business owner
5%
5%
Unskilled
Blue
Household income
3
2%
Unskilled
Skilled Blue
white
1%
Managerial/top
management
Top 5 Popular video streaming subscription service
(Vietnam)
FPT Telecom JSC
()
(USA)
Netflix Inc.
( />
Usage
(Vietnam)
Vienam Television
Cable Corporation
( />
Usage
Usage
VNG Corporation
()
Usage
Usage
18%
19%
21%
23%
39%
(Vietnam)
(Vietnam)
Vietnam Satellite Digital
Television Kplus Co., Ltd
()
`
1st in market
3rd in market
2nd in market
5th in
4th in
market
market
Favorite program
Favorite program
68%
TV series/ Feature film
Favorite program
62%
65%
72%
TV series/ Feature film
Entertainment program/
Game show/ Reality show
Entertainment program/
Game show/ Reality show
65%
56% Music
62% Sports
48% Sports
Entertainment program/
Game show/ Reality show
62% Sports
TV series/ Feature film
57%
Favorite program
Favorite program
68%
Entertainment program/
Game show/ Reality show
65%
TV series/ Feature film
51%
58% Sports
TV series/ Feature film
54% Sports
4
Top 5 Popular video streaming subscription service
Service
Package payment
1 month
2 month
VIP
100,000 VND
VND
100,000
200,000 VND
200,000
VND
3 month
6 months
12 months
600,000 VND
600,000
VND
1,200,000 VND
1,200,000
VND
Basic
180,000 VND
Standard
220,000 VND
Premium
260,000 VND
Premium
145,000 VND
435,000 VND
870,000 VND
1,500,000 VND
TV Box
145,000 VND
435,000 VND
870,000 VND
1,500,000 VND
MyK+ Now
(Only for Laptop, Tablet,
Smartphone)
125,000 VND
ON VIP
66,000VND
VND
66,000
198,000
VND
198,000 VND
396,000
VND
396,000 VND
792,000
VND
792,000 VND
(Bonus +1
(Bonus
+1month)
month)
(Bonus +2
(Bonus
+2months)
month)
(Bonus +4
(Bonus
+4 months)
month)
ON GĐ
88,000
88,000VND
VND
264,000
VND
264,000 VND
528,000
VND
528,000 VND
1,056,000
1,056,000 VND
VND
(Bonus +1
(Bonus
+1month)
month)
(Bonus
(Bonus+2
+2months)
month)
(Bonus +4
+4 month)
months)
(Bonus
VIP
99,000
99,000VND
VND
599,000
VND
599,000 VND
999,000
999,000 VND
VND
5
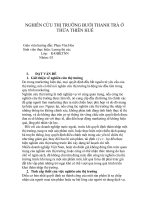
Brand funnel of video streaming service
Youtube gets the highest traffic due to free access for all programs. Among the subscription services (paid service), FPT Play gains the highest
share thanks to its diversify of programs and contents which more relevant with Vietnamese consumers. Following after is Netflix which is well
known for movie series and family sharing package.
86%
72%
70%
39%
21%
22%
52%
19%
21%
16%
51%
18%
9%
2%
Awareness
Access
Intend to purchase
50%
21%
13%
10%
49%
23%
26%
9%
38%
10%
11%
6%
37%
14%
8%
8%
Currently pay
Video streaming watch habit
Smartphone (76%) & Smart TV (73%) are used the most when watching video streaming.
Majority consumers watch video streaming around 2 hours in average (42%)
Device to use most often
76%
2nd
1st
Smartphone
4th
3rd
73%
Smart TV
Devices
to watch
video
stream
53%
42%
41%
7%
3%
3%
3%
Laptop
28%
Average hour to watch video stream
PC
21%
Tablet
20%
Supporting Device
7%
23%
30 mins
42%
1 hour
2 hours
17%
3 hours
10%
4 hours
7
FAVORITE CONTENT/TOPIC
60%
TV series/ Feature film
50%
Music
Entertainment program/ Game show/
Reality show
48%
45%
Sports
Comedy
37%
News/ Weather forecast
31%
Cartoon/ Children’s shows
30%
Food/ Cuisine/ Cooking
Travel
Electronics/ appliance/ technology
Beauty
28%
More than half of consumers are attracted
to video streaming service by TV series/
Feature film (60%), Music (50%), and
Entertainment program/ Game show/
Reality show (48%).
25%
24%
20%
Wide life/ animal discover
19%
Documentary film
16%
8
A13. Which content/topics of video streaming do you usually watch?
SOURCE
TV ad/ TV programs/Introduction on TV and Social Media are found
as most common channels to interact with. Offline channels are
leaving short of, which seen promising channels for service providers
to increase its awareness.
TV ad/ TV programs/ Introduction on TV
OF
Awareness
Social Media (Facebook, Instagram, Zalo, …)
Search engine such as Google
Recommendations from relatives, friends,
colleagues, neighbours
68%
56%
Newspaper/ Magazines ad/ Articles
Banner ads when surfing the internet
Radio ad/ Radio programs/ Introduction on radio
Banner on the bus, taxi, bus station
Ads on LCD at buildings, elevator, cinema
Ads when watching movie/ music/ video
Official website of the video streaming service
Billboard
Online reviews in Public forums
Mobile SMS
A12. Which source of information that you heard, noticed or come across
information about the video streaming service in general?
Ads in game
42%
38%
30%
27%
22%
18%18%18%
15%
13%
13%
9%
8%
9
Video streaming watch habit
Majority consumers watch video at their home (97%) with their partner (husband/wife) 45%. Thus, promotions &
communication related to family or group sharing could help attracting more users.
Place to watch
Whom to watch with
Place to watch
Place to watch most often
99% 97%
6%
4%
4%
Other family
members
Friends
Kids
Parents
Only me
Husband/wife
6%
Boyfriend/
Girlfriend
12%
0%
On the way
1%
Working office/
school
Restaurants/
Coffee shop
17%
4%
Colleagues
37%
18%
1%
Home
39%
Siblings
19%
42%
Grandparents
45%
10
Subscribing for streaming service
Majority of people (84%) are interesting in signing up a new video streaming service. However, they are not willing
to use multiple services at same time. Saying that, 41% will buy new service only when cutting off the current
subscription.
1% I am not interested in streaming services
I am not interested in signing
up for new steaming services
15%
43%
41%
I would sign up for a new
streaming service in addition
to my current ones
I would only sign up for a new
streaming service if I cancelled an
existing subscription
11
Regarding to spend less money, consumers are willing
to accept advertisement during watching (54%) and not
able to download (43%)
Having favorite shows/movies seen the most motivator for
audience to sign of for new service. Exclusive content is
found as unique selling point to attract users.
ACCEPTABLE LIMITATION
TRIGGER TO SIGN UP
TO PAY LESS
TO A NEW SERVICE
Advertisements
54%
Not being able to download content
43%
21%
A limit on the number of hours I could watch a month
A reduced selection of content
Only being able to watch content on my mobile / cell
phone
18%
Access to your favorite shows/movies
63%
Exclusive content featuring my favorite
celebrities
42%
Original content that isn’t available anywhere
else
40%
Access to old series /programs that you can’t
access elsewhere (e.g. Friends)
34%
31%
Ability to watch live events
12%
Not being able to watch content on my mobile/cell
phone
7%
None of the above
6%
A16. What would you be willing to accept from streaming service if it meant you
were able to pay less for the subscription?
Access to a particular type of genre of
show/movie
28%
Non-media related perk e.g vouchers
28%
I would not sign up to a new streaming service
9%
A15. Which of the following would encourage you to sign up new streaming
service?
12
STUDY ABOUT
VIDEO STREAMING
SUBSCRIPTION
SERVICE
MAR 2020
For more information please contact:
Asia Plus Inc. & Kadence
International
t +84 2839 100 043
w www.qandme.net or
w www.kadence.com