Tin học trong CNTP
Bạn đang xem bản rút gọn của tài liệu. Xem và tải ngay bản đầy đủ của tài liệu tại đây (208.47 KB, 8 trang )
1
TIN HỌC TRONG CNTP
Nguy
Nguy
ễ
ễ
n
n
Ho
Ho
à
à
ng
ng
D
D
ũ
ũ
ng
ng
,
,
PhD.
PhD.
Trư
Trư
ờ
ờ
ng
ng
Đ
Đ
ạ
ạ
i
i
h
h
ọ
ọ
c
c
B
B
á
á
ch
ch
khoa
khoa
Tp
Tp
. HCM
. HCM
NHDzung–Lesson 1, slide 2
PHÂN BỐ -DISTRIBUTIONS
Phân
Phân
b
b
ố
ố
chu
chu
ẩ
ẩ
n
n
–
–
Normal distribution
Normal distribution
0
10
20
30
40
50
60
70
JailPrisonProbationParole
Percentage
Jail
9%
Prison
19%
Probation
61%
Parole
11%
NHDzung–Lesson 1, slide 3
PHÂN BỐ -DISTRIBUTIONS
Phân
Phân
b
b
ố
ố
chu
chu
ẩ
ẩ
n
n
–
–
Normal distribution
Normal distribution
0
5
10
15
20
25
30
1018263442505866748290
Behaviour problem score
Frequency
N=289
Mean=50
Std=10
NHDzung–Lesson 1, slide 4
PHÂN BỐ -DISTRIBUTIONS
Phân
Phân
b
b
ố
ố
chu
chu
ẩ
ẩ
n
n
–
–
Normal distribution
Normal distribution
0
5
10
15
20
25
30
1018263442505866748290
Frequency
Behaviour problem score
NHDzung–Lesson 1, slide 5
PHÂN BỐ -DISTRIBUTIONS
Phân
Phân
b
b
ố
ố
chu
chu
ẩ
ẩ
n
n
–
–
Normal distribution
Normal distribution
4 3 2 1 0 1 2 3 4
0
0.1
0.2
0.3
0.4
f(x) (density)
.40
0
1e
X0
2
2
.
12π
44 X
()
2
2
2
2
1
)(
σ
µ
πσ
−
−
=
X
exf
NHDzung–Lesson 1, slide 6
PHÂN BỐ -DISTRIBUTION
Standard Normal Distribution
Standard Normal Distribution
0
0.1
0.2
0.3
0.4
f(x) (density)
.40
0
1e
X0
2
2
.
12π
44 X
3
3
2
2
1
1
0
0
-
-
1
1
-
-
2
2
-
-
3
3
30
30
20
20
10
10
0
0
-
-
10
10
-
-
20
20
-
-
30
30
80
80
70
70
60
60
50
50
40
40
30
30
20
20
Ζ
Ζ
:
:
X
X
-
-
µ:
µ:
X:
X:
N(µ,σ
2
)
N(0,1)
σ
µ−
=
X
z
N(50,100)
N(0,1)
10
50−
=
X
z
2
NHDzung–Lesson 1, slide 7
Implications of the mean and SD
“
“
In the Vietnamese population aged 30+ years, the average of
In the Vietnamese population aged 30+ years, the average of
weight was 55.0 kg, with the SD being 8.2 kg
weight was 55.0 kg, with the SD being 8.2 kg
.
.
”
”
What does this mean?
What does this mean?
If the data are
If the data are
normally
normally
distributed, this means that the
distributed, this means that the
probability that
probability that
an individual randomly selected from the population
an individual randomly selected from the population
with weight being w kg is
with weight being w kg is
:
:
()
()
−−
==
2
2
2
exp
2
1
s
xw
s
wWeightP
π
NHDzung–Lesson 1, slide 8
Implications of the mean and SD
In our example,
In our example,
x
x
= 55,
= 55,
s
s
= 8.2
= 8.2
The probability that
The probability that
an individual randomly selected from the population
an individual randomly selected from the population
with weight being 40 kg is
with weight being 40 kg is
:
:
()
()
009.0
2.82.82
5540
exp
1416.322.8
1
40
2
=
××
−−
××
==WeightP
()
()
040.0
2.82.82
5550
exp
1416.322.8
1
50
2
=
××
−−
××
==WeightP
()
()
0004.0
2.82.82
5580
exp
1416.322.8
1
80
2
=
××
−−
××
==WeightP
NHDzung–Lesson 1, slide 9
Implications of the mean and SD
The distribution of weight of the entire population can be
The distribution of weight of the entire population can be
shown to be:
shown to be:
0
1
2
3
4
5
6
222528313437404346495255586164677073767982858892
Weight (kg)
Percent (%)
NHDzung–Lesson 1, slide 10
Z-scores
Actual measurements can be converted to z
Actual measurements can be converted to z
-
-
scores
scores
A z
A z
-
-
score is the
score is the
number of
number of
SDs
SDs
from the mean
from the mean
s
xx
Z
−
=
A weight = 55 kg
A weight = 55 kg
à
à
z=(55
z=(55
-
-
55)/8.2 = 0
55)/8.2 = 0
SDs
SDs
A weight = 40 kg
A weight = 40 kg
à
à
z=(40
z=(40
-
-
55)/8.2 =
55)/8.2 =
-
-
1.8
1.8
SDs
SDs
A weight = 80 kg
A weight = 80 kg
à
à
z=(80
z=(80
-
-
55)/8.2 = 3.0
55)/8.2 = 3.0
SDs
SDs
NHDzung–Lesson 1, slide 11
Z-scores = Standard Normal Distribution
A z
A z
-
-
score is
score is
unitless
unitless
, allowing comparison between variables
, allowing comparison between variables
with different measurements
with different measurements
Z
Z
-
-
scores have mean 0 and variance of 1.
scores have mean 0 and variance of 1.
Z
Z
-
-
scores
scores
à
à
Standard Normal Distribution
Standard Normal Distribution
NHDzung–Lesson 1, slide 12
Z-scores and area under the curve
Z
Z
-
-
scores and weight
scores and weight
–
–
another look:
another look:
0
1
2
3
4
5
6
-4.0-3.5-3.0-2.6-2.1-1.6-1.1-0.6-0.10.40.91.31.82.32.83.33.84.3
Percent (%)
Area under the curve for z
Area under the curve for z
<
<
-
-
1.96 = 0.025
1.96 = 0.025
Area under the curve for
Area under the curve for
-
-
1.0
1.0
<
<
z
z
<
<
1.0 = 0.6828
1.0 = 0.6828
Area under the curve for
Area under the curve for
-
-
2.0
2.0
<
<
z
z
<
<
2.0 = 0.9544
2.0 = 0.9544
Area under the curve for
Area under the curve for
-
-
3.0
3.0
<
<
z
z
<
<
3.0 = 0.9972
3.0 = 0.9972
3
NHDzung–Lesson 1, slide 13
95% confidence interval
A sample of
A sample of
n
n
measurements (
measurements (
x
x
1
1
, x
, x
2
2
,
,
…
…
,
,
x
x
n
n
), with mean
), with mean
x
x
and standard deviation
and standard deviation
s
s
.
.
95% of the individual values of
95% of the individual values of
x
x
i
i
lies between
lies between
x
x
-
-
1.96s
1.96s
and
and
x+1.96s
x+1.96s
Mean weight = 55 kg, SD = 8.2 kg
Mean weight = 55 kg, SD = 8.2 kg
95% of individuals
95% of individuals
’
’
weight lies between 39 kg and 71 kg.
weight lies between 39 kg and 71 kg.
NHDzung–Lesson 1, slide 14
Cumulative probability (area under the curve) for
Z-scores
0
0.1
0.2
0.3
0.4
0.5
0.6
0.7
0.8
0.9
1
-4.0-3.5-3.0-2.5-2.0-1.5-1.0-0.50.00.51.01.52.02.53.03.54.0
Z-scores
Percent (%)
.8413
.8413
1.0
1.0
.6915
.6915
0.5
0.5
.5000
.5000
0
0
.3085
.3085
-
-
0.5
0.5
.9987
.9987
.9938
.9938
.9772
.9772
.9332
.9332
.1587
.1587
.0668
.0668
.0227
.0227
.006
.006
.0013
.0013
Prob
Prob
3.0
3.0
2.5
2.5
2.0
2.0
1.5
1.5
-
-
1.0
1.0
-
-
1.5
1.5
-
-
2.0
2.0
-
-
2.5
2.5
-
-
3
3
Z
Z
<
<
NHDzung–Lesson 1, slide 15
PHÂN BỐ -DISTRIBUTION
Standard Normal Distribution
Standard Normal Distribution
–
–
Using Table
Using Table
……
……
……
……
……
……
……
……
……
……
……
……
……
……
……
……
……
……
……
……
……
……
……
……
……
……
……
……
……
……
……
……
0.0080
0.0080
0.9920
0.9920
0.4920
0.4920
2.41
2.41
0.0250
0.0250
0.9750
0.9750
04750
04750
1.96
1.96
0.0721
0.0721
0.9279
0.9279
0.4279
0.4279
1.46
1.46
0.1562
0.1562
0.8438
0.8438
0.3438
0.3438
1.01
1.01
0.0735
0.0735
0.9265
0.9265
0.4265
0.4265
1.45
1.45
0.1587
0.1587
0.8413
0.8413
0.3413
0.3413
1.00
1.00
0.0749
0.0749
0.9251
0.9251
0.4251
0.4251
1.44
1.44
0.1611
0.1611
0.8389
0.8389
0.3389
0.3389
0.99
0.99
……
……
……
……
……
……
……
……
……
……
……
……
……
……
……
……
0.3156
0.3156
0.6844
0.6844
0.1844
0.1844
0.48
0.48
0.4880
0.4880
0.5120
0.5120
0.0120
0.0120
0.03
0.03
0.3192
0.3192
0.6808
0.6808
0.1808
0.1808
0.47
0.47
0.4920
0.4920
0.5080
0.5080
0.0080
0.0080
0.02
0.02
0.3228
0.3228
0.6772
0.6772
0.1772
0.1772
0.46
0.46
0.4960
0.4960
0.5040
0.5040
0.0040
0.0040
0.01
0.01
0.3264
0.3264
0.6636
0.6636
0.1736
0.1736
0.45
0.45
0.5000
0.5000
0.5000
0.5000
0.0000
0.0000
0.00
0.00
Smaller
Smaller
Portion
Portion
Larger
Larger
Portion
Portion
Mean
Mean
to Z
to Z
Z
Z
Smaller
Smaller
Portion
Portion
Larger
Larger
Portion
Portion
Mean
Mean
to Z
to Z
Z
Z
NHDzung–Lesson 1, slide 16
0
0.1
0.2
0.3
0.4
f(x) (density)
.40
0
1e
X0
2
2
.
12π
44 X
0.1587
PHÂN BỐ -DISTRIBUTION
Standard Normal Distribution
Standard Normal Distribution
–
–
Using Table
Using Table
0.3413
0.5000
0.8413
NHDzung–Lesson 1, slide 17
PHÂN BỐ -DISTRIBUTION
Standard Normal Distribution
Standard Normal Distribution
–
–
Using Table
Using Table
0
0.1
0.2
0.3
0.4
f(x) (density)
.40
0
1e
X0
2
2
.
12π
44 X
-2 -1
NHDzung–Lesson 1, slide 18
0
0.1
0.2
0.3
0.4
f(x) (density)
.40
0
1e
X0
2
2
.
12π
44 X
PHÂN BỐ -DISTRIBUTION
Standard Normal Distribution
Standard Normal Distribution
–
–
Using Table
Using Table
95%
4
NHDzung–Lesson 1, slide 19
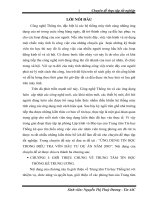
Sampling Distributions & Hypothesis Testing
Logic is typical of most test of hypothesis:
1. We want to test the hypothesis, often called the research hypothesis, that
students under stress are more likely than normal students to exhibit
threshold problems.
2. We obtained a random sample of students under stress.
3. We set up the hypothesis (called the null hypothesis, Ho) that the sample
was in fact drawn from a population whose mean, denoted µ
o
, equals 50.
This is the hypothesis that stressed students do not differ fromnormal
students in terms of threshold problems.
4. We then obtained the sampling distribution of the mean under the
assumption that Ho (the null hypothesis) is true (i.e., we obtained the
sampling distribution of the mean from a population with µo=50)
5. Given the sampling distribution, we calculated the probability of a mean at
least as large as our sample mean.
6. On the basis of that probability, we made a decision: to either reject or fail
to reject Ho. Because Ho states that µ =50, rejection of Ho represents a
belief that µ >50, although the actual value of µ remains unspecified.
NHDzung–Lesson 1, slide 20
Sampling Distributions & Hypothesis Testing
Null hypothesis
Null hypothesis
V
V
í
í
d
d
ụ
ụ
:
: cầnchứngtỏgiả thiếtnghiêncứu: “college students do not come from a
population with a mean self-confidence score of 100”
chúngta đặtngaygiả thiếtkhông: THEY DO !
Hoặccầnchứngtỏsựphùhợpcủagiả thiếtnghiêncứurằngcácgiátrị trungbìnhcủatập
hợptừđórútrahaimẫulàkhácnhau(µ
1
≠µ
2
). Chúngta đặtragiả thiếtkhôngrằng
haigiátrị như nhautứclà µ
1
-µ
2
=0
Vìsao:
1. Philosophical argument: “WE CAN NEVER PROVE SOMETHING TO BE TRUE, BUT WE
CAN PROVE SOMETHING TO BE FALSE”: 3000 two children
2. PROVIDE WITH THE STARTING POINT FOR ANY STATISTICAL TEST (101,102 vs100)
Statistical conclusions
Statistical conclusions
Sample statistic (mean, variance, std,
Sample statistic (mean, variance, std,
…
…
)
)
–
–
test statistics (
test statistics (
t
t
,
,
F
F
,
,
χ
χ
22
)
)
NHDzung–Lesson 1, slide 21
Sampling Distributions & Hypothesis Testing
Sai
Sai
l
l
ầ
ầ
m
m
lo
lo
ạ
ạ
i
i
I&II
I&II
One
One
-
-
and two tailed test
and two tailed test
40 60 80 100 120 140 160
0.01
0.02
0.025
0
.
1 e
.
1
2
X100
20
2
.
20
.
2 π
16040 X
3
3
2
2
1
1
0
0
-
-
1
1
-
-
2
2
-
-
3
3
Ζ
Ζ
:
:
X
X
-
-
µ:
µ:
H
1
β
Critical value
p
p
=
=
β
β
p
p
=1
=1
-
-
α
α
Type II error
Type II error
Correct
Correct
decision
decision
False to
False to
reject Ho
reject Ho
p
p
=1
=1
-
-
β
β
=Power
=Power
p
p
=
=
α
α
Correct
Correct
decision
decision
Type I
Type I
error
error
Reject Ho
Reject Ho
Ho False
Ho False
Ho True
Ho True
Decision
Decision
NHDzung–Lesson 1, slide 22
Binomial (Bernoulli) distribution
NHDzung–Lesson 1, slide 23
Binomial distribution –some facts
(x + y)
(x + y)
2
2
= x
= x
2
2
+ 2xy + y
+ 2xy + y
2
2
(x + y)
(x + y)
3
3
= x
= x
3
3
+ 3x
+ 3x
2
2
y + 3xy
y + 3xy
2
2
+ y
+ y
3
3
(x + y)
(x + y)
4
4
= x
= x
4
4
+ 4x
+ 4x
3
3
y + 6x
y + 6x
2
2
y
y
2
2
+ 4xy
+ 4xy
3
3
+ y
+ y
4
4
(x + y)
(x + y)
5
5
= x
= x
5
5
+ 5x
+ 5x
4
4
y + 10x
y + 10x
3
3
y
y
2
2
+ 10x
+ 10x
2
2
y
y
3
3
+ 5xy
+ 5xy
4
4
+y
+y
5
5
…
…
()
nnnn
n
yx
n
n
yx
n
yx
n
yx
n
yx
022110
...
010
++
+
+
=+
−−
()
knn
n
k
n
yx
k
n
yx
−
=
∑
=+
0
where
()
!!
!
knk
n
k
n
−
=
NHDzung–Lesson 1, slide 24
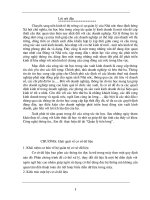
A typical experiment
Design: 10 consumers were asked to give scores of
Design: 10 consumers were asked to give scores of
flavour
flavour
to products A and B.
to products A and B.
Results: 8 preferred A, 2
Results: 8 preferred A, 2
proferred
proferred
B.
B.
Question: Is there evidence that more people preferred A
Question: Is there evidence that more people preferred A
than B?
than B?
5
NHDzung–Lesson 1, slide 25
A typical experiment -consideration
Let
Let
a
a
be the probability that consumers preferred A,
be the probability that consumers preferred A,
then
then
b
b
= 1
= 1
-
-
a
a
is the probability that consumers
is the probability that consumers
preferred B
preferred B
Under the null hypothesis of difference,
Under the null hypothesis of difference,
a = b = 0.5
a = b = 0.5
The possibilities are:
The possibilities are:
()
1002819010
10
10
10
...
2
10
1
10
0
10
bababababa
++
+
+
=+
P(10 prefA)P(9 prefA)P(8 prefA)P(0 prefA)
()
kk
ba
k
AprefkP
−
=
10
10
__
NHDzung–Lesson 1, slide 26
A typical experiment -solution
0.00977
0.00977
10a
10a
1
1
b
b
9
9
9
9
1
1
0.00098
0.00098
a
a
0
0
b
b
10
10
10
10
0
0
0.049395
0.049395
45a
45a
2
2
b
b
8
8
8
8
2
2
0.11719
0.11719
120a
120a
3
3
b
b
7
7
7
7
3
3
0.20508
0.20508
210a
210a
4
4
b
b
6
6
6
6
4
4
0.24609
0.24609
252a
252a
5
5
b
b
5
5
5
5
5
5
0.20508
0.20508
210a
210a
6
6
b
b
4
4
4
4
6
6
0.11719
0.11719
120a
120a
7
7
b
b
3
3
3
3
7
7
0.04395
0.04395
45a
45a
8
8
b
b
2
2
2
2
8
8
0.00977
0.00977
10a
10a
9
9
b
b
1
1
9
9
0.00098
0.00098
a
a
10
10
0
0
10
10
Probability
Probability
Under the null
Under the null
hypothesis
hypothesis
a
a
= 0.5,
= 0.5,
b
b
= 0.5
= 0.5
Number
Number
preferred
preferred
B
B
Number
Number
preferred A
preferred A
The result
suggested
that a =
0.80, a 19
times
difference
from the
null
hypothesis
of no
difference!
NHDzung–Lesson 1, slide 27
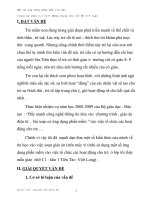
Binomial and Normal distributions
0.00
0.05
0.10
0.15
0.20
0.25
0.30
012345678910
# preferred A
Probability
Prob(8 or more preferred A) = 0.0494 + 0.0098 + 0.00098 = 0.060
NHDzung–Lesson 1, slide 28
Mean and variance of a proportion
For an individual
For an individual
i
i
consumer, the probability he/she
consumer, the probability he/she
prefers A is
prefers A is
p
p
i
i
. Assuming that all consumers are
. Assuming that all consumers are
independent, then
independent, then
p
p
i
i
=
=
p
p
.
.
Variance of
Variance of
p
p
i
i
is
is
var
var
(p
(p
i
i
)
)
=
=
p(1
p(1
-
-
p)
p)
For a
For a
sample of n consumers
sample of n consumers
, the estimated probability of
, the estimated probability of
preference for A is:
preference for A is:
n
pppp
p
n
++++
=
...
321
and the variance of
and the variance of
p_bar
p_bar
is:
is:
()
( )
n
pp
p
−
=
1
var
NHDzung–Lesson 1, slide 29
Normal approximation of a binomial
distribution
For
For
an individual
an individual
i
i
consumer
consumer
, the probability he/she
, the probability he/she
prefers A is
prefers A is
p
p
i
i
. Assuming that all consumers are
. Assuming that all consumers are
independent, then
independent, then
p
p
i
i
=
=
p
p
.
.
Variance of
Variance of
p
p
i
i
is
is
var
var
(p
(p
i
i
)
)
=
=
p(1
p(1
-
-
p)
p)
For a
For a
sample of n consumers
sample of n consumers
, the estimated probability of preference
, the estimated probability of preference
for A is:
for A is:
n
pppp
p
n
++++
=
...
321
and the variance of
and the variance of
p_bar
p_bar
is:
is:
()
( )
n
pp
p
−
=
1
var
and standard deviation:
and standard deviation:
( )
n
pp
s
−
=
1
NHDzung–Lesson 1, slide 30
Normal approximation of a binomial distribution -
example
10 consumers, 8 preferred product A.
10 consumers, 8 preferred product A.
Proportion of preference for A:
Proportion of preference for A:
p = 0.8
p = 0.8
Variance:
Variance:
var(p
var(p
)
)
=
=
0.8(0.2)/10 = 0.016
0.8(0.2)/10 = 0.016
Standard deviation of
Standard deviation of
p
p
:
:
s = 0.126
s = 0.126
95% CI of p: 0.8
95% CI of p: 0.8
+
+
1.96(0.126) = 0.55 to 1.00
1.96(0.126) = 0.55 to 1.00