Problem solving for tomorrows world
Bạn đang xem bản rút gọn của tài liệu. Xem và tải ngay bản đầy đủ của tài liệu tại đây (1.76 MB, 154 trang )
Programme for International Student Assessment
Problem Solving for
Tomorrow’s World
First Measures of Cross-Curricular
Competencies from PISA 2003
OECD
ORGANISATION FOR ECONOMIC CO-OPERATION AND DEVELOPMENT
ORGANISATION FOR ECONOMIC CO-OPERATION
AND DEVELOPMENT
Pursuant to Article 1 of the Convention signed in Paris on 14th December 1960, and which came into
force on 30th September 1961, the Organisation for Economic Co-operation and Development (OECD)
shall promote policies designed:
– to achieve the highest sustainable economic growth and employment and a rising standard of living in
member countries, while maintaining financial stability, and thus to contribute to the development
of the world economy;
– to contribute to sound economic expansion in member as well as non-member countries in the
process of economic development; and
– to contribute to the expansion of world trade on a multilateral, non-discriminatory basis in
accordance with international obligations.
The original member countries of the OECD are Austria, Belgium, Canada, Denmark, France,
Germany, Greece, Iceland, Ireland, Italy, Luxembourg, the Netherlands, Norway, Portugal, Spain,
Sweden, Switzerland, Turkey, the United Kingdom and the United States. The following countries became
members subsequently through accession at the dates indicated hereafter: Japan (28th April 1964), Finland
(28th January 1969), Australia (7th June 1971), New Zealand (29th May 1973), Mexico (18th May 1994),
the Czech Republic (21st December 1995), Hungary (7th May 1996), Poland (22nd November 1996),
Korea (12th December 1996) and the Slovak Republic (14th December 2000). The Commission of the
European Communities takes part in the work of the OECD (Article 13 of the OECD Convention).
Publié en franỗais sous le titre :
Rộsoudre des problốmes, un atout pour réussir –
Premières évaluations des compétences transdisciplinaires issues de PISA 2003
PISATM, OECD/PISATM and the PISA logo are trademarks of the Organisation for Economic Co-operation and
Development (OECD). All use of OECD trademarks is prohibited without written permission from the OECD.
© OECD 2004
Permission to reproduce a portion of this work for non-commercial purposes or classroom use should be obtained through the Centre franỗais
dexploitation du droit de copie (CFC), 20, rue des Grands-Augustins, 75006 Paris, France, tel. (33-1) 44 07 47 70, fax (33-1) 46 34 67 19, for every country
except the United States. In the United States permission should be obtained through the Copyright Clearance Center, Customer Service, (508)750-8400,
222 Rosewood Drive, Danvers, MA 01923 USA, or CCC Online: www.copyright.com. All other applications for permission to reproduce or translate all or part
of this book should be made to OECD Publications, 2, rue André-Pascal, 75775 Paris Cedex 16, France.
Foreword
Foreword
All stakeholders – parents, students, those who teach and run education systems
as well as the general public – need to be informed on how well their education
systems prepare students for life. Knowledge and skills in school subjects such
as languages, mathematics and science are an essential foundation for this but a
much wider range of competencies is needed for students to be well prepared
for the future. Problem-solving skills, i.e. the capacity of students to understand
problems situated in novel and cross-curricular settings, to identify relevant
information or constraints, to represent possible alternatives or solution paths,
to develop solution strategies, and to solve problems and communicate the
solutions, are an example of this wider range of competencies.
The 2003 assessment of the Organisation for Economic Co-operation and
Development’s (OECD) Programme for International Student Assessment (PISA)
included an assessment of students’ problem-solving skills, providing for the first
time a direct assessment of life competencies that apply across different areas of
the school curriculum.
About one in five 15-year-olds in OECD countries can be considered a reflective,
communicative problem solver.These students are able not only to analyse a situation
and make decisions, they are also capable of managing multiple conditions
simultaneously. They can think about the underlying relationships in a problem,
solve it systematically, check their work and communicate the results. In some
countries, more than a third of students reach this high level of problem-solving
competencies. In other countries, however, the majority of students cannot even
be classified as basic problem solvers, a level at which they are required to deal with
only a single data source containing discrete, well-defined information.
How can countries raise their performance in this increasingly important
competency area and what can countries with lower performance levels learn
from those where students do well? This report seeks to answer such questions.
It complements Learning for Tomorrow’sWorld – First Results from PISA 2003, which
focuses on knowledge and skills in mathematics, science and reading, and it goes
beyond an examination of the relative standing of countries in students’ problemsolving performance by considering how problem-solving performance relates
to learning outcomes in other areas and how it varies between the genders
and between socio-economic groups. It also provides insights into some of
the factors that are associated with the development of problem-solving skills
and into how these factors interact and what the implications are for policy
development. Most importantly, the report sheds light on countries that succeed
© OECD 2004 Problem Solving for Tomorrow’s World – First Measures of Cross-Curricular Competencies from PISA 2003
3
Foreword
in achieving high performance standards while at the same time providing an
equitable distribution of learning opportunities. Results in these countries pose
challenges for other countries by showing what it is possible to achieve.
The report is the product of a collaborative effort between the countries
participating in PISA, the experts and institutions working within the framework
of the PISA Consortium, and the OECD. The report was drafted by John Dossey,
Johannes Hartig, Eckhard Klieme and Margaret Wu, under the direction of
the OECD Directorate for Education, principally by Claire Shewbridge and
Andreas Schleicher, with advice and analytic support from Raymond Adams,
Barry McCrae and Ross Turner. The PISA problem-solving framework and
assessment instruments were prepared by the PISA Consortium and PISA
Problem Solving Expert Group under the direction of Raymond Adams at the
Australian Council for Educational Research. Data analytic support was provided
by Alla Berezener, Johannes Hartig and Margaret Wu.
The development of the report was steered by the PISA Governing Board, which
is chaired by Ryo Watanabe (Japan). Annex C of the report lists the members of
the various PISA bodies as well as the individual experts and consultants who
have contributed to this report and to PISA in general.
The report is published on the responsibility of the Secretary-General of the
OECD.
Ryo Watanabe
Chair of the PISA Governing Board
4
© OECD 2004 Problem Solving for Tomorrow’s World – First Measures of Cross-Curricular Competencies from PISA 2003
Barry McGaw
Director for Education, OECD
CHAPTER 1
PISA 2003 AND PROBLEM SOLVING....................................................................... 11
Table of Contents
Table of Contents
Introduction .................................................................................................................... 12
Problem solving in PISA 2003 .................................................................................... 16
Organisation of this report .......................................................................................... 20
READERS’ GUIDE ........................................................................................................... 22
CHAPTER 2
PROBLEM SOLVING IN PISA 2003 – HOW IT WAS MEASURED
AND HOW STUDENTS PERFORMED ........................................................................ 25
Introduction .................................................................................................................... 26
Problem solving in PISA ............................................................................................. 26
Organisation of the assessment area .......................................................................... 27
Problems chosen for the PISA problem-solving assessment ................................ 28
The PISA problem-solving scale ............................................................................... 28
• Level 3: Reflective, communicative problem solvers................................... 29
• Level 2: Reasoning, decision-making problem solvers ................................ 30
• Level 1: Basic problem solvers .......................................................................... 30
• Below Level 1: Weak or emergent problem solvers ..................................... 30
• Decision making – the Cinema Outing problem .......................................... 32
• System analysis and design – the Children’s Camp problem ..................... 34
• Trouble shooting – the Irrigation problem .................................................... 36
The percentage of students at each proficiency level of problem solving ........... 39
• Mean performance of countries........................................................................ 41
The distribution of problem-solving capabilities within countries ................... 44
Implications for policy .................................................................................................. 46
CHAPTER 3
STUDENT PERFORMANCE IN PROBLEM SOLVING COMPARED WITH
PERFORMANCE IN MATHEMATICS, READING AND SCIENCE ....................... 49
Introduction .................................................................................................................... 50
Problem-solving framework and test development ............................................... 50
• Emphasis on problem-solving processes ......................................................... 50
• Low content requirements ................................................................................. 51
• The key skills tested in problem solving ......................................................... 51
• Correlations between performance in reading, mathematics,
science and problem solving .............................................................................. 54
© OECD 2004 Problem Solving for Tomorrow’s World – First Measures of Cross-Curricular Competencies from PISA 2003
5
Table of Contents
Comparison between performances in mathematics and
problem solving at the country level ......................................................................... 55
Implications for policy .................................................................................................. 57
CHAPTER 4
STUDENT PERFORMANCE ON THE PROBLEM-SOLVING ITEMS .................... 59
Introduction .................................................................................................................... 60
Decision-making units .................................................................................................. 62
• Energy Needs ........................................................................................................ 62
• Cinema Outing ..................................................................................................... 67
• Holiday .................................................................................................................... 70
• Transit System ....................................................................................................... 73
System analysis and design units................................................................................. 76
ã Library System ...................................................................................................... 76
ã Design by Numbersâ ........................................................................................... 82
• Course Design ....................................................................................................... 88
• Children’s Camp ................................................................................................... 91
Trouble-shooting units.................................................................................................. 94
• Irrigation ................................................................................................................ 94
• Freezer .................................................................................................................... 98
Summary ........................................................................................................................101
CHAPTER 5
THE ROLE THAT GENDER AND STUDENT BACKGROUND
CHARACTERISTICS PLAY IN STUDENT PERFORMANCE IN PROBLEM
SOLVING .......................................................................................................................103
Introduction ..................................................................................................................104
Gender differences in problem solving...................................................................104
Comparison with gender differences in other assessment areas ..........................107
Parental occupational status ......................................................................................110
Parental education .......................................................................................................112
Possessions related to “classical” culture .................................................................113
Family structure ...........................................................................................................115
Place of birth and language spoken at home..........................................................116
Implications for policy ................................................................................................119
REFERENCES .................................................................................................................121
ANNEX A
...................................................................................................................123
Annex A1 Construction of indices and other derived measures
from the student context questionnaire ...........................................124
Annex A2 Detailed results from the factor analysis in Chapter 3 ..................126
Annex A3 The PISA target population and the PISA samples.........................128
6
© OECD 2004 Problem Solving for Tomorrow’s World – First Measures of Cross-Curricular Competencies from PISA 2003
Annex A6 Development of the PISA assessment instruments ........................139
Annex A7 Reliability of the marking of open-ended items .............................141
ANNEX B
Table of Contents
Annex A4 Standard errors, significance tests and subgroup comparisons ......137
Annex A5 Quality assurance ...................................................................................138
Data tables for the chapters .......................................................................................143
ANNEX C
The development and implementation of PISA – a collaborative effort ..............157
© OECD 2004 Problem Solving for Tomorrow’s World – First Measures of Cross-Curricular Competencies from PISA 2003
7
Table of Contents
LIST OF BOXES
Box 1.1
Key features of the PISA 2003 assessment ................................................................................................................... 15
Box 2.1
Interpreting sample statistics ......................................................................................................................................... 43
LIST OF FIGURES
Figure 1.1
A map of PISA countries ................................................................................................................................................ 14
Figure 2.1
Figure 2.2
Figure 2.3
Figure 2.4
Figure 2.5
Features of the three types of problem solving ........................................................................................................... 29
The PISA problem-solving scale .................................................................................................................................... 31
Percentage of students at each level of proficiency on the problem-solving scale ................................................. 41
Multiple comparisons of mean performance on the problem-solving scale ........................................................... 42
Distribution of student performance on the problem-solving scale ........................................................................ 45
Figure 3.1
Figure 3.2
Figure 3.3
Analysis of two dominant factors in student performance on the problem-solving,
reading and mathematics items................................................................................................................................ 52-53
Latent correlations between the four assessment areas ............................................................................................. 55
Difference between student performance in mathematics and problem solving ................................................... 56
Figure 4.1
Figure 4.2
Figure 4.3
Figure 4.4
Figure 4.5
Figure 4.6
Figure 4.7
Figure 4.8
Figure 4.9
Figure 4.10
Figure 4.11
Figure 4.12
Figure 4.13
Problem-solving units and their characteristics .......................................................................................................... 61
Full credit student work on Energy Needs, Question 2 ............................................................................................... 65
Partial credit student work on Energy Needs, Question 2 – example 1 ....................................................................... 66
Partial credit student work on Energy Needs, Question 2 – example 2 ....................................................................... 66
No credit student work on Energy Needs, Question 2 ................................................................................................. 66
Partial credit solution for Transit System (Response Coding Code 11) ........................................................................ 75
Example of full credit response to Library System, Question 2 .................................................................................. 80
Partial credit solution for Library System, Question 2 (Response Code 11) ................................................................. 81
Example of full credit response for Design by Numbers©, Question 3 .......................................................................... 86
Example of partial credit response for Course Design, Question 1 ............................................................................... 90
Example of full credit response for Children’s Camp, Question 1 ................................................................................ 93
Example of partial credit response for Children’s Camp, Question 1 ........................................................................... 93
Graph of PISA problem-solving item scale values by problem type ...................................................................... 101
Figure 5.1
Figure 5.2
Figure 5.3
Figure 5.4
Figure 5.5
Figure 5.6
Figure 5.7
Figure 5.8
Figure 5.9
Figure 5.10
Gender differences in student performance in problem solving ............................................................................ 105
Percentage of males and females performing below Level 1 and at Level 3 in problem solving....................... 106
Gender differences in problem solving and in mathematics ................................................................................... 108
Gender differences in problem solving and in reading ............................................................................................ 109
Parental occupational status and student performance in problem solving .......................................................... 111
Parental education and student performance in problem solving .......................................................................... 113
Cultural possessions and student performance in problem solving ....................................................................... 114
Type of family structure and student performance in problem solving ................................................................ 115
Place of birth and student performance in problem solving ................................................................................... 117
Home language and student performance in problem solving ............................................................................... 118
LIST OF TABLES
Table A2.1
Table A2.2
Table A3.1
Table A3.2
8
Eigenvalues of the first 12 factors and total variance explained ............................................................................. 126
Component correlation matrix ................................................................................................................................... 126
PISA target populations and samples .................................................................................................................. 129-130
Exclusions ....................................................................................................................................................................... 132
© OECD 2004 Problem Solving for Tomorrow’s World – First Measures of Cross-Curricular Competencies from PISA 2003
Response rates................................................................................................................................................................ 135
Table 2.1
Table 2.2
Percentage of students at each level of proficiency on the problem-solving scale ............................................... 144
Mean score and variation in student performance on the problem-solving scale ................................................ 145
Table 3.1
Table 3.2
Factor loadings of mathematics, reading and problem-solving items .................................................................... 146
Difference between mean scores in mathematics and problem solving ................................................................ 147
Table 5.1
Gender differences in mean score in student performance on the problem-solving, mathematics
and reading scales and percentage of males and females below Level 1 and at Level 3
of the problem-solving scale ....................................................................................................................................... 148
International socio-economic index of occupational status (HISEI) and performance
on the problem-solving scale, by national quarters of the index ........................................................................... 149
Index of highest educational level of parents (HISCED) and performance on the problem-solving scale,
by national quarters of the index ............................................................................................................................... 150
Index of possessions related to “classical” culture in the family home and performance
on the problem-solving scale, by national quarters of the index ........................................................................... 151
Percentage of students and performance on the problem-solving scale, by type of family structure ............. 152
Percentage of students and performance on the problem-solving scale, by students’ nationality
and the nationality of their parents ............................................................................................................................. 153
Percentage of students and performance on the problem-solving scale, by language spoken at home ............... 154
Table 5.2
Table 5.3
Table 5.4
Table 5.5
Table 5.6
Table 5.7
© OECD 2004 Problem Solving for Tomorrow’s World – First Measures of Cross-Curricular Competencies from PISA 2003
Table of Contents
Table A3.3
9
1
PISA 2003 and
Problem Solving
Introduction ........................................................................................................ 12
Problem solving in PISA 2003 ....................................................................... 16
Organisation of this report ............................................................................ 20
© OECD 2004 Problem Solving for Tomorrow’s World – First Measures of Cross-Curricular Competencies from PISA 2003
11
PISA 2003 and Problem Solving
1
Introduction
This report looks at how
well students can solve
problems not linked
to specific parts of the
school curriculum.
How well prepared are young adults to solve the problems that they will
encounter in life beyond school, in order to fulfil their goals in work, as citizens
and in further learning? For some of life’s challenges, they will need to draw
on knowledge and skills learned in particular parts of the school curriculum –
for example, to recognise and solve a mathematics-related problem. Other
problems will be less obviously linked to school knowledge, and will often
require students to deal with unfamiliar situations by thinking flexibly and
creatively. This report is concerned with problem solving of the second, more
general variety.
It should be understood
both as a part of the
initial results of
PISA 2003…
The Organisation for Economic Co-operation and Development’s (OECD)
Programme for International Student Assessment (PISA) conducted its second
survey of student knowledge and skills of 15-year-olds in 2003. Learning for
Tomorrow’s World – First Results from PISA 2003 (OECD, 2004a) summarises the
results from the assessment of mathematics, science and reading. This report
summarises results from the assessment of the problem-solving skills. This feature
of PISA represents an important development in an innovative international
survey seeking to probe beyond conventional assessments of student abilities
centred on particular school subject areas.
…and in relation to
PISA as a whole.
PISA’s assessment of problem-solving skills needs to be understood in the
context of the overall features and purposes of PISA.The introduction to Learning
for Tomorrow’s World – First Results from PISA 2003 (OECD, 2004a) describes the
survey and explains how PISA assesses mathematics, science and reading. A brief
summary of key features of PISA is provided below before this report turns to
how PISA assesses problem-solving skills.
PISA measures how
well 15-year-olds
are prepared for life’s
challenges.
PISA seeks to measure how well young adults, at age 15 – and therefore
approaching the end of compulsory schooling – are prepared to meet the
challenges of today’s knowledge societies. The assessment is forward-looking,
focusing on young people’s ability to use their knowledge and skills to meet
real-life challenges, rather than just examining the extent to which they have
mastered a specific school curriculum. This orientation reflects a change in the
goals and objectives of curricula themselves, which are increasingly concerned
with how students use what they learn at school, and not merely whether they
can reproduce what they have learned. Key features driving the development of
PISA have been:
• its policy orientation, with design and reporting methods determined by the
need of governments to draw policy lessons;
• the innovative “literacy” concept that is concerned with the capacity of students
to apply knowledge and skills in key subject areas and to analyse, reason and
communicate effectively as they pose, solve and interpret problems in a variety
of situations;
12
© OECD 2004 Problem Solving for Tomorrow’s World – First Measures of Cross-Curricular Competencies from PISA 2003
1
PISA 2003 and Problem Solving
• its relevance to lifelong learning, which does not limit PISA to assessing
students’ curricular and cross-curricular competencies but also asks them to
report on their motivation to learn, their beliefs about themselves and their
learning strategies;
• its regularity, which will enable countries to monitor their progress in meeting
key learning objectives; and
• its breadth of geographical coverage, with the 48 countries that have
participated in a PISA assessment so far and the 11 additional ones that will
join the PISA 2006 assessment, representing a total of one-third of the world
population and almost nine-tenths of the world’s GDP.1
PISA is the most comprehensive and rigorous international programme to assess
student performance and to collect data on the student, family and institutional
factors that can help to explain differences in performance. Decisions about
the scope and nature of the assessments and the background information to be
collected are made by leading experts in participating countries, and steered
jointly by their governments on the basis of shared, policy-driven interests.
Substantial efforts and resources are devoted to achieving cultural and linguistic
breadth and balance in the assessment materials. Stringent quality assurance
mechanisms are applied in translation, sampling and data collection. As a
consequence, the results of PISA have a high degree of validity and reliability,
and can significantly improve understanding of the outcomes of education in the
world’s most developed countries, as well as in many others at earlier stages of
economic development.
Helped by leading
experts, participating
countries and the OECD
have created valid
cross-country assessment
materials.
The first PISA survey was conducted in 2000 in 32 countries (including 28
OECD member countries) and repeated in 11 additional partner countries in
2002. In PISA 2000, where the focus was on reading, students performed written
tasks under independently supervised test conditions in their schools. The first
results were published in 2001 (OECD, 2001a) and 2003 (OECD, 2003a), and
followed by a series of thematic reports looking in more depth at various aspects
of the results.2 PISA 2003, reported on here, was conducted in 41 countries,
including all 30 OECD member countries (Figure 1.1). It included an in-depth
assessment of mathematics as well as less detailed assessments in science and
reading. A special feature of the 2003 survey was the one-off assessment of
problem-solving skills. In the next three-yearly survey, PISA 2006, the primary
focus will be on science, and there will be a return to the focus on reading in
2009.3
The first survey took
place in 2000 and
focused on reading
literacy, while PISA 2003
focused on mathematics
and PISA 2006 will focus
on science.
Although PISA was originally created by the OECD governments in response to
their own needs, it has now become a major policy tool for many other countries
and economies as well. PISA is playing an increasing role in regions around the
world, and the survey has now been conducted or is planned in the partner
countries in Southeast Asia (Hong Kong-China, Indonesia, Macao-China, Chinese
Taipei and Thailand), Eastern Europe (Albania, Bulgaria, Croatia, Estonia, Latvia,
PISA is being used not
just in the OECD area
but across the world.
© OECD 2004 Problem Solving for Tomorrow’s World – First Measures of Cross-Curricular Competencies from PISA 2003
13
1
PISA 2003 and Problem Solving
Figure 1.1 • A map of PISA countries
OECD countries
Australia
Austria
Belgium
Canada
Czech Republic
Denmark
Finland
France
Germany
Greece
Hungary
Iceland
Ireland
Italy
Japan
Korea
Luxembourg
Mexico
Netherlands
New Zealand
Norway
Poland
Portugal
Slovak Republic
Spain
Sweden
Switzerland
Turkey
United Kingdom
United States
14
Partner countries in
PISA 2003
Partner countries in
other PISA assesments
Brazil
Hong Kong-China
Indonesia
Latvia
Liechtenstein
Macao-China
Russian Federation
Serbia and Montenegro
Thailand
Tunisia
Uruguay
Albania
Argentina
Azerbaijan
Bulgaria
Chile
Colombia
Croatia
Estonia
Israel
Jordan
Kazakhstan
Kyrgyz Republic
Lithuania
Macedonia
Peru
Qatar
Romania
Slovenia
Chinese Taipei
© OECD 2004 Problem Solving for Tomorrow’s World – First Measures of Cross-Curricular Competencies from PISA 2003
1
PISA 2003 and Problem Solving
Lithuania, the Former Yugoslav Republic of Macedonia, Romania, the Russian
Federation, Serbia4 and Slovenia), the Middle East (Jordan, Israel and Qatar),
South America (Argentina, Brazil, Chile, Colombia, Peru and Uruguay) and North
Africa (Tunisia). Across the world, policy makers use PISA findings to:
• gauge the literacy skills of students in their own country in comparison with
those of the other participating countries;
• establish benchmarks for educational improvement, for example, in terms of
the mean scores achieved by other countries or their capacity to provide high
levels of equity in educational outcomes and opportunities; and
• understand relative strengths and weaknesses of their education system.
National interest in PISA is illustrated by the many reports produced in
participating countries and by the numerous references to the results of PISA
in public debates and the media throughout the world (see www.pisa.oecd.org for
examples).
Globally, it has become
part of the public debate.
Box 1.1 • Key features of the PISA 2003 assessment
Content
• The survey covers mathematics (the main focus in 2003), reading, science and problem solving.
PISA considers student knowledge in these areas not in isolation but in relation to students’ ability
to reflect on their knowledge and experience and to apply them to real world issues.The emphasis
is on the mastery of processes, the understanding of concepts, and the ability to function in various
situations within each assessment area.
• PISA integrates the assessment of subject-specific knowledge with cross-curricular competencies. In
PISA 2003, as in 2000, students assessed their own characteristics as learners. The 2003 survey also
introduced the first assessment of wider student competencies – assessing problem-solving abilities.
Methods
• Each participating student spent two hours carrying out pencil-and-paper tasks.
• Questions requiring students to construct their own answers were combined with multiple-choice
items. Items were typically organised in units based on a written passage or graphic, of the kind
that students might encounter in real life.
• A total of six-and-a-half hours of assessment items was included, with different students taking
different combinations of the assessment items. Three-and-a-half hours of testing time was in
mathematics, with one hour each for reading, science and problem solving.
• Students answered a questionnaire that took about 30 minutes to complete and focused on their
background, their learning habits and their perceptions of the learning environment, as well as on
their engagement and motivation.
• School principals completed a questionnaire about their school that included demographic
characteristics as well as an assessment of the quality of the learning environment at school.
© OECD 2004 Problem Solving for Tomorrow’s World – First Measures of Cross-Curricular Competencies from PISA 2003
15
PISA 2003 and Problem Solving
1
Outcomes
• A profile of knowledge and skills among 15-year-olds in 2003.
• Contextual indicators relating performance results to student and school characteristics.
• A knowledge base for policy analysis and research.
• A first estimate of change in student knowledge and skills over time, between the assessments in
2000 and 2003.
Sample size
• Well over a quarter of a million students, representing about 23 million 15-year-olds in the schools
of the 41 participating countries, were assessed on the basis of scientific probability samples.
Future assessments
• The PISA 2006 assessment will focus on science and PISA 2009 will return to a focus on reading.
• Part of future assessments will require students to use computers, expanding the scope of the
skills that can be tested and reflecting the importance of information and computer technology
(ICT) as a medium in modern societies.
Problem solving in PISA 2003
A framework has been
established to enable
countries to assess
students’ ability to solve
problems that are not
bound to specific areas of
school knowledge.
The collection of data concerning students’ problem-solving skills as part of PISA
2003 was undertaken because the OECD countries attach great importance to
how far students’ capabilities in reading, mathematics and science are matched by
an overall capability to solve problems in real-life situations beyond the specific
context of school subject areas. To address this, the OECD countries established
a framework and assessment instruments to evaluate students’ capacities to:
• identify problems in cross-curricular settings;
• identify relevant information or constraints;
• represent possible alternatives or solution paths;
• select solution strategies;
• solve problems;
• check or reflect on the solutions; and
• communicate the results.
The framework for this assessment is discussed in Chapter 2 and described in
full in The PISA 2003 Assessment Framework: Mathematics, Reading, Science and Problem
Solving Knowledge and Skills (OECD, 2003b).
PISA chose three types of problemsolving exercises to assess.
Given the amount of time available for the assessment, the decision was made to
focus on students’ problem-solving capabilities in three types of situation:
• making decisions under constraints;
• evaluating and designing systems for a particular situation; and
• trouble-shooting a malfunctioning device or system based on a set of symptoms.
16
© OECD 2004 Problem Solving for Tomorrow’s World – First Measures of Cross-Curricular Competencies from PISA 2003
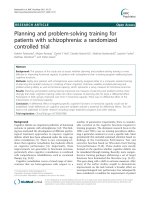
Working with these types of problems, a large set of tasks was developed and
field tested in participating countries. The results were 19 tasks that required
problem-solving skills, most of which are set in units consisting of two or three
related items dealing with the same contextual situation. For example, the unit
Holiday (shown below) consists of two items – the first asking students a direct
question that assesses to what degree they understand the problem and are able
to grasp the scheduling decisions that must be made, the second question asking
for an itinerary that meets the criteria given. In responding, students have to
deal with the constraints of the roads, distances, camp locations, towns that the
individual (Zoe) wants to visit; the maximum amounts of travel per day; and the
visiting times in the specific towns she wants to visit on her trip.
PISA 2003 and Problem Solving
1
HOLIDAY
This problem is about planning the best route for a holiday.
Figures 1 and 2 show a map of the area and the distances between towns.
Figure 1. Map of roads between towns
Lapat
Kado
Megal
Nuben
Angaz
Piras
Figure 2. Shortest road distance of towns from each other in kilometres.
Angaz
Kado
Lapat
Megal
Nuben
Piras
550
500
300
500
300
Angaz
300
850
850
Kado
550
1000
800
Lapat
450
600
Megal
250
Nuben
Piras
HOLIDAY – Question 1
Calculate the shortest distance by road between Nuben and Kado.
Distance: ..................................................... kilometres.
© OECD 2004 Problem Solving for Tomorrow’s World – First Measures of Cross-Curricular Competencies from PISA 2003
17
1
PISA 2003 and Problem Solving
HOLIDAY – Question 2
Zoe lives in Angaz. She wants to visit Kado and Lapat. She can only travel up to
300 kilometres in any one day, but can break her journey by camping overnight
anywhere between towns.
Zoe will stay for two nights in each town, so that she can spend one whole day
sightseeing in each town.
Show Zoe’s itinerary by completing the following table to indicate where she
stays each night.
Day
1
Overnight Stay
Camp-site between Angaz and Kado.
2
3
4
5
6
7
18
Angaz
These are described in
more detail in Chapter 4.
All of the items in the units for problem solving are shown in Chapter 4, along
with the criteria used to evaluate student performance. Each of the items is
illustrated along with a sample of student work, and the difficulty of each
item is matched with a score on a scale constructed to report problem-solving
performance among students participating in PISA 2003.
The information on
problem solving enriches
our understanding of
student competencies…
The data from this part of the PISA assessment give a first glimpse of what
students can do when asked to use their total accumulated knowledge and skills
to solve problems in authentic situations that are not associated with a single
part of the school curriculum.
…and can be used in
combination with other
PISA results to inform
the development of school
systems.
The results from PISA provide a basis for the participating countries to compare
the results of their varied investments in education and learning. When diverse
educational structures are compared in terms of their student outcomes,
some patterns of similarity emerge. Analyses of the outcomes suggest possible
alternatives for action within the countries or support for continued work
along the path that has been chosen for education within the countries.
Most importantly, the findings provide those responsible for education with
information through which they can examine the strengths and weaknesses of
the programmes they are currently offering their students.
PISA assesses students
aged 15 who are still at
school, regardless of grade
or institution…
In order to ensure the comparability of the results across countries, PISA needs
to assess comparable target populations. Differences between countries in the
nature and extent of pre-primary education and care, in the age of entry to
formal schooling, and in the structure of the education system do not allow
© OECD 2004 Problem Solving for Tomorrow’s World – First Measures of Cross-Curricular Competencies from PISA 2003
1
PISA 2003 and Problem Solving
school grades to be defined so that they are internationally comparable. Valid
international comparisons of educational performance must, therefore, define
their populations with reference to a target age. PISA covers students who are
aged between 15 years 3 months and 16 years 2 months at the time of the
assessment, regardless of the grade or type of institution in which they are
enrolled and of whether they are in full-time or part-time education. The use of
this age in PISA, across countries and over time, allows a consistent comparison
of the performance of students shortly before they complete compulsory
education.
As a result, this report is able to make statements about the knowledge and
skills of individuals born in the same year and still at school at 15 years of age,
but having differing educational experiences, both within and outside school.
The number of school grades in which these students are to be found depends
on a country’s policies on school entry and promotion. Furthermore, in some
countries, students in the PISA target population represent different education
systems, tracks or streams.
Stringent technical standards were established for the definition of national
target populations. PISA excludes 15-year-olds not enrolled in educational
institutions. In the remainder of this report “15-year-olds” is used as shorthand
to denote the PISA student population. Coverage of the target population of
15-year-olds within education is very high compared with other international
surveys: relatively few schools were ineligible for participation, for example
because of geographically remoteness or because their students had special
needs. In 24 out of 41 participating countries, the percentage of school-level
exclusions amounted to less than 1 per cent, and to less than 3 per cent in
all countries except Mexico (3.6 per cent), Switzerland (3.4 per cent), the
United Kingdom (3.4 per cent) and the partner countries Latvia (3.8 per cent)
and Serbia (5.3 per cent). When accounting for the exclusion within schools
of students who met certain internationally established criteria,5 the exclusion
rates increase slightly. However, it remains below 2 per cent in 19 participating
countries, below 4 per cent in 29 participating countries, below 6 per cent in all
but two countries and below 8 per cent in all countries (Annex A3). This high
level of coverage contributes to the comparability of the assessment results. For
example, even assuming that the excluded students would have systematically
scored worse than those who participated, and that this relationship is moderately
strong, an exclusion rate in the order of 5 per cent would likely lead to an
overestimation of national mean scores of less than 5 score points.6 Moreover,
in most cases the exclusions were inevitable. For example, in New Zealand
2.3 per cent of the students were excluded because they had less than one year
of instruction in English (often because they were foreign fee-paying students)
and were therefore not able to follow the instructions of the assessment.
…and only leaves out
small parts of the target
population…
The specific sample design and size for each country was designed to maximise
sampling efficiency for student-level estimates. In OECD countries, sample
sizes ranged from 3 350 students in Iceland to 30 000 students in Mexico.
…with sufficiently large
scientific samples to allow
for valid comparisons.
© OECD 2004 Problem Solving for Tomorrow’s World – First Measures of Cross-Curricular Competencies from PISA 2003
19
PISA 2003 and Problem Solving
1
20
This selection of samples was monitored internationally and accompanied by
rigorous standards for the participation rate to ensure that the PISA results
reflect the skills of 15-year-old students in participating countries.
Organisation of this report
This report describes
and analyses student
performance in problem
solving.
The report provides an in-depth examination of the results on the performance
of students in the 41 countries participating in PISA 2003 on the items for
problem solving. The following four chapters provide detailed analysis of the
data, their meaning and their implications.
Chapter 2 describes the
criteria used to assess
it, and reports overall
country performance.
Chapter 2 provides an introduction to problem solving and a closer inspection
of the definition of the assessment area as used by PISA 2003 in the development
of the assessment. Central to this description is the role that problem solving
plays as a basis for future learning, for fruitful employment, and for productive
citizenship. Following a further description of the assessment framework through
a selection of sample problems, the PISA problem-solving scale is discussed
using student performance on these problems as a way of interpreting the scale.
This is followed by an overall discussion of the performance of students from
the 41 participating nations.
Chapter 3 compares
student performance in
problem solving to their
performance in other
PISA assessment areas.
Chapter 3 analyses students’ results in problem solving, mathematics, reading
and science to better understand the cognitive demands of the problem-solving
assessment. The chapter provides a country-by-country comparison of mean
performance of students and compares this with their mean performances in
mathematics, reading and science.
Chapter 4 looks in more
detail at how students
responded to individual
items.
Chapter 4 provides a comprehensive look at the problem-solving assessment.
It describes the tasks and individual items classified by PISA problem types.
Several items are accompanied by sample student work illustrating the criteria
for scoring and the variety of problem-solving approaches that students used in
their solutions.
Chapter 5 analyses how
student competencies in
problem solving relate
to gender and family
background.
Chapter 5 provides an analysis of the relationships between problem-solving
performance and a variety of student, family, and other background characteristics.
Central to these comparisons is the consideration of gender differences in problem
solving. This is followed by consideration of the impact of student family features
on student problem solving. These analyses include the occupational status
of students’ parents and other factors having central importance to students’
performance on the problem-solving items.
© OECD 2004 Problem Solving for Tomorrow’s World – First Measures of Cross-Curricular Competencies from PISA 2003
Notes
1.
The combined population of all countries (Chinese Taipei not included) that participate in the PISA 2000, 2003 or 2006
assessments amounts to 32 per cent of the 2002 world population. The combined GDP of these countries amounts
to 87.4 per cent of the 2002 world GDP. The data on GDP and population sizes were derived from the U.N. World
Development Indicators database.
2.
Themes of international thematic reports included: Reading for Change – Performance and Engagement Across Countries (OECD,
2002a), Learners for Life – Student Approaches to Learning (OECD, 2003c), Student Engagement at School – A Sense of Belonging
and Participation (OECD, 2003d), What Makes School Systems Perform (OECD, 2004b) and School Factors Relating to Quality and
Equity (OECD, forthcoming)
3.
The framework for the PISA 2006 assessment has been finalised and preparations for the implementation of the assessment
are currently underway. Governments will decide on subsequent PISA assessments in 2005.
4.
For the country Serbia and Montenegro, data for Montenegro are not available. The latter accounts for 7.9 per cent of the
national population. The name “Serbia” is used as a shorthand for the Serbian part of Serbia and Montenegro.
5.
Countries were permitted to exclude up to 2.5 per cent of the national desired target population within schools if these
students were: i) considered in the professional opinion of the school principal or of other qualified staff members, to be
educable mentally retarded or who had been defined as such through psychological tests (including students who were
emotionally or mentally unable to follow the general instructions given in PISA); ii) permanently and physically disabled in
such a way that they could not perform in the PISA assessment situation (functionally disabled students who could respond
were to be included in the assessment); or iii) non-native language speakers with less than one year of instruction in the
language of the assessment (for details see Annex A3).
6.
If the correlation between the propensity of exclusions and student performance is 0.3, resulting mean scores would
likely be overestimated by 1 score point if the exclusion rate is 1 per cent, by 3 score points if the exclusion rate is 5 per
cent, and by 6 score points if the exclusion rate is 10 per cent. If the correlation between the propensity of exclusions and
student performance is 0.5, resulting mean scores would be overestimated by 1 score point if the exclusion rate is 1 per
cent, by 5 score points if the exclusion rate is 5 per cent, and by 10 score points if the exclusion rate is 10 per cent. For
this calculation, a model was employed that assumes a bivariate normal distribution for the propensity to participate and
performance. For details see the PISA 2000 Technical Report (OECD 2002b).
© OECD 2004 Problem Solving for Tomorrow’s World – First Measures of Cross-Curricular Competencies from PISA 2003
PISA 2003 and Problem Solving
1
21
Readers’ Guide
READERS’ GUIDE
Data underlying the figures
The data referred to in Chapters 2, 3 and 5 of this report are presented in Annex B and, with
additional detail, on the web site www.pisa.oecd.org. Three symbols are used to denote missing data:
a The category does not apply in the country concerned. Data are therefore missing.
c There are too few observations to provide reliable estimates (i.e. there are fewer than 3 per
cent of students for this cell or too few schools for valid inferences). However, these statistics
were included in the calculation of cross-country averages.
m Data are not available. These data were collected but subsequently removed from the
publication for technical reasons.
Calculation of international averages
An OECD average was calculated for most indicators presented in this report. In the case of some
indicators, a total representing the OECD area as a whole was also calculated:
• The OECD average takes the OECD countries as a single entity, to which each country
contributes with equal weight. For statistics such as percentages of mean scores, the OECD
average corresponds to the arithmetic mean of the respective country statistics. In contrast, for
statistics relating to variation, the OECD average may differ from the arithmetic mean of the
country statistics because it not only reflects variation within countries, but also variation that
lies between countries.
• The OECD total takes the OECD countries as a single entity, to which each country contributes
in proportion to the number of 15-year-olds enrolled in its schools (see Annex A3 for data). It
illustrates how a country compares with the OECD area as a whole.
In this publication, the OECD total is generally used when references are made to the stock of
human capital in the OECD area. Where the focus is on comparing performance across education
systems, the OECD average is used. In the case of some countries, data may not be available for
specific indicators or specific categories may not apply. Readers should, therefore, keep in mind that
the terms OECD average and OECD total refer to the OECD countries included in the respective
comparisons. All international averages include data for the United Kingdom, even where these
data, for reasons explained in Annex A3, are not shown in the respective data tables.
Rounding of figures
Because of rounding, some figures in tables may not exactly add up to the totals.Totals, differences and
averages are always calculated on the basis of exact numbers and are rounded only after calculation.
When standard errors in this publication have been rounded to one or two decimal places and the
value 0.0 or 0.00 is shown, this does not imply that the standard error is zero, but that it is smaller
than 0.05 or 0.005 respectively.
22
© OECD 2004 Problem Solving for Tomorrow’s World – First Measures of Cross-Curricular Competencies from PISA 2003
The report usually uses “15-year-olds” as shorthand for the PISA target population. In practice,
this refers to students who were aged between 15 years and 3 (complete) months and 16 years
and 2 (complete) months at the beginning of the assessment period and who were enrolled in an
educational institution, regardless of the grade level or type of institution, and of whether they were
attending full-time or part-time (for details see Annex A3).
Readers’ Guide
Reporting of student data
Abbreviations used in this report
The following abbreviations are used in this report:
GDP
ISCED
SD
SE
Gross Domestic Product
International Standard Classification of Education
Standard deviation
Standard error
Further documentation
For further information on the PISA assessment instruments and the methods used in PISA, see the
PISA 2000 Technical Report (OECD, 2002b) and the PISA Web site (www.pisa.oecd.org).
© OECD 2004 Problem Solving for Tomorrow’s World – First Measures of Cross-Curricular Competencies from PISA 2003
23
2
Problem Solving
in PISA 2003 –
How It Was Measured and
How Students Performed
Introduction ........................................................................................................ 26
Problem solving in PISA.................................................................................. 26
Organisation of the assessment area .......................................................... 27
Problems chosen for the PISA problem-solving assessment ........... 28
The PISA problem-solving scale .................................................................. 28
• Level 3: Reflective, communicative problem solvers .................................. 29
• Level 2: Reasoning, decision-making problem solvers ............................... 30
• Level 1: Basic problem solvers ....................................................................... 30
• Below Level 1: Weak or emergent problem solvers .................................... 30
• Decision making – the Cinema Outing problem......................................... 32
• System analysis and design – the Children’s Camp problem ..................... 34
• Trouble shooting – the Irrigation problem ................................................... 36
The percentage of students at each proficiency level
of problem solving ............................................................................................ 39
• Mean performance of countries ..................................................................... 41
The distribution of problem-solving capabilities
within countries ................................................................................................. 44
Implications for policy .................................................................................... 46
© OECD 2004 Problem Solving for Tomorrow’s World – First Measures of Cross-Curricular Competencies from PISA 2003
25
Problem Solving in PISA 2003 – How It Was Measured and How Students Performed
2
Introduction
This chapter describes
how PISA measured
problem solving and
summarises student
performance overall.
This chapter provides an overview of how students’ performance in problem
solving was measured in PISA 2003, reports on how many students reached
various levels of proficiency and gives the mean and distribution of performance
in each participating country.
• First, the chapter defines problem solving, reviews the kind of problemsolving tasks that were used in PISA 2003 and describes the requirements
made of students in solving these problems.
• Second, the chapter describes the way in which student performance in
problem solving was measured.This is illustrated in relation to items used in this
assessment, and the percentage of each country’s students at each proficiency
level of the problem-solving scale is reported.
• Third, the chapter summarises the performance of students in each of the
countries participating in PISA 2003 by reporting their mean performance
and describing the distribution of scores on the problem-solving assessment
for the students within each country.
Problem solving in PISA
Problem solving is a
central part of education
across the curriculum.
Curricula in various subject areas often call for students to confront problem
situations by understanding information that is given, identifying critical features
and any relationships in a situation, constructing or applying one or more external
representations, resolving ensuing questions and, finally, evaluating, justifying
and communicating results as a means to further understanding the situation.
This is because problem solving is widely seen as providing an essential basis
for future learning, for effectively participating in society, and for conducting
personal activities.
To assess it requires
tasks that are...
The PISA 2003 Assessment Framework: Mathematics, Reading, Science and Problem
Solving Knowledge and Skills (OECD, 2003b) through which OECD countries
established the guiding principles for comparing problem-solving performance
across countries in PISA, defines problem competencies as:
… an individual’s capacity to use cognitive processes to confront and resolve
real, cross-disciplinary situations where the solution path is not immediately
obvious and where the content areas or curricular areas that might be applicable
are not within a single subject area of mathematics, science or reading.
Several aspects of this definition are worth noting.
…situated in real-life
contexts…
26
• The first is that the settings for the problems should be real. They should draw on
situations that represent contexts that could conceivably occur in a student’s life
or, at least, be situations the student can identify as being important to society,
if not directly applicable to his or her personal life. Thus, a real-life problem
calls on individuals to merge knowledge and strategies to confront and resolve
a problem, when the method by which this needs to be accomplished is not
readily apparent to the problem solver.
© OECD 2004 Problem Solving for Tomorrow’s World – First Measures of Cross-Curricular Competencies from PISA 2003
• The second feature is that they are not immediately resolvable through the
application of some defined process that the student has studied, and probably
practised, at school. The problems should present new types of questions
requiring the student to work out what to do. This is what causes the item
really to be a problem-solving item. Such problems call on individuals to
move among different, but sometimes related, representations and to exhibit a
certain degree of flexibility in the ways in which they access, manage, evaluate
and reflect on information.
…not resolvable through
the application of routine
solutions…
• Finally, the problems used should not be limited to a single content area that
students would have studied and practised as part of their study of a single
school subject in school.
…and require
connections between
multiple content areas.
Organisation of the assessment area
With this definition of problem solving, the nature of the tasks to be used in the
assessment was established in The PISA 2003 Assessment Framework: Mathematics,
Reading, Science and Problem Solving Knowledge and Skills (OECD, 2003b), based
on the following components:
The problem-solving tasks
were defined by the …
• Problem types. PISA 2003 focused on three problem types: decision making,
system analysis and design, and trouble shooting. These were chosen because they
are widely applicable and occur in a variety of settings. The problem types
used for PISA are described in more detail in the next section.
…the type of problem …
• Problem context. The problems used in the assessment were not set in the classroom or based on materials studied in the curriculum, but rather set in contexts
that a student would find in his/her personal life, work and leisure, and in the
community and society.
…the problem context…
• Problem-solving processes. The assessment was designed such that the results
would describe the degree to which students are able to confront, structure,
represent and solve problems effectively. Accordingly, the tasks included in
the assessment were selected to collect evidence of students’ knowledge and
skills associated with the problem-solving process. In particular, students had
to demonstrate that they could:
…and the problemsolving processes involved.
− Understand the problem: This included understanding text, diagrams, formulas
or tabular information and drawing inferences from them; relating information from various sources; demonstrating understanding of relevant
concepts; and using information from students’ background knowledge to
understand the information given.
− Characterise the problem: This included identifying the variables in the problem
and noting their interrelationships; making decisions about which variables
are relevant and irrelevant; constructing hypotheses; and retrieving,
organising, considering and critically evaluating contextual information.
Students had to show their
ability to understand the
problem…
− Represent the problem: This included constructing tabular, graphical, symbolic
or verbal representations; applying a given external representation to the
solution of the problem; and shifting between representational formats.
…represent the
problem…
Problem Solving in PISA 2003 – How It Was Measured and How Students Performed
2
…identify the variables
involved and their
interrelationships…
© OECD 2004 Problem Solving for Tomorrow’s World – First Measures of Cross-Curricular Competencies from PISA 2003
27