02 measuring networks, and random graph model
Bạn đang xem bản rút gọn của tài liệu. Xem và tải ngay bản đầy đủ của tài liệu tại đây (33.15 MB, 60 trang )
CS224W: Analysis of Networks
Jure Leskovec, Stanford University
Degree distribution:
P(k)
Path length:
h
Clustering coefficient:
C
Connected components: s
10/3/18
Jure Leskovec, Stanford CS224W: Analysis of Networks,
3
Degree distribution P(k): Probability that
a randomly chosen node has degree k
Nk = # nodes with degree k
P(k)
¡ Normalized histogram:
P(k) = Nk / N ➔ plot
¡
0.6
0.5
0.4
0.3
0.2
0.1
1
2
3
k
4
Nk
k
10/3/18
Jure Leskovec, Stanford CS224W: Analysis of Networks,
4
¡
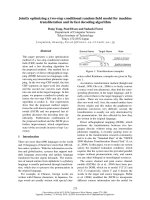
A path is a sequence of nodes in which each
node is linked to the next one
Pn = {i0,i1,i2,...,in }
¡
Pn = {(i0 ,i1),(i1 ,i2 ),(i2 ,i3 ),...,(in-1,in )}
Path can intersect itself
and pass through the
same edge multiple times
§ E.g.: ACBDCDEG
§ In a directed graph a path
can only follow the direction
of the “arrow”
10/3/18
B
F
A
D
E
G
C
X
Jure Leskovec, Stanford CS224W: Analysis of Networks,
H
5
D
¡
between a pair of nodes is defined as
A
X
the number of edges along the
C
shortest path connecting the nodes
B
§ *If the two nodes are not connected, the
hB,D = 2
hA,X = ∞
distance is usually defined as infinite
D
¡
In directed graphs paths need to
follow the direction of the arrows
A
C
B
hB,C = 1, hC,B = 2
10/3/18
Distance (shortest path, geodesic)
§ Consequence: Distance is
not symmetric: hB,C ≠ hC, B
Jure Leskovec, Stanford CS224W: Analysis of Networks,
6
¡
Diameter: The maximum (shortest path)
distance between any pair of nodes in a graph
¡
Average path length for a connected graph
(component) or a strongly connected
(component of a) directed graph
1
where h is the distance from node i to node j
h=
hij
E is max number of edges (total number of
å
2 Emax i , j ¹i
node pairs) = n(n-1)/2
ij
max
§ Many times we compute the average only over the
connected pairs of nodes (that is, we ignore “infinite”
length paths)
10/3/18
Jure Leskovec, Stanford CS224W: Analysis of Networks,
7
¡
Clustering coefficient:
§ What portion of i’s neighbors are connected?
§ Node i with degree ki
Đ Ci ẻ [0,1]
Đ
where ei is the number of edges
between the neighbors of node i
1
¡ Average clustering coefficient: C =
N
10/3/18
Jure Leskovec, Stanford CS224W: Analysis of Networks,
N
åC
i
i
8
¡
Clustering coefficient:
§ What portion of i’s neighbors are connected?
§ Node i with degree ki
§
where ei is the number of edges
between the neighbors of node i
B
F
A
D
E
G
C
H
10/3/18
kB=2, eB=1, CB=2/2 = 1
kD=4, eD=2, CD=4/12 = 1/3
Avg. clustering: C=0.33
Jure Leskovec, Stanford CS224W: Analysis of Networks,
9
¡
Size of the largest connected component
§ Largest set where any two vertices can be joined
by a path
¡
Largest component = Giant component
B
A
D
F
C
H
How to find connected components:
• Start from random node and perform
Breadth First Search (BFS)
• Label the nodes BFS visited
• If all nodes are visited, the network is connected
• Otherwise find an unvisited node and repeat BFS
G
10/3/18
Jure Leskovec, Stanford CS224W: Analysis of Networks,
10
Degree distribution:
P(k)
Path length:
h
Clustering coefficient:
C
Connected components: s
10/3/18
Jure Leskovec, Stanford CS224W: Analysis of Networks,
11
MSN Messenger.
¡ 1 month activity
§ 245 million users logged in
§ 180 million users engaged in
conversations
§ More than 30 billion
conversations
§ More than 255 billion
exchanged messages
10/3/18
Jure Leskovec, Stanford CS224W: Analysis of Networks,
13
10/3/18
Jure Leskovec, Stanford CS224W: Analysis of Networks,
14
Network: 180M people, 1.3B edges
10/3/18
Jure Leskovec, Stanford CS224W: Analysis of Networks,
15
Contact
10/3/18
Conversation
Messaging as an
undirected graph
• Edge (u,v) if users u and v
exchanged at least 1 msg
• N=180 million people
• E=1.3 billion edges
Jure Leskovec, Stanford CS224W: Analysis of Networks,
16
10/3/18
Jure Leskovec, Stanford CS224W: Analysis of Networks,
17
Note: We plotted the
same data as on the
previous slide, just
the axes are now
logarithmic.
10/3/18
Jure Leskovec, Stanford CS224W: Analysis of Networks,
18
Avg. clustering
of the MSN:
C = 0.1140
Ck: average Ci of nodes i of degree k: Ck =
10/3/18
1
Nk
åC
i:k i = k
i
Jure Leskovec, Stanford CS224W: Analysis of Networks,
19
10/3/18
Jure Leskovec, Stanford CS224W: Analysis of Networks,
20
Avg. path length 6.6
90% of the nodes can be reached in < 8 hops
10/3/18
Jure Leskovec, Stanford CS224W: Analysis of Networks,
#Nodes
0
1
1
10
2
78
3
3,96
4
8,648
5
3,299,252
6
28,395,849
7
79,059,497
8
52,995,778
9
10,321,008
10
1,955,007
11
518,410
12
149,945
13
44,616
14
13,740
15
4,476
16
1,542
17
536
18
167
19
71
20
29
21
16
22
10
23
3
24
2
# nodes as we do BFS out of a random node
Number of links
between pairs of
nodes in the
largest connected
component
Steps
25
21
3
Heavily skewed
avg. degree= 14.4
Degree distribution:
Path length:
6.6
Clustering coefficient:
0.11
Connectivity:
giant component
Are these values “expected”?
Are they “surprising”?
10/3/18
To answer this we need a null-model!
Jure Leskovec, Stanford CS224W: Analysis of Networks,
22
a. Undirected network
N=2,018 proteins as nodes
E=2,930 binding interactions as links.
b. Degree distribution:
Skewed. Average degree <k>=2.90
c. Diameter:
Avg. path length = 5.8
d. Clustering:
Avg. clustering = 0.12
Connectivity: 185 components
the largest component 1,647
nodes (81% of nodes)
10/3/18
Jure Leskovec, Stanford CS224W: Analysis of Networks,
23
¡
¡
Erdưs-Renyi Random Graphs [Erdưs-Renyi, ‘60]
Two variants:
§ Gn,p: undirected graph on n nodes and each
edge (u,v) appears i.i.d. with probability p
§ Gn,m : undirected graph with n nodes, and
m uniformly at random picked edges
What kind of networks do
such models produce?
10/3/18
Jure Leskovec, Stanford CS224W: Analysis of Networks,
25