Cs224W 2018 29
Bạn đang xem bản rút gọn của tài liệu. Xem và tải ngay bản đầy đủ của tài liệu tại đây (5.6 MB, 7 trang )
Predicting Drug Disease Associations
Heather Shen*! Christopher Vo*!
Abstract— Identifying associations of known drugs
with diseases has significant impact for drug repurposing and can offer disease remedies much faster
than developing a new drug. This falls into the classic
problem of link prediction in networks. Already, there is
significant research into solving link prediction for social
networks [2] and a burgeoning focus on disease and drug
associations[3][4]. Based on prior work in the area, we
perform link prediction for a drug-disease network using
topological as well as molecular features. Specifically, we
hope to suggest new or re—purposed drug uses as disease
treatments. We use well-known proximity methods as
our baseline, but focus on node embeddings to improve
predictions. Other experiments include enhancements
that exploit existing knowledge about drugs to perform
better link prediction for drug-disease associations.
I.
INTRODUCTION
Drug development is an expensive process with
the amount of effort needed to research and develop molecular prototypes, design clinical trials,
and pass approvals. Therefore, failed clinical trials are very costly for pharmaceutical companies.
However,
some failed drugs may be effective can-
didates for treating diseases other than the one
originally intended due to the molecular properties
of the drug. This can save great amounts of effort
and money on R&D by modifying and reusing
the existing pipeline for a failed clinical drug
instead of starting from scratch. Thus, predicting
potential associations between drugs and diseases
is a problem of great interest.
In this paper, we attempt to predict drug-disease
associations by leveraging existing drug-disease
networks in conjunction with chemical properties
of drugs. We plan to model this as a link prediction
problem on a disease-drug network. In particular,
our work will focus on evaluating various ways
to improve link prediction algorithms applied to
the bipartite drug-disease domain. Because drugs
*Stanford University
"Heather Shen
‘Christopher Vo
have underlying molecular structures related to
their efficacy in treating diseases, we hope to
augment network features with additional molecular features to improve link prediction via binary
classification.
II.
RELATED
WORK
Link prediction is a well researched problem in
general. One method of approaching this is based
on similarity metrics. As documented by LibenNowell and Kleinberg, metrics such as Common
Neighbors, Jaccard’s Coefficient, Adamic/Adar
Score, Preferential Attachment, and Katz method
can have good success in link prediction [6]. The
general idea is to use these similarity metrics to
score all pairs of nodes and take the highest scoring
pairs to be new links. However, these do not nec-
essary apply to bipartite graphs. These algorithms
tend to be based on several assumptions[1]:
e Triangle closing: New edges tend to form
triangles
e Clustering:
Nodes
tend to form
wellconnected clusters in the graph
In bipartite graphs, these assumptions are not
true, since triangles and larger cliques cannot appear. Therefore, we may apply certain similarity
metrics (as we describe below), but none that rely
on common neighbors or the above assumptions.
An alternative, well-documented method of link
prediction is extracting network features and using
them in a supervised classifier [2]. In this paper
by Hasan et al, they use a combination of several
features, both from the network
structure as well
as domain specific to predict future coauthorships
for academic papers. These features include: the
shortest distance between
pairs, clustering index,
and keyword match count. They then used several
machine learning classification models such as
decision trees and SVM to solve the classification
problem.
work
neighborhoods
of nodes
10?
T
T—T—T—TTTTỊ
T
T—T—TTTTTT
Degree Distribution of Drug Disease Network
Count
Choosing features to represent nodes and pairs
of nodes can be a challenging task. In this paper,
we will examine Grover and Leskovec’s network
embedding algorithm, node2vec, which aims to
map nodes to a low-dimensional space of features
that maximizes the likelihood of preserving net[7]. In this model
of representing nodes, distance between vectors
attempts to capture the similarity between nodes
in the original network. Once we extract these
mappings, we can use them as features for the
supervised learning problem as described in [2]
and [3] as well as in distance metrics
supervised
learning
models
[3]. The
idea is that
a drug is likely to be associated with diseases that
are associated with diseases that are associated
with other similar drugs. Similar drug scores were
obtained using various biological networks, such
as protein-protein interaction, gene regulation, and
drug-disease
networks,
and
used
as
features
for
supervised learning.
This idea that drugs treat diseases associated
with similar drugs can motivate other feature representations of drugs. For drugs, in addition to
biological network similarity, similarity can also
mean
molecular
similarity.
Therefore,
molecular
properties of drugs can further aid in link prediction. Vilar et al attempt to predict drug-drug
interactions by representing drug features through
molecular fingerprints [4]. Molecular fingerprints
are bit vector representations of whether a chemical structure contains various molecular properties.
The properties include features such as whether the
drug has a carbon ring, etc.
Ill.
A.
DATA
Network Data
We
will analyze
ị
IIIIIIIlIIlllLlll |
JÍMII
1 ll
1 04
Degree
[8].
These supervised learning approaches using network properties can be applied to the biological
domain. Oh ef al present methods to predict associations between drugs and diseases by using
TT
HH
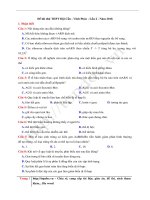
Fig. 1.
Degree distribution of the drug-disease network
e 466,657
edges
that indicate
associations
tween the disease and drugs
See Fig. 1 for the degree distribution.
be-
B. Molecular fingerprints
In
addition,
we
will
use
molecular
finger-
print representations of the drugs in the above
mentioned network dataset, computed from drug
SMILES (simplified molecular-input line-entry
system) codes using the RDKit package. SMILES
codes are string representations of the molecular
structure of a chemical compound. For example,
the SMILES code for acetaminophen (used in
Tylenol) is:
CC(= O)NƠI = CƠ = Œ(C = ŒLUO
For the drugs in the network,
the SMILES
can be obtained from DrugBank
Bank ID.
IV.
codes
using its Drug-
METHODS
Our methods range from predicting links based
on proximity scoring to classification of node
embeddings. We explore the following methods:
A. Prediction based on Proximity
the DCh-Miner
disease-drug
association network, provided as one of the BIOS-
NAP datasets. Drugs in the network may also
potentially include certain chemicals that are not
human drugs. In the network, we have:
e 5,535 disease nodes.
e 1,662 chemical/drugs nodes.
When
using proximity,
our methods
define
a
metric c(x,y) which scores the node pair x and y.
Based on these metrics, we predicted which node
pairs may have a new edge, described in Algorithm
1. Because of the bipartite graph structure, we
cannot use certain common proximity algorithms.
A disease only points to chemicals and a chemical
only points to diseases. Thus, a disease-chemical
pair will not have any common neighbors, preventing the use of metrics such as number of common
neighbors,
Adamic
and
Adar
measure,
and
the
Jaccard coefficent [1]. Instead we explore using the
shortest path length and preferential attachment.
It should be noted that we follow the standard
procedure and only consider edges where endpoints have degree greater than 3.
Algorithm 1 Link Prediction via Proximity
for node x <€ V do
for node y € V do
Compute c(z, y)
Append c(z,y) to scores
end for
end for
B. Feature learning
In addition to examining node similarity, we
wanted to combine machine learning techniques
and network characteristics. Using node2vec em-
beddings,
we can embed
nodes
with similar net-
work neighborhoods close in the feature space.
Using this feature vector representations, we can
then perform binary classification. Here, we discuss how we embed the nodes and different ways
we construct the feature vectors.
C. node2vec Embeddings
We
take
the
embeddings
outlined in Algorithm 2.
based
on
[7].
It is
Algorithm 2 The node2vec algorithm
Sort scores by decreasing score c(x, y)
Predict top n pairs as new links
See which of these links actually appear in test
graph
LearnFeatures (Graph G = (V, E, W), Dimensions
d, Walks per node r, Walk length /, Context size k,
Return p, In-out q)
mt = PreprocessModifiedW eights(G, p, q)
G! = (V,E,7)
Initialize walks to Empty
for iter = ltor
1) Shortest Path Length
We
for all nodesu € V do
walk = node2vecWalk(G’, u, 1)
Append walk to walks
end for
end for
f = StochasticGradientDescent(k, d, walks)
return ƒ
set c(x,y) to be the shortest path length
between x and y in our network. Intuitively, short
path lengths should mean that a drug and disease
share similar neighbors. Therefore,
a shorter path
would mean that the disease-chemical node pair is
more likely to have a relationship.
2) Preferential Attachment
Instead of examining path distance, we also
defined c(x,y) as the preferential attachment.
If d(a) is the number of neighbors of node x, the
preferential attachment model
between x and y of:
c(x,y) =
gives a prediction
do
node2vecWalk
u, Length 1)
(Graph G = (V, E, 7), Start node
Initialize walk to [u]
for walk;ter = 1tol do
d(x)d(y)
curr = walk{|—1}
QE]
Veurr = Get Neighbors(curr, G’)
s = AliasSample(V..,,,., 7
The factor am normalizes the sum of predictions
for a vertex to its degree.
Taking only the degree of x and y into account
for link prediction suggests that a disease or chemical with many associations will likely have another
association. Thus, nodes with higher scores based
on preferential attachment are more likely to be
linked.
Append s to walk
end for
return
D.
walk
Feature Combination
In addition, we can augment the node embeddings with additional features. These features
involve network features on the disease-drug network,
molecular
features
of drugs,
and
network
features derived from generated drug-drug networks.
1) Additional Disease-Drug Network Features
We can add additional features involving additional network properties, such as the similarity
scores we used above: i.e. degree of the disease,
degree of the chemical, shortest path, etc.
We used the structural role extraction algorithm
Rolx and its recursive feature extraction method
ReFex.
The first step was extracting basic local features
from each node, and then recursively aggregating
them along graph edges so that global features are
obtained. The basic features included: the degree
of node v and the number of edges that connects
the egonet of node v to the rest of the graph.
Once we collected the basic features for all
nodes, we then recursively generated more features
using mean and sum as aggregation steps.
Initially we have a feature vector V,, € R? for
every node wu. With each iteration, we concatenate
the mean of all w’s neighbors’ features to V,, and
do the same for sum.
We run this for 3 iterations.
2) Molecular Fingerprints
Molecular fingerprints of drugs can be used
to compare similarities between drugs. Using
SMILES
codes (described in the data section), we
have added information about chemical structures.
This proves additional information about underlying similarities between drugs and perhaps how
they might affect diseases [4].
To generate molecular fingerprints, SMILES
codes (string representations of molecular structure) are analyzed for specific molecular properties. These properties include chemical features
that in combination uniquely define a compound
such as number of carbonyl groups, existence of
a carbon
ring,
etc. These
features
are combined
into a bit vector with | indicator the existence of
the feature. There exist many types of fingerprint
feature sets but we will use Morgan fingerprints
generated from RDKit.
E.
Representing Edges as Feature
Vectors
Edges in the bipartite, undirected disease-drug
graph consist of two nodes. Because our embed-
dings
are for individual
nodes,
we
can represent
an edge as a combination of its two corresponding
node embeddings. There are multiple ways of
combining two vectors; in our implementation, we
compare
four different approaches
of concatena-
tion, Hadamard product, summation,
difference of the vectors.
and absolute
F. Models
To predict links, we cast our problem as a binary
classification problem where our input is a feature
representation of a disease and drug relationship
and the output is whether or not a link exists
between the disease and drug. We use various
supervised learning models, namely logistic regression and random forest models.
Logistic regression is a linear model that pre-
dicts the output h(x) given an input vector x as
follows:
h(x) = g(O" x) = Tite
where
1
te
1
ø(2) _ 1+ez
is the sigmoid function and @ is a set of weights.
Because
our output h(x)
€
{0,1}
is binary
we want a function that maps any real value to
between 0 and 1 which the sigmoid function does.
The goal of logistic regression is to find the 6
which minimizes the cost function J(@):
1(0) = 5S (holes) = ws)?
+n
=1
where m is the total number of training examples
and y; is the true value (0 or 1) of that training
example. This minimization can be done using
gradient descent over the training data.
Random forests are an ensemble model of many
decision trees, randomly initialized. Decision trees
are intuitive models for classification that attempt
to combine many rule-based splits on features
to determine the output. For example a simple
decision tree model for predicting a link between
nodes in a generic graph may be looking at the
number of common neighbors between the two
nodes and if this value is greater than a certain
threshold, we predict there is a link.
,
V.
TABLE
RESULTS
PERFORMANCE
A. Evaluation Methodology
Link prediction is traditionally seen as a binary
classification task to determine if an edge exists
between two nodes at a future time. Following this
guideline, we created two versions of the same
network,
one at time ¢ and another
at later time
t’, and attempted to predict which pairs of nodes
in time ¢ will have an edge between them at time
Ut’.
Because our network is not time dependent, we
removed n edges from the fully connected graph
and labeled this new graph to be the training graph
at time t. The fully connected one is considered
the test graph at time ¢’. This train and test graph
was used primarily for link prediction based on
proximity.
As we began looking at using binary classification tools, we knew
we
also needed positive and
negative samples to train and test on. The known
drug-disease association edges were split into our
positive train/test sets. We can augment these sets
of positive associations by generating a negative
examples
of
random,
non-associated
edges
be-
tween drugs and diseases to produce complete
train/test sets of positive and negative associations.
We can evaluate the performance of our models
on correctly predicting associations with standard
metrics such as accuracy, precision, recall, and #1
score.
B. Results of Proximity Methods
To better understand link prediction based on
proximity, we applied the proximity methods,
Shortest Path Length and Preferential Attachment,
directly to our bipartite graph. Both performed
very poorly. The accuracy of their predictions are
in Table I. There are several reasons why we
believe these methods did not work. Regarding
preferential attachment, our initial assumption was
that disease-chemical pairs that have many neighbors are more likely to form a new link. However,
upon further reflection, this does not reflect actual
disease-drug relationships. Just because you can
apply a drug to many diseases, or a disease is
treated by many drugs, does not accurately reflect
if a new drug may treat a disease.
Method
Shortest Path Length
Preferential Attachment
REGRESSION
Feature Representation
Furthermore,
II
PERFORMANCE
Accuracy
Concatenation
Hadamard Product
Summation
Absolute Difference
METHODS
Accuracy
0.0001
0.0345
TABLE
LOGISTIC
I
OF PROXIMITY
0.8060
0.8198
0.7893
0.8170
FOR
Precision
Recall
0.8485
0.8429
0.8252
0.8292
tend to form
f
0.7450
0.7860
0.7340
0.7985
proximity methods
the idea that nodes
EMBEDDINGS
Score
0.7934
0.8135
0.7769
0.8136
are based on
clusters,
which
is why shortest path length works well in unipartite graphs. However, thinking about the bipartite
graph, we realize that its unlikely that shortest path
length will reflect true disease-drug pairings. Thus,
applying traditional proximity methods directly to
our graph did not work as planned.
C. Results of Classification Models
We trained logistic regression and random forest
models on various sets of features discussed above
and evaluated the performance on our test set.
1) Node Embedding Features
We initially trained our models on features
representing the relationship between a disease
and drug as simply the combination between
their two node embedding vectors, produced by
node2vec. We combined vectors through concatenation, Hadamard
product,
summation,
and abso-
lute distance and compared the performance of
each of these feature representations with both
models, as seen in Tables II and III.
TABLE
RANDOM
FOREST
Feature Representation
Concatenation
Hadamard Product
Summation
Absolute Difference
II
PERFORMANCE
Accuracy
0.8333
0.8315
0.8270
0.8158
FOR
Precision
0.9013
0.8824
0.8794
0.8578
EMBEDDINGS
Recall
0.7485
0.7650
0.7580
0.7570
fF
Score
0.8178
0.8195
0.8142
0.8042
TABLE
LOGISTIC
REGRESSION
IV
PERFORMANCE
Random
WITH ADDITIONAL
Forest scores
by method
and
metric
FEATURES
Feature Representation
Accuracy
Precision
0.8665
0.8071
node2vec + Molecular Fingerprints
node2vec + Network + Fingerprints
0.8114
0.8464
0.8455
0.8665
0.7468
0.8071
0.8464
Recall
F
0.8 4
Score
0.8357
0.7931
0.8357
0.6 +
Scores
node2vec + Network Features
TABLE
RANDOM
FOREST
V
PERFORMANCE
WITH
ADDITIONAL
Feature Representation
Accuracy
Precision
0.9025
0.7507
node2vec + Molecular Fingerprints
0.8411
0.8991
0.7567
node2vec + Network + Fingerprints
0.8400
0.8416
Recall
0.9034
0.7534
node2vec
node2vec+Network
node2vec+Fingerprints
node2vec+Network+Fingerprints
0.2 +
FEATURES
node2vec + Network Features
0.4 4
Fi
Score
0.8196
0.0 -
0.8218
Accuracy
Precision
Recall
F1 Score
0.8216
Fig. 3. Results from random forest using various embeddings and
additional features
2) Additional Network Features
We added network features from the original
disease-drug network to our node embeddings to
compare performance and evaluate the effect of
these features on predicting links. Based on the
findings, we see that adding these additional network features increases the classification performance as expected (see Tables IV and V and
Fig. 2 and 3). Adding more information about the
network, especially the structural roles as features,
provides a stronger understanding of relationships
between drug and disease.
3) Molecular Fingerprint Based Features
We incorporated molecular fingerprint features
capturing molecular structure as well as features from drug-drug networks derived from these
molecular fingerprints and evaluating the effect on
Logistic
Regression
scores
by method
and
metric
0.8 +
0.6 +
node2vec
node2vec+Network
node2vec+Fingerprints
node2vec+Network+Fingerprints
0.2 3
0.0 ~
Accuracy
Precision
Recall
F1 Score
Fig. 2. Results from logistic regression using various embeddings
and additional features
performance of add these features.
As expected, adding the fingerprints improved
the classification performance between these features are based on molecular structure (see Tables
IV and V and Fig. 2 and 3). Using outside information to better predict drug-disease interactions
can only help our naive prediction.
4) Combined Network and Molecular Fingerprint Based Features
Combining these two features produced the best
performance (see Tables IV and V and Fig. 2 and
3). Individually adding these features improved
classification, so the combined additional informa-
tion should yield the highest performance gain.
5) Analysis of Selected Examples
To analyze the predictions of our models, we
looked at one case where our model correctly
predicted a positive association and one case where
our model incorrectly predicted a positive association between a drug and disease not known to be
linked.
Our model correctly classified a positive link
between hypertrophic cardiomyopathy, a condition
in which the heart muscle becomes abnormally
thick, and the drug choline. There is a known
association between the pair as choline can be used
for cholesterol metabolism.
On the other hand, our model incorrectly predicted
a link between
the
disease,
lithiasis,
and
the drug, taurine. Lithiasis is a condition characterized by the formation of calculi and concretions
(colloquially described as stones) in the hollow
organs or ducts of the body. They occur most
often in the gallbladder, kidney, and lower urinary
tract. Taurine is a drug known to inhibit gallstone
formation, and thus it makes sense to assume that it
might apply to lithiasis as well given the diseases’
similar natures.
VI.
CONCLUSION
We have demonstrated a comprehensive approach to predicting links in the bipartitie drugdisease network domain. Simple proximity prediction methods did not perform well on predicting
links so we attempted to use feature learning to
represent nodes as feature vectors and machine
learning methods to predict links as a classification
problem. We experimented with various feature
representations including node2vec embeddings,
recursive network features, and molecular fingerprints. The combination of these features allowed
us to incorporate both associations between drugs
and diseases as well as the molecular and chemical
properties of drugs. Ultimately, this allowed us to
achieve high performance on predicting associations between drugs and diseases which potentially
has high impact for drug development by reducing research costs through re-purposing of known
drugs.
VII.
FUTURE
WORK
Potential extensions to our projects could include enhancing or trying different feature embeddings. For network embeddings, different embeddings could be experimented with rather than
using node2vec. Additional network features could
be incorporated based on node centrality or influence measures. To extend our knowledge-based
features, information about diseases could be captured in a manner similar to molecular fingerprints
for drugs. Additionally, external network features
between drugs and diseases incorporating other
biological associations such as with proteins can
be used, such as in [3]. Finally, additional models
could be used to classify nodes beyond the logistic
regression and random forest models we used.
VIII.
CODE
Our code and data can be found at https:
//github.com/cvo9/CS224W-Project.
REFERENCES
[1]
Kunegis,
Jrme,
Ernesto
W.
De
Luca,
and
Sahin
Albayrak.
*The link prediction problem in bipartite networks.” International Conference on Information Processing and Management
of Uncertainty in Knowledge-based Systems. Springer, Berlin,
Heidelberg, 2010.
[2] Al Hasan, Mohammad, et al. ’Link prediction using supervised
learning.” SDMO06: workshop on link analysis, counter-terrorism
and security. 2006.
[3] Oh, Min, et al. "A Network-Based Classification Model for
Deriving Novel Drug-Disease Associations and Assessing Their
Molecular Actions.” PLOS ONE. 2014.
[4] Vilar, Santiago, et al. ’Drug-Drug Interaction Through Molecular Structure Similarity Analysis.” Journal of the American
Medical Informatics Association. 2012.
[5]
L.
Backstrom
and
J.
Leskovec.
Supervised
random
walks:
Predicting and recommending links in social networks. In Proceedings of the Fourth ACM International Conference on Web
Search and Data Mining, WSDM
11, pages 635644, New
York,
NY, USA, 2011. ACM.
[6] D. Liben-Nowell and J. Kleinberg. The link-prediction problem
for
social
networks.
58(7):10191031, May 2007.
[7]
J.
Am.
Soc.
Inf.
Sci.
Technol.,
Grover, Aditya, and Jure Leskovec. ’node2vec: Scalable feature
learning for networks.” Proceedings of the 22nd ACM SIGKDD
international conference on Knowledge discovery and data mining. ACM, 2016.
[8] Y. Yamanishi. Supervised bipartite graph inference. In NIPS,
D. Koller, D. Schuurmans,
Press, 2008, pp.
18411848.
Y. Bengio,
and L. Bottou, Eds. MIT