Cs224W 2018 33
Bạn đang xem bản rút gọn của tài liệu. Xem và tải ngay bản đầy đủ của tài liệu tại đây (7.15 MB, 11 trang )
N-GRAM
GRAPHS
FOR
TOPIC
EXTRACTION
IN
EDUCATIONAL
FORUMS
Glenn Davis; Cindy Wang*& Christina Yuan*
{gmdavis,
1
ciwang,
cjyuan}@stanford.edu
INTRODUCTION
Online discussion forums are useful tools for supplementing both online and in-person learning because they give
students an opportunity to ask questions to instructors remotely and discuss class topics amongst their peers. While
useful, these tools remain lacking in terms of both the efficiency of information propagation and how they can be interpreted by instructors to better understanding student learning. Specific issues include that topics for each post typically
must be assigned manually by participants or moderators, topic search is more or less limited to string matching, and
that meta-scale metrics on forums and communities are not readily available. Thus, despite the scalability of delivering
instruction through online courses such as MOOCs (massive open online courses), monitoring and using discussion
forums effectively does not scale; rather, instructors and course staff must manually keep track of the forums and
attempt to gauge student interest and/or difficulty with course topics.
The structure of these forums, which contain various connected entities such as questions, answers, users, and topics,
lend themselves naturally to graph representations. We can construct these using standard discussion forum data
such as the text of the posts and participant and post information. Specifically, this project focuses on using graph
constructions of online discussion forums to create methods to answer two research questions:
e What are the most central topics of discussion within the forum?
e To what categories/topics do individual discussions and posts belong?
To answer these questions, we introduce a new method for creating n-gram based graphs that contain nodes representing n-gram tokens taken from post bodies that can be connected to nodes representing users and posts. This graph
construction allows us to model the relationship between the contents of each specific post and the greater overall
environment of the discussion forum, including related posts and users. We then use centrality methods on this graph
to find the most important topics being discussed in the forum and use graph clustering methods to find communities
of posts discussing similar content.
2
2.1
PRIOR WORK
GRAPH-BASED
METHODS
FOR
EDUCATIONAL
FORUM
Bihani & Paepcke (2018) used network measures from
sifying forum participation credit. They extracted four
nodes and actions (e.g. upvotes, endorsements) as the
as features for their classifier. They also apply transfer
Piazza domain.
ANALYSIS
Piazza and StackExchange as features for automatically clasdifferent graphs from Piazza using forum participants as the
edges, then calculated degree centrality and PageRank to use
learning from the richer StackExchange dataset to the smaller
Jiang et al. (2014) applied social network analysis to discussion forums from two MOOCs (massive open online
courses) to analyze whether centrality metrics are associated with course performance. They created a similar network
to that of Bihani
&
Paepcke
(2018),
with
students
as nodes
and actions
as edges,
then examined
the correlation
between centrality metrics and grade outcomes. For one MOOC, node-level degree and betweenness was found to be
significantly correlated with higher grade outcomes.
Both approaches give good baseline methods for graph extraction from forum data, including StackExchange which
we use in this work. However, the network measures that they extract are fairly limited and focused on participant
centrality. We build on their work to explore extraction of more complex relationships and different entities as nodes.
“equal contributions
2.2
TEXTUAL
UNIT GRAPHS
Textual unit (e.g., words, n-grams, sentences) graphs have been applied to classic natural language processing problems such as summarization, word sense disambiguation, and sentiment analysis. The benefit of such applications is
that large benchmark datasets for evaluation already exist.
Erkan & Radev (2004) introduced a stochastic graph-based method to compute relative importance of sentences for
extractive summarization. Their approach, LexRank, involves first computing modified sentence cosine similarity.
This forms the adjacency matrix for the sentence similarity graph, which is undirected and can have either discrete
or continuous edge weights. The power method can then be used to calculate PageRank scores for this graph — the
resulting measure is called lexical PageRank, or LexRank.
Sinha & Mihalcea (2007) generalized the methods from Erkan & Radev (2004) and present robust comparative evaluation of different edge weight schemes and centrality measures, applied to word sense disambiguation. They present an
unsupervised algorithm that constructs a graph given a sequence of words and possible labels (word senses) for each
word, where the vertices are labels and the edge weights are dependency scores between word senses. Once the graph
is constructed, scores are assigned to vertices using graph-based centrality measures to determine the most likely set
of labels for the sequence.
These papers contributed the simple, but useful idea that textual unit similarity can be used as edges to create a
graphical representation of a body of text. We use this idea to motivate our construction of n-gram graphs.
3.
DATASET
We use the StackExchange dataset publicly available at https: //archive.org/details/stackexchange.
This dataset includes all user-contributed content from over 150 StackExchange sites, with detailed information about
user interactions, including timestamps and history information. The dataset includes eight tables: Badges, Comments,
PostHistory, PostLinks, Posts, Tags, Users, Votes. We use the Posts table for our analysis. The relevant columns in the
Posts table used in our analysis are Body (the body text of a post), Id (the ID number of a post), and OwnerUserld (the
ID number of the user who made the post).
We focus on two StackExchange subdomains, Academia and Statistics (referred to from here as Stats). Academia
provides a moderately-sized dataset for local CPU computation. The Stats subdomain provides a more focused and
pedagogical approach for our problems, as it is larger and more heterogeneous in both user expertise and topic distribution. However, as the Stats subdomain was too large to compute locally, we extracted the most recent 20,000 posts
included in the dataset, which spans from 2017-12-07 to 2018-05-05. We summarize the data in Table 1.
Subdomain
Posts
Users
Academia
81,906
18,640
Stats
19,725
9,094
Table 1: Summary of StackExchange data.
4
GRAPH
CONSTRUCTION
We create two different n-gram based graph constructions to model our two research questions: 1) What are the most
central topics of discussion within the forum? 2) What categories/topics do individual discussions and posts belong
to?
To address our first question, we model discussion forum data using an N-gram Graph, where relationships between
n-grams are defined by which user nodes use these n-grams in posts. To address our second question, we create a Post
Graph, where relationship between post nodes are defined by containing similar n-grams in the text body. In later
sections of our paper we discuss graph analysis algorithms that run on top of these two graphs to answer our research
questions. The specifics of the graphs are defined below.
4.1
PREPROCESSING
Since both our graphs are n-gram based, we pre-processed the StackExchange post data to extract the top n-grams
for each post. We call these top n-grams “top terms.” To generate these top terms for each post, we use Tf-idf (term
frequency-inverse document frequency) weighting over all the n-grams in each post body. This weighting assigns
higher importance to terms in each post based on frequency of the term in the post and the scarcity of the term in the
other post. We treat these top Tf-idf weighted n-grams as a representative of capturing the main topic of discussion
within the post body. Specifically, we represent the contents of each post by the top five top terms. For both the
N-gram Graph and the Post Graph, we create a node for each of the five top terms for each post. Note that each unique
top term n-gram can appear as the top term for multiple posts, and only a single top term node will be created for this
n-gram for all posts.
For the n-gram graphs created using StackExchange data from the Academia subdomain, we represent each post by the
five most important unigrams, which extracts terms such as “publish”, “mentor”, and “student”.
However, we found
that unigrams were not sufficient to capture important topics of discussion of each post in the Statistics subdomain, as
many technical terms are more than one word in length. Thus, for the Statistics subdomain, we instead computed the
top terms for each post using the Tf-idf scores over both unigrams and bigrams, allowing us to extract top terms such
as “bonferroni correction”,3> 66. “mean”, and “probability measures”.
4.2
N-GRAM
GRAPH
To create the N-gram Graph used to model the most important topics addressed in the thread, we first modeled the
StackExchange data as a bipartite graph. We created n-gram nodes for the top terms of each post as described above.
Then, we created a user-id node for each unique author. Then, an edge is drawn between each user node and the top
term n-gram nodes for each of their posts. We call this bipartite graph the User ++ N-gram Bipartite Graph. This
graph captures the relationship between each StackExchange user and the contents of their posts.
Using the User ++ N-gram Bipartite Graph, we then use graph folding to create the N-gram Graph containing only
n-gram nodes. N-gram nodes are connected if they share an edge to the same user node. This yields a text unit
graph similar to the ones constructed in Erkan & Radev (2004) and Sinha & Mihalcea (2007), except we use network
interactions instead of similarity scores as the edges. In the N-gram Graph, n-gram nodes that that appear in posts by
multiple users will have an edge between them. Thus, n-gram nodes corresponding to n-grams that are discussed by
lots of different users will have a high degree. With the N-gram Graph, we can calculate centrality measures such as
PageRank and Hubs and Authorities to identify important n-grams in our network. We can then treat these top n-grams
as the most important topics. Applied to this domain, we can then rank the topics that are being discussed the most on
StackExchange. We apply this procedure to create both an Academia N-gram Graph and a Stats N-gram graph.
4.3.
POST < N-GRAM
BIPARTITE GRAPH,
POST GRAPH
To create the Post Graph used to determine similarity between posts based on topic, we once again first model the
StackExchange data as a bipartite graph. We create n-gram nodes for the top terms for each post. Then we create a
post node for each of the StackExchange posts. Each post is then connected to the n-gram nodes corresponding to the
top terms that were computed for the post body. This graph is called the Post <+ N-gram Bipartite Graph.
Using the Post ++ N-gram Bipartite Graph, we fold the graph to create the Post Graph. To fold the graph, we connected
two post nodes if they both have edges to the same n-gram node. In this graph, post nodes are connected by an edge if
they share the same top terms. Using the Post Graph, we can use clustering methods such as Clauset-Newman-Moore
and spectral clustering to cluster the post-id nodes into communities determined by their topic. These clustering
methods are described in more depth in subsequent sections. From this clustering, we group posts by their relevant
topics. We apply this procedure to create both an Academia Post Graph and a Stats Post graph.
|
Graph
Academia
Nodes
Fdges
Nodes with
degree 0
to
«+ N-gram | 69765
ipartite
347084
0
i «+ N-gram | 156.031
ipartite
N-gram folded | 44,125
Post folded
81,906
409,530
46,984,357
55,029,806
0
0
61
Stats
Nodes with
degree > 10
9,066
5,776
38,783
81,500
Nodes with
Nodes
Edges
66,086
95,267
0
76,717
56,992
19,725
98,625
3,674,828
567,729
0
0
2,586
Table 2: Summary statistics for bipartite and folded graphs.
degree 0
Nodes with
degree > 10
2,308
1,038
32,718
14,632
5
5.1
GRAPH
OVERVIEW
SUMMARY
STATISTICS
Table 2 contains node and edge statistics for the graphs we created from the StackExchange data. We can see that the
Academia graphs are much denser than the Stats graphs before and after folding. Moreover, although there are fewer
posts in the Stats graphs, there are more topics discussed, suggesting that the Stats subdomain is more suitable for
topic clustering.
5.1.1
DEGREE
DISTRIBUTION
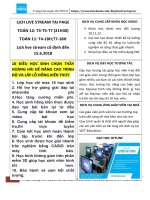
In Figure 1, we include the degree distributions of our created StackOverflow graphs. For the bipartite graphs, we
can see that the distributions are right skewed indicating that there are more nodes in the bipartite graphs with a high
degree. For our folded graphs, we can see that that are many more nodes with high degree.
The degree distributions of the Academia bipartite graphs are similar to the Erdos-Renyi random graph. The analogous
Stats graphs are closer to a power law distribution, but do show a spike in proportion of nodes that have the median
degree.
Degree Distribution of Bipartite and Folded Graphs - Academia
Proportion of Nodes with a Given Degree
User <>
Ngram
---
Folded Ngram
—
Post <>
---
Folded Post Graph
Ngram
Graph
Bipartite Graph
10-3
10-5
10°
101
102
Node Degree (log)
10°
Degree Distribution of Bipartite and Folded Graphs - Stats
Bipartite Graph
(log)
——
Proportion of Nodes with a Given Degree
1
(log)
10
101
——
User <>
Ngram
Bipartite Graph
---
Folded Ngram
—
Post <>
Graph
---
Folded Post Graph
Ngram
Bipartite Graph
10-3
10-4
10-5
104
10°
101
102
Node Degree (log)
103
10
Figure 1: Degree distribution of StackExchange Graphs.
6
6.1
6.1.1
EXPERIMENTS
CENTRALITY:
IDENTIFYING
TOP TOPICS
PAGERANK
PageRank, Brin & Page (1998), is an algorithm used to rank nodes in a graph by importance. It treats edges as votes
and considers each node to be more important if it has many neighbors. Furthermore, it captures the idea that a “vote”
from an important node is worth more, and each edge’s vote is proportional to the importance of the source of its page.
The expression for PageRank of node 7 is given by
T7
—
»
T¡
4(,—
6)
8 đ; + (
1
8) Đồ
Ij
where (3 is the probability that we follow an edge at random, 1 — £ is the probability of going to some random node in
the graph, and d; is the degree of node 7.
6.1.2
HUBS
AND AUTHORITIES
Hubs and Authorities, Kleinberg (1999), also called Hyperlink-Induced Topic Search (HITS), is an algorithm used to
estimate the value of node content and the value of links to other pages . These are respectively calculated for each
node as its hub and authority scores.
Authority and hub values are defined via mutual recursion. That is, the algorithm iteratively updates each node’s hub
score to be equal to the sum of the authority scores of each node to which it points, and its authority score to be equal
to the sum of the hub scores of each node to which it points.
For our experiments, we used the SNAP implementation of the hubs and authorities algorithm and ran it on the User
+» N-gram bipartite graph for each of our subdomains. We observed that in this bipartite graph formulation of an
online forum, the n-grams and users are analogous to hub and authority pages on the web. That is, we can approximate
the value of a user node in this graph via its links (the topics they discuss), while we can approximate the value of an
n-gram node via its content (the topic importance).
6.1.3.
RESULTS
Top topics
We used PageRank and hub scores as described above to rank the centrality of all n-gram nodes. We then identified
the most central nodes as top topics of discussion in each forum. The top ten nodes by PageRank (run on the folded
Ngram graph) and hub score (run on the User ++ N-gram bipartite graph) are shown in Table 3. Qualitatively, our
results show that both centrality measures give reasonable topics, and that there is a high degree of overlap between
the topics found using graph centrality.
Furthermore, our results validate our formulation of users and n-grams as hubs and authorities of the StackExchange
network. The nodes with top authority scores are all users, and the nodes with top hub scores are all n-grams, with the
exception of a few superusers.!
Academia
Tag (Count)
Stats
| PageRank
| Hub score
Tag (Count)
| PageRank
| Hub score
publications (4230)
paper
user75368
r (19446)
distribution | user8013
phd (3728)
student
user53
regression (17253)
test
research process (1713)
research
review
time series (8964)
author
professor
logistic (4892)
graduate admissions (2914) | phd
graduate school (1536)
citations (1508)
thesis (1358)
journals (1301)
paper
machine learning (11570) | model
journal
student
review
author
professor | journal
work
supervisor
mathematics (1273)
peer review (1263)
letter
probability (6912)
hypothesis testing (5952) |
self study (5785)
distributions (5735)
research
matrix
time
correlation
variance
probability |
sample
classification (454)
series
user 173082
distribution
model
test
time
probability
sample
correlation
variance
Table 3: Top ten topics by PageRank and hub score.
We also show the top ten tags by count of number of posts as a reference for which topics are generally important.
While these are a good source of distant supervision for the topics we aim to extract, they cannot be treated as ground
truth for two reasons. Firstly, topic names do not necessarily reflect the actual n-grams used to discuss concepts within
the topics. For instance, while “graduate admissions” is a popular tag, this bigram is too general for individual posts,
which discuss specific aspects within graduate admissions. Secondly, tag names may not match the language actually
used by users in posts. For example, the top tag is “publications”, but the top n-gram identified by our graph centrality
methods is “paper” since users tend to refer to publications as papers.
|
Academia
Stats
Exact match
Sample size | Recall
%Imp.
Unigram match
Recall
%Imp.
Exact match
Recall
%Imp.
Unigram match
Recall
% Imp.
10
50
100
250
0.090
0.147
0.150
0.189
0.100
0.120
0.1320
0.224
0.130
0219
0.291
0375
0.100
0.080
0.090
0.092
inf
100
inf
43.8
200
80.0
80.0
12.8
inf
200
225
229
200
23.1
60.9
50.0
Table 4: Results of validating topics identified using graph centrality against StackExchange tags. %
Imp. denotes the percent improvement in recall over selecting topics at random (infinity if random
recall is 0).
'We validated manually that the listed users are the users with the top StackExchange Reputation (numerical score based on
quality of contributions) over the time periods observed. These users also received the highest score when PageRank was run over
the bipartite graph.
Despite these caveats, there is indeed overlap between tags and identified n-grams, so it is possible to quantitatively
validate our topic extraction method by computing recall on tags. For k = 10,50, 100, 250, we computed the recall of
the top & n-grams identified via PageRank on the top k tags. We also computed the recall of unique unigrams within
the tag names, e.g. “research” matches “research process.” These results are shown in Table 4. We compared the recall
of our method to the baseline of selecting k n-grams at random and demonstrate substantial improvement of 12.8% to
229%.
This gives a good signal in the StackExchange dataset where labeled data is available, and suggests that graph-based
topic extraction would be effective in domains where accurate, fine-grained tag data is not available.
PageRank Over Time
ø
0.999
€S
Ẹ
a5
xš
s
©o
a
&s 0.997
—
——
~~
0.996
——
2012
2013
2014
PageRank Over Time
2015
Year
2016
2017
eo
°
°
2
—
2014
2015
2016
2017
coffe
write
typo
corrigendum
tricky
promises
lucki
PageRank Percentile
5
a
đ
PageRank Percentile
2
B
aâ
N
e
2013
work
journal
review
author
student
2018
PageRank
0.8}
2012
letter
_ professor
paper
research
Over Time
oper
ug
welcom
credit
franc
pseudonym
groups
saw
indicated
bologna
0.2
68
2018
2012
2013
2014
Year
2015
2016
2017
2018
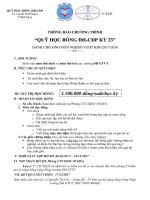
Figure 2: PageRank over time for overall top PageRank nodes (top), monotonically increasing words
(left), and random sample (right).
Topics over time
We also observed that topic importance is not static over time. To explore the degree to which this is true, we generated
N-gram graphs for the Academia subdomain? and visualized changes in PageRank over time of n-gram nodes.
For each n-gram, we calculated the PageRank percentile (percent of nodes for which a given node’s PageRank is
higher) and plotted the trajectory of topics over an eight year period (Figure 2). We highlight the following cases:
e Overall top PageRank nodes. The nodes with the top ten PageRank scores over the entire period do not show
significant oscillation in centrality. Their PageRank percentiles are consistently in the 0.996-1.000 range.
e Increasing PageRank nodes. Only seven nodes have monotonically increasing PageRank percentiles. These
indicate n-grams that have only increased in relative PageRank over the entire eight year period.
e Random nodes. We restrict random nodes to the set of n-grams that appear in every year from 2013-2018
as there are many n-grams that only appear in one year. With the exception of “credit,’ which is in a very
high PageRank percentile, other nodes oscillate widely in centrality from year to year. We postulate that for
the observed subdomain (Academia StackExchange), there is a “centrality threshold” which, when reached,
PageRank percentile holds approximately constant over time.
6.2
CLUSTERING:
GROUPING
POSTS BY TOPIC
We applied graph community detection methods to the Stats Post Graph to cluster communities by topic. To cluster
our graph, we use the Clauset-Newman-Moore algorithm and the K-Way Cut Normalized Cut Spectral Clustering
algorithm.
The Stats subdomain was prohibitively large for this task, though we expect that the results would be qualitatively different
from Academia. This is an interesting exploration for future work.
6.2.1
MODULARITY
Modularity measures how well the a given partitioning of nodes captures separate communities, as compared to a
graph with the same number of edges and nodes with random connections. Modularity score Q for an unweighted
graph can be calculated by the expression
a0 EEE (8)
s€S
1€s
jes
where m is the number of edges in graph G, s € S are groups in the partitioning S, 7 and j are nodes, k; and k; are
the degree of nodes 7 and j, A;; indicates whether i and j are connected.
6.2.2.
CLAUSET-NEWMAN-MOORE
(CNM)
The Clauset-Newman-Moore (CNM) algorithm (Clauset et al. (2004)) finds communities by greedily optimizing for
modularity. Starting with a partitioning of each individual node into its own community, the algorithm repeatedly joins
together the two communities that would cause the greatest increase in the modularity score Q, until n — 1 joins have
been conducted and all nodes belong to a single community. At this point, the algorithm returns the configuration
(with a number of communities between | and n — 1) that produces the highest modularity score.
6.2.3
SPECTRAL
CLUSTERING
The Normalized Cut Algorithm (Shi & Malik (2000)) is a spectral clustering method for partitioning nodes into communities based on the eigenvalues of the symmetric normalized Laplacian. The Normalized Cut Algorithm is used to
find a partition S of the nodes of the graph that gives the smallest normalized cut value: NCUTS
= TU
+ ste
Let A be the adjacency matrix of the graph, where A;; = 1 if (i,7) € E and equal to 0 otherwise and D be the
diagonal matrix of degrees where Dji = >> ý 4¿; = the degrees of node i. Then we define the graph Laplacian as
L = D — A. Below is a formulation of the Normalized Cut Algorithm with the “relax and round” technique:
_
a Le
zen x? Dex
subject to x7 De = 0,27 Dx = 2m
The minimizer of this is x = D~‘/?v where V is the eigenvector corresponding to the second smallest eigenvalue of
the normalized graph Laplacian L = D~!/?L.D~‘/2. To round the solution back to a feasible point for the original
problem, we can take the indices of all positive entries of the eigenvector to be the set S' and the indicies of the negative
entries to be S.
To partition the graph into / > 2 clusters, use the Simultaneous K-Way Cut with Multiple Eigenvectors modification
to the Normalized Cut Algorithm from Shi & Malik (2000). In this modification, to create a clustering with k communities, we take k eigenvectors from the normalized graph Laplacian associated with the top k eigenvalues and use
this to create a reduced space representing the nodes. Now each node is represented by & numbers, one value taken
lữ
“
Size of communities generated by CNM
lữ
103
“
Cy
CG
Size of communities generated by spectral clustering
103
Cy
CG
e
e
8 1œ
8 1œ
v
2
v
2
Ề
Ề
2
2
101
109
101
T
0
T
10
T
20
T
T
30
40
Community number
T
50
T
60
109
T
0
T
20
40
T
T
T
T
60
80
100
Community number
T
120
T
140
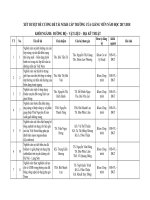
Figure 3: Relative sizes of communities generated by CNM (left) and spectral clustering (right).
.
density| norm
test| training | validation
series | time | group
matrix|model| variables
feature|dataset|value
» network|cost| event
distribution |normal distribution |
probability
4 F distribution| sample | probability
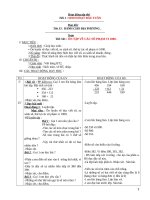
Figure 4: Visualizations of communities generated by CNM
Labels indicate communities with >1% of total nodes.
(left) and spectral clustering (right).
from each eigenvector. We can then use this new reduced space representation of each of the nodes to cluster into k
communities using the k-means algorithm.
To find the optimal number of communities k, we did a search of values of k from 10 to 1000 and computed the mod-
ularity score of the communities found for each k value. We selected the k value that gave us the highest modularity
score.
6.2.4
RESULTS
We ran CNM and Normalized Cut Spectral Clustering on the Stats Post Graph to cluster posts into communities based
on similar topics of discussion. Below we include our findings of the communities found using our two methods.
Modularity and Number of Communities
Table 5 reports basic descriptive statistics for the partitions generated by the two algorithms. Notably, both algorithms
generate community partitions with a modularity score above 0.3, indicating that significant community structure can
be detected in our graph (Clauset et al. (2004)). Spectral clustering produced an optimal partitioning with a larger
number of communities and higher modularity score.
Algorithm
CNM
Spectral clustering
| #Communities
66
150
Modularity
0.442
0.550
Table 5: Descriptive statistics for community partitions generated by CNM and spectral clustering
Community Sizes
Figure 3 shows the relative size of the communities generated by both clustering algorithms, where communities are
numbered by descending size (Community | is the largest, community 2 is the second-largest, etc.). From this able we
can see that CNM finds a few large communities and many small communities, while Spectral Clustering finds a less
very large communities than CNM, mostly medium sized communities, and a few small communities. Table 6 shows
the percentage of nodes in the largest communities found by each clustering algorithm. From this we can see CNM
finds four large communities, each with between ~10-30% of total nodes, and all other communities contain <1%
of
the nodes. Spectral clustering finds only one large community that contains 42.30% of the nodes, and more medium
sized communities with around 1% of the nodes.
CNM
Spectral clustering
Community (top terms)
Percentage of
total nodes
Community (top terms)
Percentage of
total nodes
series | times | group
test | training | validation
distribution | sample | probability
matrix | model | variables
size | power | uncertainty
learning | rate | minutes
27.09%
23.88%
20.43%
11.68%
0.81%
0.64%
feature | dataset | value
density | normal | parameter
training | validation | data
network | cost | event
series | time | time series
sample | population | mean
42.30%
5.26%
1.53%
1.25%
1.13%
1.06%
outliers | bias | percentile
0.49%
CIRH ĐHHỢN | aiqrmg)
distribution | probability
1.04%
Table 6: Largest communities generated by CNM and spectral clustering
Proportion of posts in which a specific top
term Is present
Proportion of posts in which a specific top term is present
CNM community 'learning|rate|minutes'
Spectral clustering community ‘learning|deep learning|rate’
0.40
+e
035
# 030
§
8
5 025
c
8Ẹ 020
°
8 015
a
5 06
=
8°S
g o4
a
0.10
ẹ
=
š
Ể
H8
&
€
2
E
3
x8
8
00
2
Ẽ
5
Ø
&
ẽ
machine learning
Ẹ
E
8
1
learning
ặ
Đ
đ
5
deep
2
#
E58
machine learning
0.00
learning
02
0.05
deep
Gy
08
2
c
2=
3
š
€£
§E
8
8
bè
5
P
B
65
3
šE
§
Figure 5: Relative sizes of communities generated by CNM (left) and spectral clustering (right).
Community Topics
We represent each community found in the Statistics StackExchange dataset by the three most frequent top terms
for posts in the community. We can treat these three most frequent top terms as being representative of the topic
of discussion of posts within each community since they appear in the greatest number of posts. Table 6 shows the
largest communities generated by both clustering algorithms, and the representative terms for each community. From
looking at the three most frequent top terms for the posts in the largest communities, we can see that the most frequent
terms that appear in each community are mostly related to one another. For instance, the second largest community
found by CNM has the three most frequent top terms “test, training, validation” indicating that this is a community
of posts discussing dataset splitting. The second largest community found by spectral clustering is represented by
the most frequent top terms “density, normal, parameter”, which suggests that posts in this community are discussing
probability distributions.
Figure 4 shows visualizations of the Stats Post Graph with colors representing the different communities. All communities that represent >1% of total nodes are labeled in the figure; note that CNM only finds four such communities
whereas spectral clustering finds eight.
Qualitative Example: “Learning” Communities
To demonstrate the viability of our
and spectral clustering. For CNM,
(127 nodes, 0.65% of total nodes),
nodes, 0.37% of total nodes). These
by nodes in the spectral clustering
clustering is finding a more focused
clustering approaches, we compare similar communities generated by both CNM
we examine the community represented by the terms “learning | rate | minutes”
and for spectral clustering, the community “learning | deep learning | rate” (73
two communities have significant overlap: 53 of the 73 posts (72.6%) represented
community are also included in the CNM community, suggesting that spectral
subset of posts.
CNM
‘learning | rate | minutes” Community
Spectral “learning | deep learning | rate’ Community
Term 1
Term 2
Term 3
Term 4
texts
author
learning
author
texts
berger
extremely
deep
non information
ordinate
elbow
.
learning
able
technologies
.
.
build ships
texts
author
deep
learning
bus
outs
process
learning
.
hardness
learning
Le
principled
.
science
d
:
policy
d
1 SP
earning
2
multilayer
policy
methods
methods
:
;
sutton
bano
Term 5
;
Term 1
architecture
5
learni
eae
algorithm
:
learning
:
;
hardness
Term 2
Term 3
Term 4
Term 5
teinforcement
learning
reinforcement
learning
24x24
Ib
bearded
point
drops
I
von
ordinate
bs
.
learning
havi
avn
seen
deep
learning
author texts
berger
extremely
‘
long
minutes
deep
:
.
non informative
Table 7: Top terms for 5 randomly sampled posts from CNM and spectral clustering “deep learning”
communities
Figure 5 shows the proportion of posts in each community that contain a specific term among the five “top terms” for
that post. Spectral clustering generates a “tighter” clustering of posts that share more top terms. Notably, 100% of
nodes in the spectral clustering community contain “learning” as a top term, whereas only about 40% of the nodes
in the CNM community contain “learning” as a top term. Table 7 shows the top terms for 5 randomly sampled posts
within the communities. From this table, we can see that top n-grams by #f-idf score for these 5 randomly sampled
posts are related to the community topic of learning. This gives us evidence that our method for clustering using our
Post Graph is effective for grouping posts into communities discussing similar topics.
CNM versus Spectral Clustering
After comparing the communities found by Spectral and CNM
clustering methods, we find that spectral clustering
creates a larger number of communities (150 vs. 66), a higher modularity score (0.550 vs. 0.442), and more cohesive
communities of smaller size. Thus, we conclude that spectral clustering is more effective at extracting clusters of posts
about similar important topics for an educational discussion forum.
7
CONCLUSIONS
We demonstrate that graph methods for computing centrality and clustering can be used to extract important topics and
users from an online education-focused discussion forum. As our methods use only the post body text, user ID, and
post ID from each post in a discussion forum, these techniques can be easily applied to any other education-focused
discussion forum that lacks user-generated metadata about user and topic importance (tags, “reputation”, votes, etc.).
We can easily imagine an instructor-facing interface that incorporates these tools, allowing for at-a-glance summaries
of important and popular topics. We showed that n-gram graph centrality is a strong indicator of topic importance in a
forum and validated it used existing metadata. We also showed that applying clustering methods to a post graph yields
large communities of posts, and applying post-processing to these communities reveals frequently discussed topics.
Applying our methods across narrow time slices of the discussion forum would allow for the instructor to identify
topics that require immediate clarification in real time, while applying them to a past (archived) offering of the course
would highlight important topics for syllabus revision purposes. Automatically identified topics can also be used to
bootstrap post tagging and search functionalities.
Furthermore, identifying clusters of posts about similar topics allows for automatic link generation between posts
within these clusters, and automatic propagation of instructor interventions to all interested parties. Search functionality for both instructors and learners could also be improved through these clusters.
Finally, though n-gram centrality was most salient for the domains we studied, we could similarly compute graph
centrality to other entities, such as users and posts. Such methods can be applied to discussion forums that lack a builtin reputation or point system (in StackExchange, user “reputation” and post “votes”), and instructors could use this
information to identify potential teaching assistants or moderators, or to allocate course participation grades (Bihani
& Paepcke (2018)).
REFERENCES
Ankita Bihani and Andreas Paepcke. QuanTyler: Apportioning credit for student forum participation. In Kristy Elizabeth Boyer and Michael Yudelson (eds.), EDM 2018: Proceedings of the 11th international conference on educational data mining, pp. 106-115, Buffalo, NY, 2018.
10
Sergey Brin and Lawrence Page. The anatomy of a large-scale hypertextual web search engine.
and ISDN systems, 30(1-7):107—117, 1998.
Computer networks
Aaron Clauset, M. E. J. Newman, and Cristopher Moore. Finding community structure in very large networks. Physical Review E, 70(6), 2004. doi: />Giines Erkan and Dragomir R. Radev. Lexrank: Graph-based lexical centrality as salience in text summarization.
Journal of Artificial Intelligence Research, 22:457-479, 2004.
Suhang Jiang, Sean M. Fitzhugh, and Mark Warschauer.
Workshop Proceedings, volume
Jon M Kleinberg.
1183, pp. 55-58, 2014.
Social positioning and performance in MOOCs.
In CEUR
Hubs, authorities, and communities. ACM computing surveys (CSUR), 31(4es):5, 1999.
Jianbo Shi and Jitendra Malik. Normalized cuts and image segmentation. IEEE Transactions on pattern analysis and
machine intelligence, 22(8):888—905, 2000.
Ravi Sinha and Rada Mihalcea. Unsupervised graph-basedword sense disambiguation using measures of word semantic similarity. In ICSC 2007. International Conference on Semantic Computing, pp. 363-369. IEEE, 2007.
ADDENDA
GitHub repository: https: //github.com/ciwang/224w-education-graphs
Contributions:
e Glenn Davis
Extracting top terms (tf-idf), visualizations, CNM clustering
e Cindy Wang
Raw XML parsing, graph folding, topic centrality (PageRank, HITS, tag validation, topics over time)
e Christina Yuan
Constructing N-gram ¢+ Post/User bipartite graphs, implementing Simultaneous K-Way Cut with Eigenvectors spectral clustering
e Equal contributions
Writing, analysis, interpretation
We all agree and feel like all team members contributed equally to the project ©
II