Cs224W 2018 59
Bạn đang xem bản rút gọn của tài liệu. Xem và tải ngay bản đầy đủ của tài liệu tại đây (7.54 MB, 13 trang )
Resilient Agriculture: Examining the Robustness of Trade Networks
Brian Reed
CS224W Report!
Abstract
We use a network approach to examine the robustness of global networks of trade, focusing
here on how trade of some of the most and, separately, least water-intensive crops has
fluctuated from 1995 - 2016. We first provide basic descriptive statistics on the networks
for each good. We then adapt a measure of Shannon’s Diversity index to track the macrostructure of our trade network. We find that the structure of the networks for the most
water-intensive goods remains relatively constant over time. We then regress characteristics
of the trade networks on the water content of the goods, and we find that the water intensity
of the good is positively related with the diversity metric of its trade network, potentially
allowing them to better withstand localized shocks.
1.
Introduction
We investigate how resource constraints may shape networks of trade. Our initial goal is
to look at how droughts affect the structure of the networks of trade for five of the most water
intensive goods, as well as five of the least water intensive goods. However, after finding that
the macro-structure of the networks for the most water-intensive goods does not change over
time, even as precipitation and economic conditions fluctuate, we test whether the networks
for more water-intensive goods are optimized in a way that allows them to better respond
to fluctuations in production from major exporters.
This work is motivated by the fact that as the climate changes, droughts in particular parts of the world are expected to become more frequent and more severe. In order
to minimize economic disruptions, we will be wise to consider how nations that are more
drought-sensitive are situated within global exchange networks. By understanding these network connections, we may be able to minimize the effect of drought on a country’s trading
partners, and we may be able to reduce pressure on drought-prone nations to engage in
water-intensive land use practices, by identifying nations that might come under pressure to
make up for production shortfalls in other countries.
This paper may be one step towards developing models of the impacts of climate change
that account for connections, primarily trade, between different locations. In the climate
impacts literature, there is a gap between top-down macroeconomic models and bottom-up
microeconomic models. While the macroeconomic models try to capture broader economic
‘Template is from Elsevier; not actually submitted to Elsevier.
Git is https: //github.com/brianreed21/224w.git.
Preprint submitted to Elsevier
December 10, 2018
and demographic trends, the microeconomic literature tries to capture the social and economic impacts of these events on a specific place (see [6] for a summary). The microeconomic
models have an intuitive appeal because they focus on mechanisms and pathways by which
climate impacts local decisionmaking. However, they tend to treat local impacts as isolated,
even though local impacts can be mitigated or exacerbated by conditions in other places.
We proceed as follows. First, we describe three related papers.
Moser and Hart (2015)
helps to provide an overarching motivation for our line of inquiry. Acemoglu et al (2012),
helps build one mathematical framework for capturing the types of effects hypothesized by
Moser and Hart. Korniyenko et al (2017), focuses on implementing some of these ideas by
examining the stability of networks for different types of goods to supply shocks in specific
producer nations. Their paper serves as a starting point for our analysis here. We then
outline our data sources and provide initial summary statistics about the networks of interest
between 1995 and 2016. We look at (1) the major exporters each year, (2) the clustering
coefficients of the networks over time, comparing for each statistic the networks for the most
and least water-intensive goods, and (3) the relationship between nodes and edges on the
plot, to look at how the networks densify.
Next, we tweak the measure of Shannon’s Diversity used by [13] and look at how the
structures of the graph evolve over time. We see that the Shannon’s Diversity metric stays
relatively constant for the networks of water intensive goods. We then test the hypothesis
that networks of trade for crops may be optimized in a way that allows them to reallocate
production among major exporters in the face of resource shocks. We do this by regressing
the water intensity of 266 goods on the 20-year average Shannon’s Diversity metric of the
trade network for each good. We find preliminary evidence that more water intensive goods
are traded in more diverse networks.
1.1.
Environmental Conceptual Framework - “Teleconnections”
Moser and Hart [11] provide a “conceptual framework” to identify how processes that
occur in geographically distant places can make specific places more vulnerable to the effects
of climate change. They refer to these connections as “teleconnections,” borrowing a term
from climate science that refers to linked processes. They provide eight examples of societal
teleconnections: trade, insurance, energy systems, food systems, health, migration, communication, and strategic alliances and interactions. They identify three components that
are needed for a teleconnection to function: a natural or manmade structure to establish
a link, a reason for actors to use the link to interact, and some sort of object, physical or
otherwise, to pass over the connection. Within the context of trade, the structures are trade
and communication routes, the processes are market exchange, the substance is goods and
services, the actors are producers and consumers, and the institutions are a combination of
trade laws, tax laws, and norms.
While Moser and Hart identify a gap in the literature on the impacts of climate change
and to propose potential paths forward, the authors do little to draw connections between
different bodies of literature that are trying to study these processes. The authors came
tantalizingly close to using terms from the network science literature, without directly identifying this field as one that could make valuable contributions to the research projects they
are interested in. Further, in the trade space, they do not acknowledge integrated assessment
models that try to link together policy changes, economic growth, and land use, for instance.
1.2.
Economic
Conceptual Framework - Networks and Aggregate Fluctuations [1]
In recent years, network science has increasingly come into vogue in the economics literature, looking at everything from how people communicate across social networks ({5]) to
how the outbreak of a financial crisis can be modeled as a contagion ([4]). Here we focus on
Acemoglu et al (2012), which adopts a more macroeconomic perspective, as this aligns in
both scale and underlying data with the climate impacts we are interested in examining.
Acemoglu and his coauthors provide a mathematical framework for looking at the effect
of different shocks on an economy. Their main argument is that “aggregate volatility,” or
the standard deviation of economic output, declines at a rate slower than the previously
accepted ,/n, where n is the number of sectors in the economy. They say this is due to a
combination of “first order interconnections”, wherein a few sectors supply a large number
of other sectors, and “second order interconnections”, in which supply chains can transmit
productivity shocks across several edges. They prove 3 main theorems. First, they show that
high variation in the degree of different sectors leads to lower rates of decay in aggregate
volatility. Second, they show that the second order degrees of different sectors, weighted by
their value in trade, provide an upper bound on the rate of decay in total volatility. Third,
they show that if networks are balanced, with the same degree on every sector, the average
rate of decay is, in fact, ,/n. They apply their estimates using input-output data from the
Bureau of Economic Analysis, and find evidence to support their claims.
It is worth exploring whether the level of aggregation used in this paper masks any
underlying sectoral disparities that could otherwise help to explain the results surrounding
ageregate volatility. Acemoglu et al take the sector to be the fundamental building block
of an economy, as the nodes in their networks are these sectors. Sectors, however, are
themselves composed of firms and individuals, which organize themselves into networks as
well. It seems reasonable that a sector comprised of firms that arrange themselves into a
more balanced network, for instance, might itself help to absorb localized shocks.
1.2.1. Sample Implementation - Import Fragility [9]
Korniyenko et al (2017) take a much more empirical approach than either Acemoglu
or Moser and Hart. They use the BACI database to look at the structure of bilateral
trade networks in specific goods. They focus specifically on intermediate goods, under the
assumption that if a country sees a drop in their imports of intermediate goods, they will
have trouble producing any goods that use those goods as inputs, and they will export
fewer goods as a result. They develop a metric for the fragility of different goods based
on three metrics: the standard deviation of the fraction of each country’s exports over its
trading partners’ imports of that good; the weighted average local cluster coefficient times
the maximum distance between countries in the network; and the substitutability of products
themselves. Once they identify these goods, they identify which countries import the largest
shares of the fragile goods. To validate their metric, they conduct several case studies, and
they run a regression of export growth against share of goods in risky goods. They run
this regression twice,
once focusing on countries whose
major
trading partners
experience
a negative supply shock in a given year and once focusing on the same countries, with the
trading data from the year before the supply shock. They show that risky imports from the
impacted country has a negative effect on export growth, yet only at 10% significance.
This paper seems to be near the frontier of empirical networks-based papers in economics,
yet it is not without shortcomings. First, it is not clear why the authors do not run a panel
regression country-event interaction variable to capture the significance of the supply shock
while controlling for the base effect of a high level of imports of the risky good. Second, it
seems like they could do a more precise job of linking intermediate goods to the final goods
they contribute to, then run their regressions against exports of those final goods. This
would likely help to magnify their results.
2.
Data
We follow Korniyenko et al in using bilateral trade data from the BACI dataset, which
shows the value of imports and exports of specific goods on a national, annual level ([2]).
BACI is based on the UN’s COMTRADE data, but it is produced by the Centre d’tudes
Prospectives et d’Informations Internationales (CEPI), and it claims to extend the number
of countries in COMTRADE?’s data. This dataset runs from 1995-2016. We decided to use
this dataset, rather than the World Input Output dataset mentioned in the proposal, because
it allows us to focus on specific goods, while the Input Output dataset only goes down to
the level of specific industries (more on this below).?
We subset the BACI dataset to focus on crops. In our summary statistics below, we
subset the data to focus on five of the most and five of the least water intensive crops, as
per the Water Footprint Network’s dataset [10]. To identify these products, we look at the
global average green water consumption for all crops, as measured by the global average. A
subset of the most and least water-intensive crops are presented in Table 1 below. In our
regression at the end of this paper, we include the global average green water consumption
for 266 crops in the BACI dataset. We calculate network statistics using SNAP[17].
2.1.
Data Preparation & Sample Network
We subset the BACI trade data to focus on the most and least water intensive crops. For
each crop, we create a directed graph with edge weights corresponding to the value of trade,
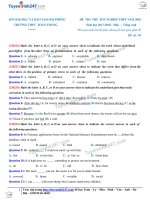
in dollars. Below is a sample depiction of one of these networks, for sesame oil in 1995, as
well as a table of descriptive statistics for the trading network for the 5 most and least water
intensive goods in 1995. Note that sesame is the 5th most water-intensive crop we examine.
We can see that Sudan is one of the biggest exports of sesame oil at this particular time.
Sudan has experienced horrendous civil conflicts over the last twenty years, so it is likely that
trade of this good looks very different today. The fact that Sudan dominates trade in this
good also provides a warning to consider factors other than just droughts when considering
changes in the structure of different networks over time. These civil conflicts, which may
or may not have had anything to do with drought, are likely the predominant factors that
influence economic activity in the the country over the last 20 or so years.
?We initially began to work with the WIO data, but we realized that did not allow us to tell much of a
story, as this dataset only has information on value of goods traded from economic sectors in one country
to economic sectors in another country, which masks significant variation in terms of actual goods, place in
the value chain, etc. It would be interesting to use the WIO data in a future project, however, as it allows
for a richer picture of the global production network.
omatoes
Table 1: Most and least intensive crops by amount of green water consumed in production.
statistics are provided for the networks as well, focusing on the 1995 instance of the network.
Descriptive
Data table
generated using using data from the Water Footprint network.
Figure 1: Global trade in sesame oil in 1995. Size of the node labels corresponds to total value of imports and
exports of the good. Colors of the edges correspond to the target node. The direction of trade is clockwise
across the curved edges, so that, in particular, Sudan (SDN) is one of the largest exporters in the world.
Generated in Gephi.
3.
Network
Characteristics
Given that we aim to
only detail a handful of
more complete analysis.
include the statistics for
3.1.
describe trends in the networks for 10 goods over 20 years, we here
metrics, though we discuss other ones that could be included in a
We focus on the statistics for the most water-intensive goods and
the least water-intensive goods as a control.
Micro Characteristics: Major Exporters
First, we look at the normalized weighted outdegree by year, in Figure 2. Focusing on
the left hand column, ie the graphs for the most water intensive goods, we can see several
key takeaways. The first one is that the graphs are noisy: the main exporters fluctuate each
year, and it is rare to see one specific country dominate production for the entire time period.
This is particularly interesting in light of a finding we will elaborate on below, which is that
an entropy metric of the graph stays relatively constant over time.
Further, we see that it is rare for any individual country to account for more than 30-40%
of exports, specifically among the water intensive goods. The exceptions here are a one-year
spike in production of vanilla beans in Indonesia that corresponds with a drop in production
by Madagascar, and Cote d’Ivoire’s production of cocoa beans during the late 1990s. If we
compare the main exporters of the water intensive goods against the main exports of the
non water intensive goods, we see that the water intensive goods tend to be produced in
poorer, more developing countries, which tend to have looser legal protections on resource
use. (This is speculation, however, and we don’t imply any sort of causation.)
Exports 90500
063
Vanilla beans
07 7
05 7
04
Sugar beet
06 4
4
054
034
04
=]
4
[|
03 7
=)
013
dị
{MDG
Cloves (whole fruit, cloves and stems)
oe |
04 4
05 4
03]
041
AX,
AC
S1
AT\
/\
Y/Y
te
wa
ia
À _ BA
<2
81040
Cranberries, bilberries, similar fruits, fresh
ON
20
AN NAA
CO
003
90700
mK WNWẢNV Ayo
K)
\
ote) \
014
001
05
121291
UN
03 4
02 4
ù
0.2 4
014
-
_
011
003
USA
003
180100
05 {
Cocoa beans, whole or broken, raw or roasted
043
0.30
0.25
M
020
033
015
02 7
R
01
005
D
0.0 7
035
010
151550
SDN
i
0.00
Sesame oil or fractions not chemically modified
05 7
0.30
04 4
0.25
0.20
USA
5
03 4
0.15
» 024
0.10
014
0.05
0.00
EK
a
A
0.0 7
70200
030 1
030
025 3
025 3
0204
020
0.15 4
0.15
0.10 4
0.10
0.05 4
0.05
000 3
1995
2000
2005
2010
2015
000
Tomatoes, fresh or chilled
P
EK
EX
LD
1995
2000
2005
210
215
Figure 2: Normalized weighted outdegree of the nodes, where the sum of the outdegree of all nodes sums to
1. On the left are the 5 most water-intensive crops, 6nd on the right are the 5 least water-intensive crops.
The numbers correspond to labels in the BACI database. We provide the three letter country code to label
any line corresponding to a country that accounted for at least 10% of exports in 1995 or 2016.
If we focus on specific goods, we can pick relate key geopolitical affairs to spikes and
drops in production within a given country. On the water intensive goods plot, we see that
in the early 2000s, Madagascar experienced a sharp drop in relative exports of cloves, around
the same time that it was experiencing political unrest and recovering from a significant
hurricane [14]. On the cocoa plot, we see that Ghana slowly ate into Cote d’Ivoire’s share
of the cocoa market, seemingly in response to partial liberalization of its cocoa market [15].
In the sesame oil plot, we see that Sudan is the major exporter in 1995, but its exports
plummet the following year. This aligns with UN-imposed sanctions on Sudan that started
in 1996 in response to Sudanese support of terror activities [16].
3.2.
Macro
Characteristics: Densification and Clustering and Densification
Next, we look
inary support for
densely clustered
goods. Given our
at the macro-level characteristics of the network. The data provide prelimthe idea that the networks for the most water intensive goods (1) are more
and (2) densify more rapidly than the networks for the least water intensive
small initial sample size, these results are not statistically significant.
3.2.1. Average Clustering Coefficient
The average clustering coefficient of the trading networks for each good, in each year,
are pictured in Figure 3. We can see that the average clustering coefficients for the more
water intensive goods seem to be on average higher than the clustering coefficients for the
least water intensive goods. There is a slight upward trend in the clustering coefficients over
time, especially for the most water intensive goods.
Clustering Coefficient by Year - Most Water Intensive Goods
Clustering Coefficient by Year - Least Water Intensive Goods
021
01
1995
—
9500
—
—
151550
9%111
—
—
0 19975
20000
20025
20050
Year
20075
2010.0
%?00
180100
2012.5
Clustering Coefficient
°
°
°
+
w
u
033
w=
——
°
Nu
Clustering Coefficient
06
0
2015.0
1
1995.0
T
1997.5
fr’
T
2000.0
T
2002.5
—
—
—
171791
81040
T—
70610
70940
70200
À
2005.0 2007.5
Year
I \
T
2010.0
4
+
2012.5
T
2015.0
Figure 3: Average clustering coefficient by good, by year, for five most and five least water intensive goods.
3.2.2. Nodes vs Edges
Next, we look at the relationship between the number of nodes and the number of edges
in these plots. For each good, we create a matrix of the number of edges and the number
of goods in each year. We then find the slopes of the edges vs nodes lines, as well as the
correlations, as provided in Table 2. We are here interested here in looking at the rate
at which the graphs “densify” and add edges. The slopes for both plots are well above 1,
indicating that they add edges much faster than adding nodes. The point estimate of the
average slope for the most water intensive goods is almost twice the average slope for the
least water intensive goods. The sample standard deviations are large, however, and we
7
cannot conclude at a level of statistical significance that there is a difference between the
average slope for the most and least water intensive goods.
ost
ve
‘omatoes
ol
Table 2: Slope and correlation for edges over nodes plots, first by good, then averaged across most
separately, least water intensive goods. Standard deviations are noted as well.
8.8.
Moving
and,
Towards a Discussion of Robustness - Testing for Power Law Distributions
Given our discussion of robustness in class, we decided to explore whether the degree
distributions of the networks for particular goods in particular years follow a power law
distribution. We would expect that networks whose degree distributions follow the power
law will be more robust to random attacks and less robust to targeted attacks (such as, say, a
drought in a major exporter). To begin to explore this, we simply plotted the complementary
cumulative density function for the good. We would expect that for Power Law distributions,
the CCDF would be linear, but we can see in Figure 6 that this appears to not be the case.
We did not more formally calculate an MLE because of a combination of this initial, negative
evidence, and because we found success with the metric of resilience described below.
Most Water Intensive Goods
10°
Least Water Intensive Goods
Peevey
CCDF
10”!
10”?
r
T
10
10!
T
102
T
109
Degree
Figure 4: Complementary cumulative density functions for our given goods.
T
101
T
107
Degree
Each color represents a different
good. There are 20 lines for each good, each representing the complementary CDF (P(X > x)) for one year.
4.
Resilience
over
Time
We can use our 20 years of data to examine the robustness of different networks. Our
measure of network resilience here will be a modified form of the Shannon’s Diversity, where
instead of looking at the size of connected components, we look at the normalized, weighted
outdegree from each country.? For good g, for countries c € C, and exporters for a given
good eg € Eg, and San
being the fraction of total exports coming from a country:
Egt
Hg
= —
Cạt
3
Cạt
c= “—logc—“—
egtCEgt
`"
€gt
En
We look at both the level and the changes in this metric.
Egt
In contrast to [13], we argue
that here, a low value of the metric tracks with a lower resilience, as it indicates a smaller
number of countries are contributing most exports. We look at changes with the idea that
any significant changes in the metric in response to, say, a drought, indicates low resilience.
When we plot this metric over time for our goods of interest, as in Figure 6, we find two
main results. First, we see little fluctuation in the metrics from year to year among the most
water intensive goods, with the exception of the graph for vanilla beans. This one dip aligns
with about the time the main exporter, Madagascar, was hit by a major typhoon. This
persistence is surprising given the noise in plots of the major exporters over time (Figure 2).
The graphs also suggest that the trading networks for the more water intensive goods are
more resilient, as they have higher values of this metric. This raises the possibility that
the trading networks for more water-constrained crops are somehow optimized to reallocate
production in the face of a localized supply shock.
oa Modified Shannon's Diversity - Export Flows, Most Intensive
oaModified Shannon's Diversity - Export Flows, Least Intensive
035
035
030
è
5 025
2
` 020
030
>
a
5 025
2
a
wm 020
= O15
a
=o 015
a
2
Se
°
121291
——
70200
——
——
—
81040
70610
70940
c
°
S5
” 010
0.10
0.05
o
——
0.05
¬
1995
x
2000
7
2005
Year
x
2010
x
2015
000 ~—
1995
+
2000
2005
Year
+
2010
7
2015
Figure 5: Complementary cumulative density functions for our given goods. Each color represents a different
good. There are 20 lines for each good, each representing the complementary CDF for a given year.
4.1.
Resilience as a Function of Water Intensity
Given the preliminary finding that the diversity metrics for the more water intensive
goods are higher than the diversity metrics for the least water intensive goods, we expand
our sample size and test whether there is more generally a relationship between the water
content of the crops of interest and the characteristics of the crops’ trading networks. We
use [10] to find the green water content of 266 crops in our sample, and for each good,
we construct its trading network for each of 20 years. We then run a series of simple
3We began with the metric used in [13], with the idea that we could look and see the extent to which the
graph became disconnected after supply shocks. However, we found that the graphs largely remain in one
weakly connected component over the 20 year period. We decided then to pursue an alternative metric that
would also let us, account for the fact that we are interested in flows.
4We had to drop 14 goods because of a lack of complete data.
regressions of the form below, where are our dependent variables (y in the equation below)
are, in separate regressions, the average diversity metrics, the average clustering coefficients,
and the average slope of the edges vs nodes curves.
y=arx+b,y=ax*
+b
The averages are calculated for specific goods across the 20 year time horizon. We are
mainly interested in the diversity metric, but include the others for interested readers. We
provide the calculated coefficients for each metric, for both specifications, below. We see that
there is a statistically significant and positive relationship between the square of the average
water content and the average diversity metric, though there is no evidence of a relationship
between water content and clustering coefficient or densification rate. If we plot the predicted
diversity values based on the water content of the goods we see that the diversity value is
increasing and convex over the observed range of water content, which indicates that by
squaring the water term, we have just allowed for some degree of curvature.
water
water
Table 3: Coefficients and p-values for our regressions on the water intensity of respective goods.
captures 6 simple regressions, covering 2 specifications for each network characteristic.
This table
This result merits two qualifications. First, the r-squared values for all prediction curves
levels are low, at approximately 0.10. Second, the result appears to not be very robust, as we
lose significance if we remove the 5 most water intensive goods from our dataset. This lack
of robustness is likely due to the fact that only a handful of goods are driving the variation
in the water content data, as seen in our appendix.
5.
Caveats
&
Conclusions
A number of asides are in order here. First, there are questions of endogeneity that we
have not explored, and the relationships described in this paper are governed by a price
mechanism that we have not accounted for at all. This approach implicitly assumes that
drought translates into a decrease in agricultural output, but it might be worth also exploring
the particular mechanisms that determine the mechanisms by which drought might lead to a
supply shock. Third, we do not here account for any types of self edges. It is undoubtedly the
case that nations consume some of the agricultural goods they produce, so by not including
any sorts of self edges in this representation of the graph, we are giving an incomplete picture.
Despite these caveats and the above-mentioned concerns about a lack of robustness, it
is potentially significant that the average diversity metric is positively related to the water
content of the goods. This result suggests that trading networks may be optimized in the
sense that they have built-in protections against exogenous shocks.
In the end, this project reflects a first attempt at entering a research space that will likely
grow in the coming years. This space revolves around questions of how networks of trade and
networks of production allow local supply shocks, like those caused by extreme weather, to
propagate and impact places far from their origin. Moving forward, it would be particularly
interesting to extend this analysis to look at supply chains, which have an additional level
of network complexity because they involve intermediate goods.
10
6.
6.1.
Appendix
Water bụ Crop
Water Consumption
100000
90000
Cubic ft Water/Ton of Crop
80000
70000
60000
50000
40000
30000
20000
NOM
AN
«+
œm
wn
.
or
MSMRSERR
NoOoOnRWDOAANM
nonaan
=
m
ủ œ
331
342
353
a
232
243
254
265
276
287
298
309
320
0
210
221
10000
Ranking of Water Intensity of Good
Figure 6: Water needed to grow crops in the Water Footprint Network Dataset.
goods appear in the BACI data, though the peak is still captured in our dataset.
11
A subset of 266 of these
Bibliography
[1] Acemoglu, Daron, et al. ” The network origins of aggregate fluctuations.” Econometrica
80.5 (2012): 1977-2016.
(2) BACT: International Trade Database at the Product-Level. The 1994-2007 VersionCEPII
Working Paper, N2010-23, Octobre 2010. Guillaume Gaulier, Soledad Zignago
[3] Chen, Zhan-Ming, and G. Q. Chen. ” Virtual water accounting for the globalized world
economy: national water footprint and international virtual water trade.” Ecological
Indicators 28 (2013): 142-149.
[4] Cabrales, Antonio, Piero Gottardi, and Fernando Vega-Redondo. ” Risk sharing and
contagion in networks.” The Review of Financial Studies 30.9 (2017): 3086-3127.
[5] Golub, Benjamin, and Matthew O. Jackson. ” Naive learning in social networks and the
wisdom of crowds.” American Economic Journal: Microeconomics 2.1 (2010): 112-49.
[6] Carleton, Tamma A., and Solomon M. Hsiang. ”Social and economic impacts of climate.” Science 353.6304 (2016): aad9837.
[7] https: //www.maa.org/press/periodicals/loci/joma/the-sir-model-for-spread-of-diseasethe-differential-equation-model
[8] Konar, M., et al. "Water for food:
Resources Research 47.5 (2011).
The global virtual water trade network.” Water
[9] Korniyenko, Ms Yevgeniya, Magali Pinat, and Brian Dew. Assessing the Fragility of
Global Trade: The Impact of Localized Supply Shocks Using Network Analysis. International Monetary Fund, 2017.
[10] Mekonnen, M.M. Hoekstra, A.Y. (2011) The green, blue and grey water footprint of
crops and derived crop products, Hydrology and Earth System Sciences, 15(5): 15771600.
[11] Moser, Susanne C., and Juliette A. Finzi Hart.” The long arm of climate change: societal
teleconnections and the future of climate change impacts studies.” Climatic Change
129.1-2
[12] Tamea,
(2015):
13-26.
Stefania,
Francesco
Laio,
and
Luca
Ridolfi.
”Global
effects of local food-
production crises: a virtual water perspective.” Scientific reports 6 (2016):
[13] Zitnik, Marinka, Rok Sosic, Marcus W
resilience in protein interactomes across
https: //doi.org/10.1101/454033
Feldman,
the tree
Jure Leskovec.
of life bioRxiv
18803.
Evolution of
454033;
doi:
[14] />[15] />13
[16] http : //crawfurd.dk/africa/sudan,imeline.htm
[17]
SNAP: A General-Purpose Network Analysis and Graph-Mining Library. Leskovec, Jure
and Sosi, Rok. ACM Transactions on Intelligent Systems and Technology (TIST), vol 8
number 1 page 1, 2016.
* Additional references, namely stack overflow references for plotting specific quantities,
are referenced in the project Git.
13