Cs224W 2018 62
Bạn đang xem bản rút gọn của tài liệu. Xem và tải ngay bản đầy đủ của tài liệu tại đây (4.29 MB, 9 trang )
Learn Query Similarity Through Link Analysis of a Webscale Click Graph with an Entity Ontology
Lijuan Liu
()
Abstract
The search for relevant information in websites can be very frustrating for users who, unintentionally, use too
general or inappropriate keywords to express their requests. To overcome this situation, researchers and
scientists focus on various potential query understanding techniques. And Query similarity is one of the most
important part and is the key to do the tasks like Query Rewriting, Query Expansion, Similarity Search,
Recommendation, Query Alteration and so on. Those queries with similar search intents but in different forms
or words can also help Information Retrieval (IR) task for better retrieving proper documents. However, current
existing approaches and algorithms are very hard to scale to real industrial environment and large dataset, and
many issues like entity mismatch, ambiguity are not fully solved.
Here | want to model query similarity issue through link analysis of Click-through Bipartite Graph in real web
search environment with an Entity Ontology (solving entity mismatch issue and disambiguation issue), and aim
at experimenting a way for modelling query similarity based on click graph, which can be directly applied in a
real web-scale industrial environment.
1
Introduction
Learning similarity between pairs of objects is an important generic problem in machine learning. Query similarity here
is, definitely, a problem about short text similarity in search environment. The challenges include how to model the query
similarity functions based on click graph data, and how to accurately and efficiently learn the query similarity functions.
The existing work mostly employ various approaches based on user search logs, and | will follow this resource, and
consider a weighted bipartite graph based on click-through data and an entity ontology for further reasoning.
In this section, we examine several papers dealing with query similarity, from state-of-the-art approaches in academia to
current modern industrial methods applied today, to understand the problem and the methods used to tackle it. | have
divided this section into several broad parts based on their main content; for investigation part, | present a summary,
and then the main contribution and key techniques of the relevant papers in first two parts. Then, | will summarize
existing similarity scores to model query similarity and related tasks. After this, | will summarize what is our goal to
achieve.
1.1 State-of-the-art approaches in academia
Traditional methods to model query similarity are mostly feature based, including vector space model, BM25, and
Language Model. These models are more focusing on query-query’s phrase/word/char level matching. These methods
are very straightforward with low recall. Ming query similarity from a click graph have been proposed in several
papers([2],[3]). The click-through bipartite graph, which represents users’ implicit judgements on query-query relevance
relations, have been proved to be a very valuable source for measuring the similarities. This graph-based link analysis will
be also applied in my project.
Wu et al. [1] consider leveraging information from both a click-through bipartite graph and features to measure querydocument and query-query similarity, as they called it an enriched click graph data. And they proposed a method based
on M-PLS(Multi-View Partial Least Squares) for modeling the similarity in a principled way. From this work, click count as
a link weight and linear mapping function can be considered in my project.
Craswell et al. [4] build an Anchor-2-Url bipartite graph and use Url intersection and Jaccard Similarity to mining similar
queries. The limitation here is for those queries that don’t appear in anchors, they cannot give a principled solution.
1.2 Industrial approaches in modern web search
In industry, as far as | know, for query similarity modeling, it is separated into several very detailed sub-problem from
different views. From query view, typically, according query complexity, it’s divided into easy query and hard query, or
head query and tail query, or different segmented query depending on various areas. From similarity view, the first
level issue is stemming and spelling correction, and the second layer issue is alteration among synonyms and antonyms
in query text words. Then, the hardest one is generally real rewritten on queries with some proper query relaxation to
better understand search intents.
From a view of used resources, the most common used resource is user session log. In general, for example, when a
user search something in web search engine without getting necessary relevant information, he/she possibly tries to
express his/her search intents by some other words. So, this kind of resource is initial widely used in modeling query
similarity related task through memorization. For other resources, such as Wikipedia Graph and some private-owned
knowledge based, are also popular to solve the problem.
For methodology, typically, empirical rules, parser and language model are combined. Furthermore, based on existing
contents and properties, a binary classifier is commonly used to identify a pair of two queries have similar intents or
not. As far as | know, in Google search engine and Microsoft search engine, there are huge amount of query classifiers
and learned pattern matching in production.
1.3 Similarity Functions
For Graph-based similarity functions, typically, what | learnt from our lecture are 1) common neighbors (CN), 2) Jaccard
Index(JI, it’s also called Jaccard Similarity in some papers like [4]), 3) SimRank. They are very common and classical.
In [3], they found SimRank is failed on their task with a query-2-Ads, so they revise SimRank into SimRank++ considering
sampled weighted click graph and introducing evidences scores to make an increasing function of the common neighbors
between two queries. In other words, they introduced two extensions on SimRank: one that takes into account the
weights of the edges in the click graph, and another that takes into account the “evidence” supporting the similarity
between queries. | will also borrow the idea: the evidence score here for entity matching to support the similarity
between queries.
Another proposed similarity function is P-Rank(Penetrating Rank) from [5], they present P-Rank is not only a new
similarity measure, but also it towards effectively computing the structural similairties of entities in real information
networks. And P-Rank is proven to be a unified structural similarity framework, under which all state-of-the-art similarity
measures, including CoCitation, Coupling, Amsler and SimRank are just its special cases. The intuition is taking into
account both in- and out-link relationships of entity pairs and penetrates the structural similarity computation beyond
neighborhood of vertices to the entire graph. This idea will also be in my consideration to employ.
1.4 Goals
The project | propose is to first build a weighted bipartite click-through graph(query-url) on a real web-scale search log
data, and second project this graph into query space graph by conditional/linear mapping, then model query similarity
according to state-of-the-art similarity functions with considering entity matching and Disambiguation through an
company-owned
Entity Ontology/Graph.
2_
Data Collection
Data is always the first important thing to proceed. In this section, | will first deep dive into how | collect the original
data from user click logs from a real production web search engine as network data. And then, | will introduce the
evaluation data, metrics and methods to be used to evaluate the performances among my method based on structural
click graph, current Bing production method and current Google production method.
2.1 Original Data
| collected 7-days (10/01/2018 to 10/07/2018) user click logs from a real production web search engine in English
market of United States as original data to be used to build click graph. The log format is Query-Url-ClickCountMinPositionRank-QuerylmpressionCount-UrllmpressionCount-QueryUrllmpressionCount. This original data is very huge
since the total number of distinct query-url pairs is 3,375,207,779, the number of distinct queries is 268,621,550 and
the number of distinct urls is 689,108,166. The field “ClickCount” will be normalized to weight the graph between
edges. And there also reserves some additional fields like MinPositionRank, QuerylmpressionCount,
OueryUrllmpressionCount, and they are used to do further filtering and pre-processing to simplify the network.
2.2 Evaluation Data
The evaluation data is the ground truth data to measure the performances of query similarity algorithm. Here | have my
company owned dataset like the table 1 shows. The number of distinct Queries is 122,634, and the average count of each
query’s similar queries is 1.56.
Similar Query
what location is area code 770
area code 770
what city is 770 area code
area code 770
what location is area code 770
area code 770
where is phone area code 770
lupus symptoms
signs and symptoms of sle
lupus symptoms
the signs for lupus
the battle of gettysburg
the battle of gettysburg
battle of gettysburg how many died
battle of gettysburg how many people died
1 acre compared to football field
how many feet are a football field
1 acre compared to football field
size of one acre land
1 acre contains how many square feet
_|foot in acre of land
1 acre contains how many square feet
{how many square footage is in an acreage
1 acre contains how many square feet
/number sq ft in acre
1 acre contains how many square feet
|square acre in Ít
1 acre contains how many square feet
1 acre contains how many square feet
_|square feet an acre
|square footage per acre
1 acre contains how many square feet
|what is the square footage of a house on an acre
Good(1) or Bad(0)
âO|ơ||||||âO|C|C|C||C|l||_|-
Query
770 area code
Table.1 Examples of evaluation data
For evaluation data selection, as for high frequent queries, learning similar queries is easier than low frequent queries.
So for this task, | focus more on tail queries (low frequent queries), and also for equality, queries from Bing log and Google
log are ina 1:1 ratio. For our internal judgements, we have another side of evaluation on queries, that is easy, moderate
or hard, and here | will consider mostly on hard queries. Table.2 shows all the selecting details.
Ratio
Evaluation Data
Bing Query: Google Query
1:1
Notes
Bing query means sampling from Bing search
log data; Google query means sampling from
Google search log data
Easy Query: Hard Query
2:8
Easy or Hard query is measured by judgement
data based on whole search results.
Head Query: Tail Query
1:9
Head or Tail query is measured by query
frequency from search logs data.
Table 2. Evaluation data selection
2. 3 Evaluation Metrics
Precision and Recall are the most common metrics that are used in query similarity tasks. The general goal is to improve
either one of them
or both. According to my task here, | define the following formulas to present how the precision and
recall calculate with considering query q and algorithm m.
1
Precision = "na,
number of queries
_
Precision(q, m)
q
|{real similar queries
~
to q}/N
{algorithm m generated similar queries to q}|
|algorithm m generated similar queries to q|
1
Recall =——______)
cca
number of queries
q
Recall(q,
ecall(q, m)
__ {real similar queries to q }N {algorithm m generated similar queries to q}|
~
lreal similar queries to q|
2.4 Evaluation Methods
| conduct the following experiments to compare the performances of weighted(clickCount) Simrank and evidence
(introduced entity ontology) based Simrank as techniques for learning query similarities. There are two basslines,
Experiment alias
Experiment type
Method
Bing_Prod
Baseline 1
There is an offline pipeline from Bing production for extracting
. ï
.
query-to-similarquery pairs.
Google_Prod
Baseline 2
| did a crawl tool to scrape Google’s related queries pairs from its
search result pages.
It’s my first method with bi-partite click graph with weighted
Click-Graph-w-SimRank | Treatment 1
edges based on click-through data.
Click-Graph-e-SimRank | Treatment 2
It’s my second method with bi-partite click graph with weighted
edges based on click-through data and introduce evidences based
on entity ontology.
Table. 3 Experiment Set-ups
3
Network Construction
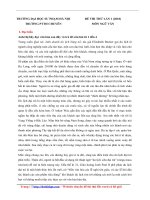
3.1 Data pre-processing
As | mentioned in Section 2.1, the original data is very huge. Here | do a pre-processing step to clean-up non-clicked
query-url pairs and filter out potential low-quality query-url pairs as the Figure. 1 showing.
Query-Url Pairs
with metadata
Filter by market
=
“en-US”
Aggregation on
Filter by Click
Filter by Min Rank
Query-Url
Count > 1
Position <= 8
Filter by Query
Filter by Url
Filter by Query-Url
Impression
Impression
Impression Rate
Click Count normalization
as weight
QuerylD->Query
Assign Node IDs
QuerylD-UrlIDWeight
Dictionary
UrlID -> Url
Dictionary
Figure.1 Data Pre-processing flow
3.2 Bipartite Click Graph Construct
Let O denote a set of n queries and U denote a set of m urls. A click-through graph for a specific period is an undirected,
weighted, bipartite graph G = (Q, U, E) where E is a set of edges that connect queries with urls. The graph G has an edge
(q, u) if it satisfies 3 conditions. The first condition is at least there are 2 impressions on query q. The second one is at
least 2 impressions on url side. The third one is during the time period there are at lease 2 clicks on the url u by the query
q. These 3 conditions is used to avoid some bad quality connections between queries and urls.
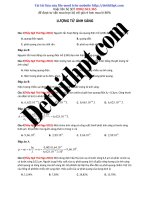
The bipartite click graph is constructed based on the data from the process of the section 3.1 and the definition and the
rules above. The figure.2 shows an example by a very minor part of my bipartite click graph, and also presents some stats
of the bipartite click graph.
Data Statistics
Query Nodes Count
13,312,354
Url Nodes Count
9,880,213
Edges Count
17,584,456
u1-(ID)873991: />u2-(ID)139490: />
u3-(ID)884023: />u4-(ID)638232: />q1-(ID)1939494: snap network
q2-(ID)2003923: snap Stanford
q3-(ID)1537837: jure Stanford
q4-(ID)1938931: snap edu
Figure.2 Bipartite Click Graph example and data statistics
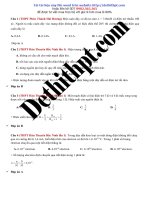
Among construction of the click graph, | did lots of noise filtering works to remove suspicious click data. And, as the data
is very huge, | also filtered out some data by clicks thresholds. The degree distribution and other some basic metrics of
the bipartite click graph is showed as the following, which represents a long tail line as expected.
Degree
9000000
8000000 7649349
7000000
6000000
5000000
4000000
3000000
2000000
1000000
0
Distribution
Histogram
3. 3 Project into Query Graph
Based on the above constructed
bipartite click graph G, | will project it into query-only graph to reason the query
similarities. A query-only graph derived from graph G is an undirected, weighted graph GQ = (Q, E’) where E’ is a set of
edges that connect among related queries. The graph GQ has an edge (q, q’) if there is a common url that both q and q’
are connected to. The weight of an edge (q, q’) is defined as the following formula, and it’s based on the idea of page
rank.
W(q,q') =
Constant x
weight (q, cu)
weight(q', cu)
*
Yuev weight(q,u) L4 Yucy weight(q',u)
3.4 Similarity Queries Extraction
| can extract similar queries through the whole query graph GQ. Here | set up two empirical thresholds, one is at most
top 5 similar queries are extracted since the baselines from Bing production and Google production can only output or
scrape 3 to 5 similar queries, and the other one is similarity function score threshold.
As mentioned above, | conducted two similarity functions showed in the following,
W — SimRank(q, q’) =
Constant «
»
>.
W(q,¡) *W(q',j) * S(,j)
i€E(q) je(q')
E — SimRank(q, q’) =
evidence(q, q’) * Constant x
»,
»
W(q,)*W(q',j)
*S(j)
i€E(q) je(4”)
For evidence (q, q’), it’s depending on an entity ontology, that means | will consider entity match between query q and
query q’. This evidence can improve the precision of similar queries and avoid typo/speller errors and noise among
similar queries. Some extracted similar queries are showed in the following Figure.3.
Method
Query
Generated Similar Query
Bing Production
Aspirin side effects
Aspirin side effects in men
taking aspirin daily side effects
aspirin side effects and warnings
low dose aspirin side effects
Aspirin baby side effects
Google Production
Aspirin side effects
What are the most common
side effects of aspirin
What are the side effects of taking aspirin daily
Who should not take aspirin and why?
Is it dangerous to suddenly stop taking aspirin
Click-Graph-W-SimRank |
Aspirin side effects
What side effects does aspirin have
Bad effects of aspirin
Side effects iburophen
Aspirin cox 1 stomach bleeding
Click-Graph-E-SimRank |
Aspirin side effects
What side effects does aspirin have
Bad effects of aspirin
Aspirin cox 1 stomach bleeding
Figure.3 Examples of generated similar queries (Nmax=5)
| randomly sampled some queries to do a deep dive analysis of generated similar queries by my methods and Bing
Prod/Google Prod performances. Most of Bing Prod’s similar queries and Google Prod’s similar queries are very relevant
to the original query, and Bing is good at generating similar queries by narrowing down the query scope to a detailed
one while Google is much better at re-descripting queries with some other words or different opposition. And my
methods based on click through graph also can retrieve some relevant and similar queries but with some observed noise
queries. Specially, for weighted simrank method, it also generates similar queries only on matching some of query terms,
which is bad on mismatching the important key entities. For evidence simrank method, it can avoid the entity mismatch
situation, but there are still some bad query expansions through url link information.
4
Results and Analysis
According to previous others’ work, the common analysis of similar query generation (or query expansion, query
rewriting, query suggestion) is based on query path and top N generation. Here, | looked into top 1, top 5, top
10 similar queries by different search engines and my methods, and calculated corresponding precision and
recall(for top 1 similar query, | only care about the precision and the recall does not make sense). The results
are showed in the following Table.4.
For methodology, no matter top 1, top5, top10, the precision results show Google Production> Bing Production >
Click-Graph-E-SimRank > Click-Graph-w-SimRank. My methods have obvious disadvantages comparing with
current two biggest search engines’ performances, especially, the performances drop fast when the total
retrieving number increases to 10. One good point is that Click-Graph-E-SimRank has a better performance than
Click-Graph-w-SimRank, which means considering entity matching in raw queries is very helpful and necessary.
This results also reminds
us that, structural
based
methods
are very useful to contribute to derive and
learn
query similarities. | read some technical documents from Bing’s and Google’s public resources, and | find that,
to improve the performances of this task, considering lexicon, text grammar, term alterations and translations
(which are missing in my methods) is very promising and necessary.
Results (top 1 similar query)
Experiment name
Precision
Recall
Bing Production
89.19%
a
Google Production
90.66%
-
Click-Graph-w-SimRank
70.90%
=
Click-Graph-E-SimRank
77.50%
5
Results (top 5 similar queries)
Experiment name
Precision
Recall
Bing Production
73.65%
67.33%
Google Production
88.75%
76.33%
Click-Graph-w-SimRank
65.33%
52.46%
Click-Graph-E-SimRank
69.18%
48.67%
Results (top 10 similar queries)
Experiment name
Precision
Recall
Bing Production
66.33%
89.45%
Google Production
70.50%
88.60%
Click-Graph-w-SimRank
49.91%
58.12%
Click-Graph-E-SimRank
43.50%
50.30%
Table.4 Precision-Recall report for learning similar queries.
5_
Conclusions
In this task, | studied the issue of learning query similarity from a click-through bipartite graph. The click-through
bipartite represents the click relations between queries and documents, and queries that clicking on same or
interactive documents can be traced similarities. For this work, | aim to only leverage the click-through bipartite
graph and a Microsoft internal entity database to perform the query similarity learning task. | proposed to use
two modified SimRank similarity functions to extract similar queries, which are straightforward and easy to do
generalization. Although the two methods | tried don’t beat present Bing and Google, structural based methods
are proven to be very useful on this task and these methods can give more candidates from new perspectives.
The issues here | need to mention is that data art is very important, which takes lots of time. And also, since my
data is very huge, it makes me have to finally implement by partitioning raw data and sending to cloud services,
So scaling is always a big issue.
As future work, | want to further enhance my methods and test its performance
text attributes, semantic info and some other state-of-art similarity functions. To
to generate text features, and semantic transformers. | also want to study the
industrial application, and thus my methods need to be kept straightforward, good
6
with considering more query
achieve the goal, | may need
scale-up of my methods for
generalization and efficiency.
Code Submission
GitHub Link: />Notes: since some data, codes and tools | use are Microsoft internal, please don’t clone and share them on any
places. And | have to delete the repository later. Sorry for the inconvenience.
Bing public API for Query Rewriting Service: />
References
[1]
Wu, H. Li, and J. Xu. Learning query and document similarities from click-through bipartite graph with metadata.
In Proceedings of the sixth ACM international conference on WSDM, pages 687-696, 2013.
[2]
N. Craswell and M. Szummer.
[3]
|. Antonellis, H. Garcia-Molina, and C.-C. Chang. Simrank++: Query rewriting through link analysis of the click graph.
[4]
[5]
N. Craswell, B. Billerbeck, D. Fetterly, and M. Najork. Robust query rewriting using anchor data. In WSDM, 2013.
Random walks on the click graph. In SIGIR, pages 239-246, 2007.
In Proceedings of VLDB, pages 408-421, 2008.
P. Zhao, J. Han, Y. Sun. P-rank: a comprehensive structural similarity measure over information networks. In CIKM,
pages 553-562.ACM,2009.
[6]
J. Davis and
[7]
Eric Yeh, Daniel Ramage, Christopher D. Manning, Eneko Agirre, and Aitor Soroa. Wikiwalk: Random walks on
wikipedia for semantic relatedness. In TextGraphs Workshop, pages 41-49, 2009.
[8]
[9]
M. Goadrich. The relationship between
precision-recall and roc curves. Technical
report #1551,
University of Wisconsin Madison, January 2006.
Y. Matsuo, T. Sakaki, K. Uchiyama, M. Ishizuka, Graph-based word clustering using web search engine, in: Proc. of
EMNLP 2006.
G. Erkan and D.R. Radev, “LexRank: Graph-based lexical centrality as salience in text summarization,” Journal of
Artificial Intelligence Research, vol. 22, pp. 457479, 2004