Cs224W 2018 83
Bạn đang xem bản rút gọn của tài liệu. Xem và tải ngay bản đầy đủ của tài liệu tại đây (5.04 MB, 9 trang )
Identifying Trends and Investigating Predictive Power
in the Global Conflict Network
Wesley C. Olmsted
wolmsted @ stanford.edu
Abstract
Conflicts on both the small-scale and large-scale lead to heavy loss of life and
damages in the affected areas. Studies have been done on peace science and the
factors that contribute to risk of conflict. In this paper, I use network analysis to
model these conflicts between various groups. From this analysis, I will provide
insights on victimized groups, conflict trends over time, and the most violent perpetrators. I also will demonstrate the predictive power of the network structure in
identifying unknown armed aggressors.
1
Introduction
The global conflict network now operates at a massive scale because of many non-state players.
There are conflicts that span country borders creating a vast network. Conflict networks present an
interesting antithesis to social networks. In this paper, I will explore the nature of the global conflict
network. I will use static and temporal techniques to identify the major motifs and trends that have
changed over time. I will also place all the insights into qualitative context to better understand the
actors that are most active in the network.
On top of this analysis, I will demonstrate that the network structure is valuable in identifying
unknown aggressors. Oftentimes when there is an attack, no one will claim responsibility, but from
the network structure along with other attributes of the attack we can make classifications of the
unknown actor. This model can be extremely valuable so that the international community can hold
the aggressors accountable for their actions.
2
2.1
Related work
Sharma et al., A complex network analysis of ethnic conflicts and human rights
violations [1]
This paper focuses on ethnic conflicts and humans rights violations. The data they use is gathered
from the GDELT Event Database, which contains articles from all over the world that can be queried
by keywords. Sharma et al. constructed the graph by creating undirected edges between two actors
involved in an event [1].
One of the key insights Sharma et al. provide is the systematic removal of the highest degree
actors. They show how the percentage of actors present in the largest cluster decrease drastically at
removal of less than 10% of nodes [1].
This paper was valuable in describing the structure of a conflict network in a way not many
papers have. It helped illustrate the key way to make the most impact in violent clusters by removing
the players with the highest degrees. The authors did not seem to take into account aggressors vs.
victims, however. For example, one of their samples was, ”Serb forces were engaged in ethnic
cleansing in Kosovo against the majority Albanian population of the province, according to the US
government.” [1] In this case, it would be more difficult to identify the aggressor and victim because
it would require some natural language processing, but using a directed graph seems to be a better
option. Having ”Serb forces” as one node directed towards ”Albanian population” would help us
have more insights in the network.
2.2
Campbell et al., Triangulating War: Network Structure and the Democratic Peace [2]
This paper focuses of the notion of democratic peace, meaning that “jointly democratic states
do not go to war, but democratic states are not monadically less likely to engage in conflict.” [2]
It attempts to show that this notion is not necessarily true because previous analysis has viewed
conflict as being purely dyadic. Campbell et al. back up the claims by performing network analysis
on state behavior. They also mention previous papers that support the notion of conflict graphs rarely
showing triadic closure behavior since node i and j, which are engaged in a conflict with node k,
would not engage in conflict with each other as it would interfere with their conflict with k [3]. One
of the main hypotheses of the paper is that there are many mixed-regime two-stars, meaning there
are frequent instances of two democratic states engaging in conflict with an autocratic state. These
mixed two-stars are then calculated as:
hurs(N) = UN 54 (NijyDiAj)(NjxrAjDr)
where hyrrs(JV) is the sum of all instances of the mixed two-star. N; j Tefers to a state i in conflict
with state, D; refers to if i is a democratic state, and A; refers to if j is an autocratic state. Nj,
refers to a state i in conflict with state, A; refers to if j is an autocratic state, and D,, refers to if k is
a democratic state [2]. The paper concludes that once you account for the tendency of like-regime
states with common enemies not to fight one another, “the effect of the democratic peace not only
vanishes, but jointly democratic dyads seem to be more conflict prone than mixed dyads.” [2]
The main contribution of this paper is to show that an isolated, qualitative view of inter-state
conflicts does not paint the true nature of conflict. The need for allies to share the burden of the cost
of war exceeds the “force” of any kind of democratic peace. Showing the statistical significance of
certain motifs in the conflict graph was illustrated well through comparison with different variations
of random graph models. Overall, the study was well executed, but it seems that the focus could
have been better served to also examine conflicts that do not have state players or have mixed state
and non-state players.
2.3
Datta et al., Extracting Inter-community Conflicts in Reddit [4]
This paper takes a look at subreddits in a conflict network by investigating individual players displaying aggressive behavior in subreddits that are not their normal social home. The graph is set up
with subreddits as nodes and directed edges as conflict. Each individual on reddit has social homes
in subreddits where they post norm-compliant posts (upvoted posts). There is a certain threshold of
10 comments they must post in order to be a part of the social home [4]. For a certain amount of
individuals from a given social home that post downvoted comments in other subreddits, a directed
edge is drawn from the agressors’ subreddit to the victim subreddit.
The paper also goes into detail of a co-conflict graph, where the authors analyze the nature of
individual agitators that share commonly attacked subreddits. An undirected edge is drawn between
subreddit A and B if the set of agitators that have commonly attacked subreddits Jaccard coefficient
is positive. The resulting graph is very disconnected because agitators tend to only misbehave in
one subreddit. Datta et al. then performed community detection with the Louvain algorithm and
displayed the strongest communities based on j:-score. The strongest communities tend to be about
politics, sports, and video games [4]. Most interestingly, the paper delves into the shift of aggression
over time. They created a monthly conflict graph and measured how many times a subreddit shifts
its number one aggression from month to month. On average, subreddits changed 6.91 times over
the year [4].
This paper does a good job creating a conflict graph in a unique way. Taking downvotes into
account to create a conflict graph out of a social network helps to identify where aggressors tend
to spend their time. By performing community detection and looking at changes over time, they
present a holistic view of conflict.
3
Dataset
The
dataset is from the Armed
Conflict Location
& Event Data Project (ACLED)
[5].
The
dataset ranges from 1997 to 2018. It contains conflicts between all non-state and state players
ranging from mortar strikes against civilians in Syria to private security engaging with local tribes in
Kenya.
Each row of data contains the date of the conflict, type of conflict (battle, remote violence,
violence against civilians, etc.), actors in the conflict, region, and number of fatalities. The dataset
also contains 247,427 instances of conflict since 1997.
4
4.1
Approach
Graph construction
The graph is constructed as a partially directed, weighted graph. Each edge is weighted by the
number of fatalities caused by it. If there are no fatalities in the conflict, we weight the edge as 0.1
so that we are using a nonzero weight. This graph can have multiple edges between nodes due to
different conflicts. For motif detection, however, we use an unweighted graph with only at most
one directed edge from node a to b and one from b to a. Edges are directed from the attacking
group to the defending group. For this reason, civilians will not have any outgoing edges. There are
more edges than instances of conflicts because some instances have multiple actors involved. Both
graphs contain 9,599 nodes. The weighted graph contains 296,182 edges, and the unweighted graph
contains 26,245 edges.
4.2
Static measurements
Before analyzing the graph temporally, I gathered static measurements on individual nodes and
the underlying motif structure. These statistics include: out-degree, in-degree, pagerank centrality,
betweenness centrality, HITS centrality, and 3-node motif counts. When working with motif counts,
we need to compare with a null model in order to determine statistical significance.
4.2.1
Ranking by degree
Some of the simplest and most valuable measures in this conflict graph are out-degree and indegree. From the weighted graph out-degrees, we can see the actors that are the most aggressive.
From the in-degrees, we can see which actors have the most fatalities from attackers. On top of the
simple in and out degrees, we can subtract out — in, which tells us how much actors are attacking
over being attacked. 7n — out shows us how much actors are being attacked over attacking others.
4.2.2
Pagerank centrality
To measure which actors are at the middle of conflict we can use centrality to find key players.
Centrality can help to tell us which groups should receive the most aid if they are victims and can
tell us which groups cause the most unrest in a region. We use the pagerank algorithm to determine
each node’s centrality. The pagerank algorithm is as follows [6]:
Th
Tạ =3 ojÐTT + (1—8)—
1
Where 1; is the pagerank of node i, d; is the weighted out-degree of node i, and / is a probability
that we jump to another node.
4.2.3
Betweenness Centrality
Besides, pagerank centrality, betweenness centrality is a useful measure for determining the
players that end up linking the subsects of conflict. Betweenness centrality is calculated by seeing
how many shortest paths pass through each node.
Øyz (3)
Ơụz
Where ơ„„ ¡s the total number of shortest paths between nodes y and z, and o,,(x) is the total
number of shortest paths between nodes y and z that pass through z.
Cuet(Œ) = Ny 2Aqr,0y.40
4.2.4
HITS Centrality
Hubs and authorities are a good way of understanding the aggressor and victim dynamic of the
conflict network. Hubs with directed edges towards authorities can be thought of as aggressors,
and authorities with inwards edges can be thought as the victims. We can use this simple iterative
method to find the hubs and authorities.
Cant (x)
=
3u yaChụp (y)
Chub (x)
=
3y sự Caut (y)
Chub() is the hub value of node x and Caut(x) is the authority value of node x. We ran this method
for 20 iterations.
4.3
Partially directed configuration model
The problem with using a standard configuration model to compare is that it only takes into
account in and out degrees. We also need to take into account the undirected degrees. The conflict
graph contains many undirected edges because violence is often reciprocated between two parties.
We wanted to make sure we can accurately depict the difference between two parties engaged in
conflict versus one party engaging with a nonviolent party. Our conflict graph contains about 28%
undirected edges, which means the conflict is reciprocated 28% of the time. In order to create an
accurate configuration model, we built on a partially directed graph model proposed by Spricer et al.
[7] The algorithm for creating the model in our context of bidirectional edges is shown in Algorithm
1, where G'(V, F) is the graph G with vertices V and edges E.
Algorithm 1 Create partially undirected configuration model [7]
6p ml Oy UN đề
tỳ
1: procedure PARTIALLY UNDIRECTEDNULLMODEL
9:
10:
l1:
12:
13:
input G(V, EF)
D + initialized matrix of size (|V|, 3)
Gnutt
< initialized graph with V,,.1. = V and no edges
for¿ — 0,...,|V|—1 do
D[i,0] < d; for out degree
Di, 1] < d; for in degree
D{i, 2] < d; for undirected degree
while ©; D/i, 2] > 0 do
m < random i in |V| where D[i, 2] > 0
n + randomj in |V| where D[j,2] > 0
ifm =n then
continue
14:
Enutt
—
Enutt
U (m, n)
15:
nan
—
Eni
U
16:
17:
18:
19:
20:
21:
22:
23:
24:
25:
4.4
(n,
m)
D[m,2] — D[m,2] — 1
Dịn,2] — Dịn, 2] — 1
while Ð;(D(¿,0]+ Di, 1]) > 0 đo
m + random i in |V| where D[i,0] > 0
n + randomj in |V| where D[j, 1] > 0
ifm =n then
continue
Enutt <— Enutt U (m, n)
Dim, 0] — D[m,0] — 1
Dịn,1] — Dịn, 1] — 1
Motif detection
In order to have a better understanding of the structure of the conflict network, we counted 3-
node motifs using the ESU algorithm and compared the results with the null model discussed earlier.
The Z-scores were calculated by creating 10 samples of the null model and calculating the mean and
standard deviation of each motif count. Then the Z-score was as follows:
_
Nựeal
_
Nhan
ˆ — std(NP!)
4.5
Temporal motif detection
Since this dataset spans 21 years, it would be valuable how motifs change from year to year in
the network. There might be trends over time that would show the changing nature of how conflict
is conducted. In order to do this, we created 21 separate networks, one for each year from 1997 to
2018. Then we use the same null model and motif detection as discussed earlier. To account for
differing sizes of these annual graphs, we used the network significance profile:
SP,=
Where SP is
4.6
Zi
4/5 ZG
a vector of the normalized Z-scores.
Unidentified aggressor classification model
This dataset contains many instances of attacks by unknown groups. In order to address this
problem and hold aggressors accountable, we can attempt to identify them using a classification
model. We eliminated samples of unidentified groups from the dataset so we had reliable labels. The
resulting dataset contains 168,194 samples. To capture the network features, we used Node2Vec for
each node. On top of capturing the network features, this also drastically reduces the dimensionaltiy
of the feature vector. If we did not use Node2Vec, we would need a one-hot vector to represent the
victim of the attack, which would have dimension of 9,599. Instead using Node2Vec, we represent
each node with a 128-dimensional vector. We used p = | and q = 1 to accurately capture both
structure and neighborhoods of each node. Besides the node vectors, we concatenated the location
of the attack in terms of latitude and longitude, country (as a one-hot vector), type of interaction
(ie: remote violence), fatalities, and timestamp. The labels corresponded to the id of the actor in the
graph. The dataset was divided up into train, dev, and test with a 80/10/10 split. It was also ordered
temporally because the identification would be time-sensitive so having attack data from the future
would introduce bias.
4.6.1
Classifier
We used a feedforward neural network as our main classifier. The network
connected layers with a relu activation function. For an optimizer, we used an
and for the dropout rate we used 0.1. We then optimized through 10 epochs of
the weights that had the best dev accuracy from each iteration. To compare the
instituted a Naive Bayes and Logistic regression classifier.
5
5.1
contiains 5 fully
Adam optimizer,
the data and used
classifier, we also
Results and discussion
Static measurements
This dataset contains many attacks by unidentified groups so for the sake of analysis, we omit
these groups and focus on known ones. First, we gathered the in and out degrees of all nodes and
recorded the top 5 in each category. The results are shown in Table 1. One major thing to notice is
the groups with the highest out-degrees are not necessarily the aggressors. A high out degree for example in the case of AMISOM (African Union Mission to Somalia), which is an operation approved
by the UN security council, can be attributed to a large amount of successful strikes. On the other
hand, a high in-degree means that the group is taking on heavy losses from attacks. So oftentimes,
civilians as well as violent aggressors have high in-degrees because they are targeted frequently.
The results for the out-in degrees and in-out degrees is displayed in Table 2. The highest out —
in degrees mainly come from organized groups carrying out strikes on specific violent targets. For
or
c
Yemen
State
ans
1geria
Table 1: Groups with highest out and in degrees
example, AMISOM is fighting against Al Shabaab and the Global Coalition Against Daesh is fighting against ISIL. Not surprisingly, civilians make up the the most of in — out degrees. Interestingly,
The war in Yemen is accurately reflected in these degree rankings. The Military Forces of Yemen
(2016-) is also known as the Supreme Political Council who began challenging the existing regime
in 2015 and has led to immense amounts of violence in the region. According to these numbers, the
Military Forces of Yemen (2012-) or the Hadi regime have faced the heaviest attacks.
Table 2: Groups with highest out — in and in — out degrees
For the pagerank centrality, the term d;, which is the weighted out-degree of node i, dampens the
pagerank so it would seem that civilian groups would have the highest pagerank. This is generally
the case in Table 3. The one exception is the Islamic State (Syria), which means that they are engaged with many large players in the region. This kind of fighting on all fronts hits at a large amount
of infighting between groups.
Betweenness centrality is an interesting measure because it can show which groups bridge together different regions of conflicts. Most conflicts tend to contained locally so nodes with high
centrality are most often bridge nodes between regions. The betweenness centrality also shows that
civilians are often these bridge nodes between other aggressive groups. There is one violent group
in Al Shabaab with high betweenness centrality meaning that Al Shabaab is in conflict with various
regional opponents.
ans
roup
igeria
a
c
co
State
Table 3: Groups with highest pagerank and betweenness centrality
One of the best measures of centrality for the conflict graph is HITS shown in Table 4. Most of
the time, hubs and authorities accurately fill roles of aggressive groups and victimized groups. Due
to the recursive nature, the highest authority scores are all civilians because they are at the center
of most conflicts. This also in turn means that the hubs are the most violent in targeting civilians.
We can see that three main conflicts are responsible for these high centrality scores: the Syrian Civil
War, Sudanese Civil Wars, and Somali Civil War.
Table 4: Groups with highest hub and authority scores
5.2
Motif detection
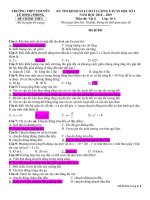
The resulting Z-scores are shown in Figure 1. Interestingly enough, based on literature triadic
closure was quite infrequent because it makes little sense to engage with an enemy of an enemy
[2]. Our findings show that the 12th motif where two actors are engaged with each other and one
is aggressive toward the other is one of the most statistically significant Z-scores. The previous
works tend to focus more on inter-state conflict so this might be a relatively new phenomenon with
conflicts on the smaller scale. Also, noteworthy motifs are ones that contain a node with no out
edges and only in edges. This would most likely signify civilian targeting. For example, motifs 4
through 6 have a node that is targeted by two other nodes. These 3 nodes appear often with statistical
significance so we can assume that civilians are often involved in small skirmishes regardless if they
are targeted on purpose. Motif 5 is the most significant motif and is interesting because there is
no reciprocated aggression. It seems that one actor is targeting civilians directly and the other is
attacking both with the violence towards civilians potentially being incidental.
ewe Tee ot
Sebo
bs fe bebe
[ 0.9399 | 1.250
[5938
| -15.70 | 13.35
| 115.7
| 28.48| -1.400
| 56.61
| 68.04| -29.83 |
| 88.22| -0.288|
Figure 1: Z-Scores of 3-node motif counts
5.3
Temporal motif detection
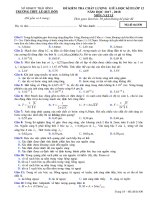
Normalized Z-scores from 1997 to 2018 are shown in Figure 2. From first glance, it does not
seem that any motif steadily increases or decreases over the years. Most tend to change sporadically
from year to year. One of the most interesting motifs is motif 13, which is not very statistically
significant until 2016 where it spikes quite heavily. Motif 13 is a triangle motif where all actors
have shown aggression to all others in the triangle. This motif is usually not very common, but
in 2016, there is a serious change in the conflict network, which has led to this becoming more
prevalent. This potentially could have arisen out of more intervention in the Syrian Civil War, and
the sheer amount of different players involved in the conflict. The three-way conflict motif suggests
that there are groups with the same enemies and goals that are fighting among themselves. Many
Islamic militant groups differ on ideology and this leads to infighting and a more decentralized power
struggle. Overall, some spikes are anomalies and provide a starting point for more investigation into
major conflicts during that year.
Z-Score of Each Motif from 1997-2018
1.04
0.6
2
$
M
3
Motif1
——
Motif2
0.6 4
—— Motif 3
044
—— Motif 5
=
0.29
2
001
Ẹ
—
Motif4
——
Motif6
—— Motif 7
— Motif 8
=———
——
—
——
——
Tv
:
—0.4
——
Motif9
Motif
Motif
Motif
Motif
10
11
12
13
3
1997
1999
2001
2003
2005
2007
Year
2009
2011
2013
2015
2017
Figure 2: Normalized Z-Scores of 3-node motif counts from 1997-2018
5.4
Aggressor classification
The neural network classifier was significantly more accurate than the Naive Bayes and Logistic regression classifiers. With 72% accuracy the neural network classifier is extremely successful
considering there are 9,599 possible labels. The classifier still struggles with similar groups that
operate in the same regions. For example, one incorrectly classified sample was an attack against
the Afghanistan military, which was classified as the Taliban. The correct label was the Islamic State
(Afghanistan). This introduces a problem with the model because these hard identifications are often
the most valuable.
Overall, this model is best used for identification at scale or in conjunction with
proper qualitative investigation.
aive
Ba
ccuracy
regression
Table 5: Test set accuracy
6
Conclusion and future work
The main value of this project is the applications combined with real-world context. One caveat
to consider is that this dataset does not contain indirect fatalities.
Famine in Yemen,
for example,
is one of the largest crises in the world, but it is not reflected in these numbers. Quantitative
data on specific actors in the network can lead to prioritizing in peacekeeping missions or aid to
violent regions. The methods for identifying trends in motifs can help increase the depth to how
we investigate small-scale conflicts. Node2Vec provides a powerful method of using network
features to help solve a difficult problem in identifying aggressive actors. It also provides a way of
dimensionality reduction necessary for complicated models. For future work, this predictive model
could be expanded on. For example, we could use natural language processing from news articles
as part of the feature space. Also, more hyperparameter tuning would benefit the model. Predictive
models using edge detection could also be valuable in identifying at-risk civilians. Overall, network
analysis provides us both macro and micro insights on the nature of modern conflict.
Github link: />
References
[1]
K. Sharma, G. Sehgal, B. Gupta, G. Sharma, A. Chatterjee, A. Chakraborti, and G. Shroff, “A
complex network analysis of ethnic conflicts and human rights violations,” Scientific Reports,
vol. 7, no. 1, p. 8283, 2017.
[2] B. Campbell, S. Cranmer, and B. Desmarais, “Triangulating war:
democratic peace,” arXiv preprint arXiv: 1809.04141, 2018.
[3]
S. J. Cranmer and B. A. Desmarais, “Inferential network analysis
graph models,” Political Analysis, vol. 19, no. 1, p. 6686, 2011.
[4] S. Datta and E. Adar,
arXiv: 1808.04405, 2018.
[5]
Network structure and the
“Extracting
inter-community
conflicts
with exponential random
in reddit,’
arXiv
preprint
“www.acleddata.com.”
[6] L. Page, S. Brin, R. Motwani, and T. Winograd, “The pagerank citation ranking: Bringing order
to the web,” 1998.
[7] K. Spricer and T. Britton, “The configuration model for partially directed graphs,” Journal of
Statistical Physics, vol. 161, no. 4, pp. 965-985, 2015.


![Nghiên cứu sản xuất bột hòa tan từ măng tây xanh (Asparagus officinalis) [Số hợp đồng: 2018.01.83]](https://media.store123doc.com/images/document/2021_03/30/medium_csG9TkP6eC0M4XOtXPfgpM8j4.jpg)