Cs224W 2018 102
Bạn đang xem bản rút gọn của tài liệu. Xem và tải ngay bản đầy đủ của tài liệu tại đây (6.02 MB, 8 trang )
Predicting Fake News
Analyzing the Reference Network Structure of News Articles
https: //github.com/cjxh/cs224w-final-project
Christina Hung
Stanford University
Todd Macdonald
Stanford University
Abstract
Concerns over fake news have gradually grown nationwide in the past 2-3 years, as
witnessed via not only the U.S. political climate since the 2016 presidential election (where Russia allegedly disseminated fake news on American social media
to sway the election outcome), but also continuous allegations that social media
sites (such as Facebook) have contributed significantly to the spread of deliberate
misinformation. In light of these events, we are interested in performing structural
analysis over the uniquely structured reference network of news article sources in
this project. Existing research has focused on the veracity of Wikipedia articles
via analysis of the Wikipedia article citation network. We plan to similarly focus
on the classification of news sources based on the article citation network structure; we propose and evaluate a couple clustering techniques against null models
(Erdos-Renyi Random Graphs) to classify our news sources: (1) generate node
embeddings via Node2Vec, then cluster using k-means (2) generate node embeddings via Struc2Vec, then cluster using k-means (3) Spectral Clustering. We find
that due to the complex structure of the news citation network, clustering generated embeddings appear to best capture the latent structural similarities of the
corresponding nodes.
1
Introduction
The authenticity of information has been a fairly
deep-rooted problem in society. In recent years,
the media spotlight on misinformation of the
public has been growing due to its increasingly
apparent political impact. In this current day and
age, information spread occurs at an incredibly
fast pace. Ease of access and low cost of various
online news sources makes it easier than ever for
almost anyone to publish news and propagate it.
Therefore, it is more important than ever to as-
sess the validity of the ’news articles” we read
on the Internet, so that we can be well-informed
citizens via unbiased sources.
While there are many approaches to identifying untrustworthy news articles, such as using
feature extraction coupled with machine learning classifiers on the content of news articles,
this project focuses on relevant network analysis techniques, in particular role extraction and
clustering. By modeling news sources as part of
a citation network, where each node represents a
news source and each directed edge represents a
citation, we are able to apply these network analysis techniques.
Citation
networks
structural roles.
have
shown
In Kumar
to often
have
et al., discussed
in
more detail below, Wikipedia articles with high
ego-network clustering coefficients were shown
to be less trustworthy. Since a high ego-network
clustering coefficient represents an echo cham-
ber of sorts, this metric in effect uncovers role
information. By extension, an article with a low
ego-network coefficient may indicate the article
has
more
diverse
citations.
Similarly,
articles
with high in degree and out degree can represent
the structural roles of hubs or authorities.
In this project, we perform a variety of unsupervised learning techniques on a citation network
of news sources. Based on the clustering assignments of the news sources that we learn from
our unsupervised learning, we will quantitatively
evaluate whether these assignments correlate at
all with the trustworthiness of each news source,
as labeled by MarketWatch.
To perform this
unsupervised learning, we use clustering techniques, such as k-means and spectral clustering,
as well as node embeddings, such as Struc2 Vec
and Node2Vec.
2
below,
in Algorithms
and
2.2
Spectrum-based Methods
Methods.
An
important distinction between Node2Vec and
Struc2Vec is that the Struc2Vec embedding of a
node is designed to be completely independent
of the node’s position in the graph.
Related Work
Due to the highly diverse connectivity patterns
that are usually observed in networks, when partitioning a graph into clusters, we often need to
extract features in order to correctly account for
this information.
2.1
about nodes’ structural similarity; it is detailed
more
Embedding-based Methods
Grover et al. introduced the Node2Vec algorithm in their study *"Node2Vec: Scalable Feature Learning for Networks” in 2016. The algorithm works by using a biased random walk that
blends the local view of a network possible with
breadth-first search and the global view possible
with depth-first search. The amount of each view
is regulated by return parameter p and in-out parameter q. These parameters are a great benefit of the algorithm, as they allow it to be tunable. At each time step, the parameters p and q
determine the probability that the random walk
will next return to the previous node, proceed
to a new node equal distance from the previous
node, or proceed one step further from the previous node. Grover et al. show that this approach
is computationally efficient and scalable.
In addition, the study shows promising results
about identifying structural roles in graph. Using
network data from the Les Misrables play, where
each edge represents a co-occurrence between
characters and each node represents a character,
Grover et al. show that the Node2Vec embedding for each character reveals groups of characters that bridge major sub-plots and other groups
of characters that have limited interaction with
one another. These sort of groups show how
the Node2Vec embedding is capturing structural roles. While these results are more qualitative, the study does quantitatively compare
the Node2Vec against other algorithms, such as
spectral clustering and Deep Walk in multilabel
classification, finding that the Node2Vec had between a 1% and 22% increase in Fl score depending on the dataset.
Other studies use different versions of random
walks to capture structural information in a
graph.
Ribeiro et al. introduces a technique
called Struc2Vec, which performs random walks
on a modified version of the original graph.
This modified graph incorporates information
In contrast to applying regular k-means clustering to learned features (such as network embeddings via Node2Vec or Struc2Vec), Shi et
al. (2000) and Ng et al. (2001) in their papers
*Normalized Cuts and Image Segmentation” and
”On Spectral Clustering: Analysis and an Algorithm,” respectively, discuss methods of constructing a graph’s similarity matrix and extracting its ’spectrum” to help map the network to
a lower dimensional space so that nodes can
be easily separable using algorithms such as kmeans clustering, while eliminating some of the
constraints applied by regular k-means. For instance, applying k-means clustering to Laplacian eigenvectors means that we can find clusters
with non-convex boundaries. Additionally, these
dimension-reduction techniques allow us to reduce noise from outliers.
2.3
Static Network Analysis Methods
In comparison to Grover et al.’s study, which focuses on a single algorithmic framework for feature discovery across several datasets, Kumar et
al. focuses on exploring a particular network
dataset using several approaches in ’Misinformation and Misbehavior Mining on the Web”.
The study examined a dataset of 20,000 hoax articles on Wikipedia and covered three primary
objectives: analyzing the impact of hoaxes on
societal information, delineating typical characteristics of hoaxes in comparison to non-hoax articles, and automatically classifying whether articles are hoaxes.
In regards to network analysis, the study showed
the effectiveness of using metrics such as egonetwork clustering coefficient, web link density,
and wiki-link density, which is defined as the
number of links per 100 words, to help classify Wikipedia articles that are misinformation.
These network analysis metrics are relevant to
this current study, since the network roles of mis-
information articles on Wikipedia may be similar
to that of the untrustworthy web articles in our
dataset.
3
Overview of Approach
1. Construct
a citation
network
graph
G,
where
di-
rected edges are citations and nodes are news
sources.
2. Using technique T, cluster the labeled nodes
in G into k <=
15 clusters, where k is deter-
mined according to metric M,.
3. Compare the cluster assignments with the
true cluster assignments of the news sources
using metric Mz. The true labels are determined per labeling scheme L.
The specific techniques and metrics we use for
this approach are detailed in the Algorithms,
Methods, and Experiments sections of our study.
type
node count
|
directed edge count
sum of edge weights
C
CofGnp
Glarge
4983
|
Gsmall
6695
52099
0.0782
0.000689
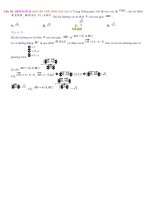
Figure 1:
General attributes of ;z;se and
Gsmall- Gnp tefers to the Erdos-Renyi equiva-
lent graph with the same number of nodes and
edges.
higher clustering coefficient. This higher clustering coefficient allows node embeddings to capture more latent structure in the citation graph.
As is standard with citation networks,
4
Model
4.1
The Dataset
In this project, we will be using a snapshot of
news articles from Stanford’s Network Analysis
Project group.
This data consists of a series
of news
article
URLs
from
September
2016,
followed by a tab-delimited list of referenced
source
URLs;
these
references
were
found
by parsing the article’s contents. The articles
belong to a variety of news sources, varying
from blogs
blogspot;
such as livejournal,
tumblLr,
to slightly obscure informational
websites
such
as
trading-house.net,
recovery-health.me,
and
advisoranalysis.com; to more widelyrecognized news sources such as ABC News,
CNN, and NY Times.
The snapshot we are using is 700 MB and contains approximately 500,000 lines. Since each
line represents a unique article, this means that
there are at minimum 500,000 unique articles in
the dataset.
For labels to our dataset, we use Trust Score
metrics from MarketWatch, which labels news
sources a score between 0 and 1, from least to
most trustworthy. These trust scores correspond
to 31 news sources in our dataset.
4.2
Graph Creation
In our graph construction, we decide to represent
nodes as news sources instead of news articles
for several reasons. First, since the labels to our
dataset are in terms of news sources, not news ar-
ticles, it makes sense to have a corresponding relation in the graph. Second, using news sources
as nodes
means
that each
node
graph will have a higher degree,
in the citation
leading to a
31
210
1636
0.664
0.37
each di-
rected edge represents a citation between two
news sources. We choose to use directed edges
to preserve the additional information that the direction of a citation represents. For completeness in analysis in the later sections, we consider both weighted edges for each citation (i.e.,
counting the duplicates of citations from source
A to source B), as well as unweighted edges, i.e.,
assuming weight of | for all edges).
Since we only wish to best represent the node
embeddings of the news sources for which we
have labels, we construct the graph to only contain
the
labeled
sources,
their
neighbors,
and
their neighbors of neighbors. This construction
follows our hypothesis that there is local structure in the citation graph for each news source;
for instance, a less trustworthy article may be
cited or indirectly cited as frequently. Equally
importantly, this construction allows us to reduce the size of the overall graph to 4983 nodes
and 6695 directed edges, which makes computing the node embeddings more computationally tractable; for instance, without this specific graph construction (using all sources and
citations in our dataset), computing Node2Vec
would not complete in over an hour; with this
construction, Node2Vec can be computed in
about 15 seconds.
For greater depth in our analysis, we decided to
perform our experiments on 2 graphs, the Large
Source Graph, Gjarge, described above, which
contains 4983 nodes and 6695 directed edges,
and the Small Source Graph, Gsmaiz, Which contains 31 nodes and 210 directed edges; the Small
Source Graph is an induced sub-graph from the
Large Source Graph, containing only the nodes
for which we have labels from MarketWatch.
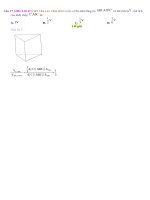
From the visualization of G's1;
in figure 2, we
can see the complexity in trying to cluster these
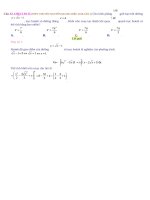
nodes in an unsupervised manner. We see that
maximize the probability of finding each node
n, in a neighborhood. Assuming conditional independence, this accounts to maximizing the following:
mos À
[-log(À ` f(u)- ƒ(0))
u€V
+
Figure
2:
Visualization
of G;„;„¡¡,
an induced
subgraph for which all nodes have trust score la-
bels from MarketWatch.
unweighted and directed.
In this case, Gsmaiz
is
veEV
SO
mạ€Ns(u)
f(r): fw)
In the above objective function, we define a func-
tion f: V > R24, to map a node v € V intoa
d-dimensional feature vector. Ng(u) represents
the set of nodes along the random walk of u.
Thus, we are able to use the biased random walks
in Node2Vec to generate feature embeddings for
each node.
both sources with low trust scores, such as less
than 0.25, and sources with high trust scores,
such as above 0.75, can have similar local structure. For instance, consider the two nodes with
trust scores of 0.1 and 0.82 in the graph (far left
and far bottom areas of the graph). These nodes
represent donaldjtrump.com and time.com, respectively.
We see that both nodes have a
high in degree and zero out degree; several of
these citations are from the same
sources,
such
as respected media outlet nytimes.com, with
trust score 0.75; thus, donaldjtrump.com and
time.com share a relatively similar local structure, despite having divergent trust scores.
Node2Vec is extremely useful due to its adjustable parameters, such p, q, walk length, and
the presence weighted edges. We utilize all of
these parameters in our experiments, which enable us to capture different structural aspects of
each node.
5.1.2
Struc2Vec
Struc2Vec is similar to Node2Vec in that both algorithms involve random walks over a network
and are generally well-suited for capturing network structure. Struc2Vec primarily differs in
that it preprocesses the network prior to the ran-
dom walks; it also excels, according to Ribeiro et
5
5.1
5.1.1
Algorithms and Methods
Node Embeddings
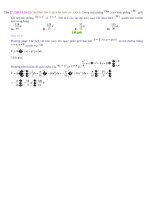
Node2Vec
The Node2Vec algorithm consists of performing
r random walks of length n from each node. For
a node u, the random walk of u is represented by
neighborhood N,.(u), which is a set of all vis-
ited nodes along the biased random walk. At
each step of the random walk, the probability for
transitioning to a new node t is follows, where
Scurrent 18 the current node, Sp,e, 18 the previ-
ous node, and d(sprey,t) is the distance from the
previous node to node t:
1/4 A(Sprevst) =2
1
1/p
d(Sprev,t) = 0
d(Sprev,t) = 1
From the neighborhoods calculated with the biased random walks, the Node2Vec algorithm
then finds the embeddings of each node that
al. at finding structural similarity possible even
for nodes far apart in the network.
In the preprocessing step of Struc2Vec, the network is converted into a multi-layer graph with
k layers, meaning that there are up to k different
types of edges between each node. The edges are
calculated using structural similarity, which is
involves comparing the ordered degree sequence
of nodes k-hops away from from the two nodes
being compared.
In each layer h of the graph, every pair of nodes
n;, and n; is connected with an undirected edge
that is
tween
larity
(mi,
proportional to the structural similarity benode i and node j. The structural simiis defined using a function f, where where
n;) is the structural distance between n;
and n;. More formally, we define f),(n;,n,;) as
follows, where R;,(n;,7;) is the cost of pairwise
alignment between the ordered degree sequence
of nodes distance h from u and the ordered degree sequence of nodes distance h from v:
fr(ni,nj)) = fr—1(mi,
23) + Ra(ni,n;)
The weights between nodes in layer h are defined
by the following equation:
wh(ni, nj) = exp(—1 * fr (ni, nj)
The structural distance function f;, is defined
such that f,(ni,n;) >= fr—1(mi,n;), meaning
that at each increasing layer in the constructed
graph, the weights between structurally similar
nodes is comparatively less compared to the average edge weight in that layer. Since the probability of transitioning to a node u from a node
v in the same layer is proportional to the weight
of the edge between u and v, this means that at
higher levels in the constructed graph, the probability of transitioning to a structurally similar
node decreases.
For this study, we use Ribeiro et al.’s implementation of Struc2Vec. Staying consistent with this
implementation,
we set the number of levels in
the constructed graph to be the diameter of the
overall graph.
In comparison to Node2Vec, which uses edges in
the original graph to transition between nodes,
Struc2Vec makes the transition probability between nodes proportional to the structural similarity between the nodes.
5.2
Clustering Methods
5.3.
Silhouette Score
To quantitatively determine the ideal number of
clusters to use when clustering node embeddings
from Node2Vec and Struc2Vec using kmeans,
we use a metric called the silhouette score. The
silhouette score measures how similar a node is
to the other nodes in its cluster. It is defined by
the following equation for a single node i, where
a(i) is the average distance between node i and
all other nodes in the same assigned cluster and
b(¿) is the distance between i and the centroid of
the next nearest cluster:
sự) - — 00) = 40)
maz(a(¡), 0(¡))
We decided to use the Silhouette score since it
considers both how close together elements are
within a cluster as well as how far apart the different clusters are. In addition, it is very commonly used in conjunction with k-means, which
we used as our clustering algorithm.
Since we only have 31
define the ideal number
of clusters k less than
highest corresponding
labeled news sources, we
of clusters as the number
or equal to 15 with the
silhouette score.
5.4
K-Means
In the k-means algorithm, the overall goal is to
maximize the following objective, where k represents the number of clusters, s represents the
assignment of nodes to each cluster, and 4; rep-
resents the location of centroid i, the center of
cluster 1:
argmin >
le — wal?
i=1 xES
While the algorithm is used to approximate this
objective, it is not guaranteed to find the global
optima. K-means works by initializing k centroids to random locations. Each vector embedding is assigned to the centroid i that is closest by
euclidean distance. Next, the location of every
centroid i is updated to be the average location
of each vector embedding corresponding to the
particular assignment i. This process then continues until convergence.
We use the k-means algorithm to cluster the node
embeddings from Node2Vec and Struc2Vec.
However,
are
tance
in Node2Vec,
optimized
instead
according
of the
the node
to
euclidean
the
embeddings
cosine
we change the objective in k-means
Node2Vec embeddings to be:
argmin S
thus,
for the
Hạc
+
`
|||
i=1 2ES
5.5
dis-
distance,
Spectral Clustering
Spectral clustering is a method of recursively
partitioning the graph into & clusters that uses the
spectrum of the network’s adjacency matrix. At
each iteration, we reduce the dimensions of our
data, then partition the data.
Given an undirected graph G(V, E), we gener-
ate the corresponding ”spectrum” of our graph
as follows:
1) First, we construct a similarity matrix A to
represent the graph by defining a |V| x |V| ma-
trix of 1’s (the two vertices are connected by an
edge, and therefore adjacent) or 0’s (the two vertices are not adjacent).
2) Then,
we
construct
a degree
matrix
D
by
defining a |V|x |V| matrix such that D = [d;]
where d;;= degree of node7.
3) Finally,
we
define
our
Laplacian
matrix
L
such that L = D— A. The eigenvalues of L
make up the ’spectrum” of our graph.
Using the spectrum, we can determine the ideal
number of clusters & such that the optimal k
maximizes the eigengap between each pair of
eigenvalues
On =
Ay;
and
A,_1
given
by
6%,
where
\Nk — Àk—I|.
In order to partition our graph, we apply a simultaneous k-way cut with the top / eigenvectors of
L as presented in Shi, et al.
(2000).
First, we
build a |V| x & matrix V where each column is
the corresponding top k eigenvector. Interpreting
each row of V as a new data-point Z; such that
Z;¡ <*, we perform k-means clustering (as discussed above) on data-points Z; in Ki
Doing so
reduces the dimensions of our input space from
|V| x |V| to |V| xk.
6
6.1
compare this ’ground truth” label to our respective clusterings.
evaluate our clustering results via the ad-
justed mutual information (AMI)
score to com-
pare the similarity between clusters and the corresponding “true” data labelings. We calculate
this score for two clusterings U and V with k
labels as follows, where MI is the mutual infor-
mation shared between two clusters:
|U
JVỊ
clusters, clustered by market score 0-0.1, 0.1-0.2,
..., 0.9-1.0. This way, very similarly trusted articles are grouped together. For instance, breitbart,
buzzfeed, donaldjtrump, infowars, and occupydemocrats would be news sources that would
qualify for a single cluster (trust score < 0.1)
under this approach.
Results
Node2Vec
When calculating the embeddings for Node2Vec,
Chang, S. in her Marketwatch article (2016). We
=
such as 0.4 and 0.6, would be in separate cluster
assignments. Taking this into consideration, we
decided to use a true clustering that included 10
6.2.1
Evaluation Metric
MI(U,V)
news sources with trust scores greater than 0.5,
since then nodes with very similar trust scores,
6.2
Experiments
We assign “trustworthiness” labels on a scale of
1-10 to our data using rounded scores defined by
We
tween 0 and 1, it does not make sense to split up
the nodes into two groups, such as news sources
with trust scores less than or equal to 0.5 and
JƯn v;|, log ——__>
N|U;
n Vị|
——_
ke
SW
(1)
we
considered
Gmaij
and
Giarge
in
both
weighted edge and unweighted edge interpreta-
tions, for a total of 4 permutations.
From the AMI scores in figure 3 and figure 4,
we see a very weak link between the trust score
of the news sources and their cluster assignment.
Regardless of whether the Node2Vec embedding
favored localized features, with a low p value
(figure 3), or global features, with a low q value
(figure 4), the AMI scores were roughly similar,
with positive AMI values less than 0.02. These
weakly positive scores indicate that Node2Vec
may be capturing some minor structural correlations in the graph, such as political leanings and
affiliate websites
trust score).
(which would
share a similar
The AMI equation is the same as MI, except it is
normalized by a factor such that clusterings with
a higher number number of clusters k do not have
a higher AMI score.
Interestingly, using a weighted graph did not
strictly improve or hinder the clustering performance of an embedding. For instance, for the
Node2Vec embeddings with localized features (p
= 0.1, q = 1), the average AMI score was greater
This score will be 1 (when 2 partitions are iden-
in Glarge,unweighted
tical). However, random partitions (i.e. data that
was labelled independently) are expected to have
an adjusted mutual information score of 0 on average (so negative values are possible).
We chose this score since it has a special property that the metric is independent of the absolute value of the labels. For example, a clustering assignment with 2 clusters that assigned
all *fake” news as ’real” and all ’real” news as
”fake” would still have a perfect AMI score of 1.
To compute the AMI score, we need to identify a
*true clustering” of our nodes to compare against
the unsupervised clustering assignment. Since
our node labels are a continuous number be-
than
in Glarge,weighted>
but
with the Node2Vec embeddings with global features (p = 1, q = 0.1), the reverse is true.
graph type
Gsmall unweighted
small weighted
Garge
unweighted
Gharge weighted
| average AMI
| # clusters
0.00109
8
0.01096
7
0.00759
14
0.01225
9
Figure 3: Calculated Adjusted Mutual Information of Clusters,
averaged
over
100
iterations,
from using Node2Vec embeddings (walk length
=5, p= 1,q=0.1) and k-means with cosine distance. The cluster count is the mode number over
the iterations.)
s0
ee
°
&
«se.
es_
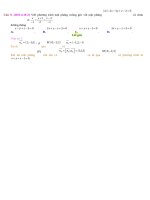
graph (eg, communities and adjacent nodes), it
is possible that the Struc2 Vec embeddings miss
out on important information that Node2Vec
gleans. For instance, related news stations such
as MSNBC provides news coverage from NBC
Trust Score >= 0.75
Trust SẴcore <= 0.25
0.25 < Trust Score <0.75
20
o0
(and both of these sources are in our labeled
dataset). Because of this relation, MSNBC of-
-20
-40
ten links to NBC
-60
-80
and since the content is simi-
lar, MarketWatch gives both similar trust scores,
100100
-50
°
50
100
Figure 6: 2D Visualization of the Struc2Vec
embeddings for the 31 labeled nodes in
Giarge,weighted» Colored according to a range of
trust scores.
graph type
_| average AMI
| # clusters
Gsmall unweighted
0.006487
Gsmall weighted
0.0127
9
0.0115
15
0.00447
14
large unweighted
Giarge weighted
13
Figure 4: Calculated Adjusted Mutual Information of Clusters,
averaged
over
100
iterations,
from using Node2Vec embeddings (walk length
=5, p=0.1, q= 1) and k-means with cosine distance. The cluster count is the mode number over
the iterations.)
6.2.2
Struc2Vec
Compared to Node2Vec, Struc2Vec performed
more poorly in clustering the news sources (in an
unsupervised manner) by their trust scores. The
AMI scores for all graphs were negative, indicating random and possibly worse than random
clusterings.
graph type
Gmail
unweighted
mail weighted
| average AMI
| # clusters
2
-0.0117
-0.002585
2
Garge unweighted
-0.04019
12
Giarge weighted
-0.03931
7
Figure 5: Calculated Adjusted Mutual Information of Clusters,
averaged
over
100
iterations,
from using Node2Vec embeddings (walk length
=5, p=0.1, q= 1) and k-means with cosine distance. The cluster count is the mode number over
the iterations.)
We can visualize the node embeddings using tsne, which maps the 128 dimension Struc2Vec
embeddings into 2 dimensions.
Since Struc2Vec embeddings are biased towards
structural similarity rather than locality within a
with a trust score difference of < 0.1.
Since Node2Vec uses random walks over the
original graph, the random walks would capture
some information about local or adjacent nodes,
to a varying extent depending on the p and q
values. Struc2Vec, however, performs random
walks over its own constructed graph, whose
edges relate to structural similarity.
Thus, it
is possible that Struc2Vec finds adjacent nodes,
which may have similar trust scores, such as with
the msnbc
and
nbc example,
to not be similar
structurally and give dissimilar embeddings.
6.2.3
Spectral Clustering
We apply the spectral method to obtain the
optimal number of clusters for our small
(un)weighted graphs and large (un)weighted
graphs. As shown in Figure 7, for our small
unweighted and unweighted graphs, we obtain a
fairly high number of clusters 12 and 14, respectively. Our initial evaluation is that in the smaller
graph, there may not enough data for significant clusters to appear, and as a result the optimal clustering calculated is 1-2 nodes per cluster.
In contrast, for both our large weighted and unweighted graphs, we obtain optimal cluster size
of 2. This is likely because with more nodes (and
therefore more data), we are more able to iden-
tify a latent grouping in the nodes (i.e. 2 clusters:
one ’fake” new grouping that often cites within
this network, and one ’real” article grouping).
However, upon clustering our respective graphs
with the calculated optimal k, we realize that calculated AMI scores are all fairly low. For the
clusterings on both small graphs, the respective
AMI scores are both negative, indicating that the
labels assigned to the nodes from the clustering
appears to be random. On the other hand, the
AMI score of the clusterings computed on the
large graph is slightly positive, indicating that
the labels assigned by the clustering on the larger
graph is slightly less random and may be capturing minor latent features.
6.3
Discussion
Overall, it appears that clustering performed on
the generated Node2Vec embeddings yielded the
graph type
Gmail
|
unweighted
small weighted
average AMI
# clusters
-0.0337192494
12
-0.04663785
162
14
Giarge unweighted | 0.003034750342
2
S. 2017.
News
”These
Sources
are the Most
in the U.S.”
and Least
In Marketwatch
/>
most-and-the-least-trusted-news-sources-in-the-us-
Figure 7: Calculated Adjusted Mutual Informa-
tion of Clusters, averaged over 100 iterations, via
Spectral Clustering
best results (with the highest AMI
scores).
We
hypothesize that this is due to minor correlations
between adjacent nodes and trust scores; this hypothesis is explained in greater depth in the results section for Struc2Vec.
7
Chang,
Trusted
-
2
2.51 x 10716
Giarge weighted
References
2017-08-03.
Gates, A.; et al. 2017.
The Impact of Random
Mod-
els on Clustering Similarity. In Journal of Machine
Learning Research 18, pp 1-28.
Grover, A.; et al. 2016.
Node2Vec:
Scalable Feature
Kumar,
S.; et al.
Disinformation on the Web:
Kumar,
S; et al. 2018.
Learning for Networks. In Proceedings of the 22nd
ACM SIGKDD International Conference on Knowledge Discovery and Data Mining.
2016.
Impact, Characteristics, and Detection of Wikipedia
Hoaxes. In Proceedings of the 25th International Conference on World Wide Web, pp. 591-602.
False Information on Web and
Social Media: A Survey. In Social Media Analytics:
Advances and Applications.
Conclusions and Future Work
Luxburg, U.; et al. 2007. A Tutorial on Spectral Clustering. In Statistics and Computing, vol. 17.4.
Over our experiments, we were not able to get
Statistically significant clusterings based on the
Marketwatch labelings. This result goes against
what we would expect from previous studies,
Ng, A.; et al. 2001. On Spectral Clustering: Analysis
and an Algorithm. In Advances in Neural Information
Processing Systems, pp. 849-856. MIT Press.
find correlations between structural aspects of
the Wiki Hoaxes graph such as ego-network
clustering coefficient and probability of being a
hoax. If this sort of correlation between egonetwork clustering and trust score were true
with our graph, embeddings such as Node2Vec
and Struc2 Vec embeddings would have captured
some of this correlation and structure.
Ribeiro,
such
as with
Kumar
et al.,
who
were
able
to
In terms of future directions, it may be fruitful
to examine graphs that correspond to true fake
news instead of the MarketWatch trustworthiness score, which does not differentiate between
biased news articles and misinformation news ar-
ticles.
For instance, the Huffington Post has a
low trust score of 0.2 (out of 1), which is very
similar to the trust score of 0.1 for Infowars.com.
While the Huffington Post might be biased, its
news sources would be considered less trustwor-
thy, rather than ’’fake” as the articles from Infowars would be.
These different flavors of untrustworthy news
can make it difficult to capture similarities in
graph structure.
The graph embedding for a
*less trustworthy” news source and a ”misinformation” news source may be divergent. Future
directions that focus only on ”less trustworthy”
news from mainstream websites or only on misinformation articles, may lead to more promising
results.
Paranjape A.; et al. 2017. Motifs in Temporal Networks. In Proceedings of the Tenth ACM International
Conference on Web Search and Data Mining (WSDM
17). ACM, New York, NY, USA, 601-610. DOI:
/>L.; et al.
2017.
Struc2Vec:
Learning Node
Representations from Structural Identity.
Shi, J.; et al. 2000.
Normalized Cuts and Image Seg-
mentation. In IEEE Transactions On Pattern Analysis
and Machine Intelligence, vol. 22, no. 8.
Shu, K.; et al. 2018. Studying Fake News via Network Analysis: Detection and Mitigation.
CoRR,
abs/1804.10233.
Volkova, S.; et al. 2017. Separating Facts from Fiction: Linguistic Models to Classify Suspicious and
Trusted News Posts on Twitter. In Proceedings of the
55th Annual Meeting of the Association for Computational Linguistics (Volume 2: Short Papers), vol. 2,
pp. 647-653. 2017