Structure and regeneration characteristics of manfrove forest in tien hai district, thai binh provice
Bạn đang xem bản rút gọn của tài liệu. Xem và tải ngay bản đầy đủ của tài liệu tại đây (651.99 KB, 33 trang )
ACKNOWLEDGEMENTS
Firstly, I would like to express my sincere gratitude to my advisor Dr. Pham Minh
Toai for constant support and valuable guidance during the time of research and writing of
this thesis.
Secondly, I would also thank to various professors of Vietnam Forestry University
and Colorado State University, especially to Professor Lee MacDonald for providing
classes and guidance for this project.
Thirdly, I would like to thank Manager of Resources and Environment Department,
Leaders of People’s Committee in Dong Long, Nam Hung, Nam Thinh commune and
dwellers who live in Tien Hai district. They provided good conditions when I conducted
my research.
Last but not least, I would like to thank my family for giving birth to me and
supporting me spiritually throughout my life.
TABLE OF CONTENTS
I. INTRODUCTION .............................................................................................................. 1
II. GOAL AND OBJECTIVES .............................................................................................. 3
2.1. Goals ............................................................................................................................... 3
2.2. Specific objectives .......................................................................................................... 3
III. STUDY AREA AND METHODS ................................................................................... 4
3.1. Study area ....................................................................................................................... 4
3.2. Study methods................................................................................................................. 5
3.2.1. Preliminary survey........................................................................................................................ 5
3.2.2. Data collection .............................................................................................................................. 5
3.2.3. Data analysis ................................................................................................................................. 7
IV. RESULTS AND DISCUSSIONS .................................................................................... 9
4.1. Characteristics of canopy layer ....................................................................................... 9
4.1.1. Species composition of canopy layer........................................................................... 9
4.1.2. Density of trees in canopy layer ................................................................................ 10
4.1.3. Canopy cover ............................................................................................................. 12
4.1.4. Characteristics of the growth of mangroves .............................................................. 12
4.2. Characteristics of regeneration ..................................................................................................... 15
4.2.1. Species composition and density of trees regeneration .......................................................... 15
4.2.2. Impacts of some factors on regeneration mangrove species .................................................. 18
4.3. Some solutions for sustainable development of mangroves in Tien Hai district, Thai
Binh province ....................................................................................................................... 21
ii
4.3.1. Afforestation ................................................................................................................................ 21
4.3.2. Forest protection ......................................................................................................................... 23
4.3.3. Policies in forest management and protection ......................................................................... 23
V. CONCLUSION ............................................................................................................... 24
5.1. Characteristics of canopy layer ..................................................................................... 24
5.2. Characteristics of regeneration ..................................................................................... 24
5.3. Some ecological factors affect to regeneration ............................................................. 24
REFERENCES .................................................................................................................... 25
iii
LIST OF TABLES
Table 3.1. Field data sheet to survey the canopy layer .......................................................... 6
Table 3.2. Field data sheet to survey the regenerated trees .................................................... 7
Table 4.1. Species composition of trees in canopy layers...................................................... 9
Table 4.2. Mean density of trees in canopy layer at the study area ..................................... 11
Table 4.3. Growth parameter of trees in canopy layer ......................................................... 13
Table 4.4. Quality of trees in the canopy layer .................................................................... 14
Table 4.5. Species composition and mean density of the regenerated trees ........................ 15
Table 4.6. Distribution of regenerated trees at four height levels ........................................ 17
Table 4.7. Number of regenerated trees on substratum ....................................................... 19
iv
LIST OF FIGURES
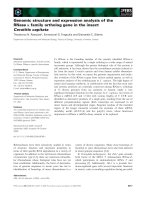
Figure 3.1. Locations of study areas ...................................................................................... 4
Figure 4.1. Mean growth of mangrove forest ...................................................................... 13
v
LIST OF PICTURES
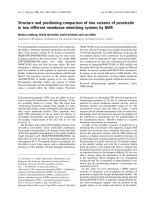
Picture 4.1. Mangrove community of Trang – Ban – Su ..................................................... 10
Picture 4.2. Division of branches of Trang .......................................................................... 11
Picture 4.3. Regeneration of Trang in plant communities of Trang-Ban-Su ....................... 17
Picture 4.4. Barnacles stick on a regenerated tree ............................................................... 20
Picture 4.5. Dwellers in Nam Thinh digged oysters in mangrove forest ............................. 21
Picture
4.6.
(a)
Flower
of
Sonneratiasp.,
(b)
Fruit
of
Sonneratiasp.;
(c) and (d) Sonneratiasp. ....................................................................................................................... 22
vi
ABBREVIATION
No.
Abbr.
Explaination
1
A
Good quality tree
2
B
Medium quality tree
3
C
Bad quality tree
4
Ban
Sonneratia caseolaris
5
D1.3
Diameter at breastheight
6
D00
Root collar diameter of a tree
7
Dt
Canopy diameter
8
Hvn
Tree height
9
N
Density
10
Su
Aegyceras floridum
11
SE
Standard error
12
SD
Standard deviation
13
Trang
Kandelia obovata
vii
ABSTRACT
Mangrove forest plays an important role in protecting shorelines from damaging
storm, hurricane, winds, waves and upgrading people’s standard of living. Protecting and
restoring mangrove forest will improve the life of people in the region and help cope with
climate change in the coastal regions. In Tien Hai district, Thai Binh Province, total area of
planted mangrove forest is about 1,571.95ha. This forest type is distributed at the coastal
regions; include three communities of pure plantation of Trang, a mixed plantation of
Trang – Ban and a mixed plantation of Trang – Ban - Su. The diversity of species
composition is relative simple with predominance of Trang. Density and canopy cover of
mangrove forest are quite high and like density and growth of regeneration. The ecological
elements such as water salinity, tide and soil affect the distribution of species and the
growth ability of mangrove forest.
Key words: mangrove forest, plantation, growth, regeneration, Thai Binh
1
I. INTRODUCTION
Mangrove forest ecosystem is amongst the most important and productive of
ecosystems and is often found along coastal areas and offshore islands. This ecosystem
provides food and nursery grounds for many commercially important aquatic and
terrestrial animals. In addition, it stabilizes coastal lines, promotes coastal accretion and
provides a natural barrier against storms, cyclones, tidal bores as well as other potentially
damaging natural forces. For centuries, mangroves have contributed significantly to the
socio-economic lives of coastal dwellers in Vietnam. They have been not only traditionally
exploited as building materials, charcoal, firewood, tannin, food, honey, herbal medicines
and many other forest products which create stable jobs and income for dwellers in coastal
areas. This indicated that mangrove forests maintain the diversity of aquatic resources for
coastal region. Although mangrove forests of Vietnam are not as abundant in biological
diversity as are other ecosystems such as inland tropical rainforests, they provide habitats
for species which are adapted to a saline tidal environment. The mangroves also provide
habitats for large numbers of diverse migratory waterfowl and terrestrial animals and are
very important as habitats of aquatic organisms such as algae, mollusks, Brachyura,
Decapoda.
Tien Hai, a coastal district, is located about 23 kilometers in the southeast coastal of
Thai Binh province, 3 major estuaries flowing into sea such as Ba Lat river of Red River,
Tra Ly river and Lan river, so the alluvial soil has accreted and formed more than 6,000
hectares alluvial ground, coastal wetlands with richness and diversity of fauna and flora,
including Tien Hai Nature Reserve.
1
Like many other mangroves, roles and functions of mangrove ecosystem in Tien
Hai are very important, especially in providing coastal protection against the actions of
tidal, waves, wind and water currents, natural disasters. But now, mangrove forests are
threatened by climate change like natural disaster, exploitation and overuse of human
activities. These issues have made the changes of structure and growth of mangrove
communities, which the causes of change in habitat and species composition, degradation
of mangrove resources and ecological imbalance. For these reasons, solutions for
afforestation, reforestation and rehabilitation based on the thorough advantages of natural
regeneration which are consistent with natural conditions, economic and society, are very
necessary. In addition, due to the importance of mangroves, many policies and projects
have been developed and implemented in the coastal communes of Tien Hai district to
protect and restore mangroves. Therefore, research on forest structure and regeneration
characteristics of mangrove forest in Tien Hai district, Thai Binh province in order to
provide data and scientific research for rehabilitation and development this forest type in
study areas in sustainable ways is needed.
2
II. GOAL AND OBJECTIVES
2.1. Goals
The goal of this research is to complement the understanding about forest structure
and regeneration characteristics of mangrove areas in order to propose some solutions for
sustainable protection and development of mangrove forest in Tien Hai district, Thai Binh
province.
2.2. Specific objectives
Specific objectives of this study are to:
Assess structure and growth characteristics of the canopy layer;
Assess growth of regenerated trees and some factors affected to regeneration;
Propose some solutions in order to rehabilitate and develop mangrove forests in
sustainable ways.
3
III. STUDY AREA AND METHODS
3.1. Study area
The study sites are mangrove forest and barren lands in front of sea dykes of Tien
Hai, located from Tra Ly estuary to Ba Lat estuary, under the territory of three coastal
communes of Tien Hai: Nam Thinh, Nam Hung and Dong Long. The reasons why these
areas selected as the study sites are the largest mangroves areas of Tien Hai with the high
density of mangrove forest. All mangrove forest areas are planted forests,which funded by
Japan Red Cross Society cooperated with Red Cross of Tien Hai District and Thai Binh
province. Where mangroves of Nam Thinh and Nam Hung are known as the special use
forests and mangroves of Dong Long are known as the protective forest.
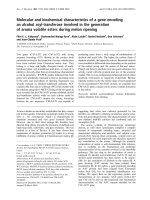
Figure 3.1. Locations of study areas
4
3.2. Study methods
3.2.1. Preliminary survey
- References of some documents of study areas about tide-tables, using maps of land use,
project, some information supported from Tien Hai Resources and Environment
Department and People’s Committee of three communes in study areas.
- Carry out field research three coastal communes with total area of 1,571.95ha mangrove
forest. Since then, select three specific communities of study areas with the representative
species and an area of more than 100ha, including 100ha pure plantations of Trang in Nam
Thinh commune, 157.3 ha a mixed plantations of Trang – Ban in Dong Long and 449.22ha
a mixed plantation of three species Trang – Ban – Su in Nam Hung commune.
3.2.2. Data collection
Each typical plant communities, setting up 3 transects parallel to the coast, in the
inward direction from the sea edge to dike footing. On each transect, 10 sample plots of
400m2 (20x20m) were randomly located. Due to statistical rule, total number of sample
plots that were set up in each survey area is 30 plots.
a. Study the characteristics of canopy layer
- Survey the canopy layer trees as follows: name of mangrove species, diameter at the
breast-height (D1.3), tree height (Hvn), canopy diameter (Dt) and tree quality. Collected data
is recorded in table as follow.
5
Table 3.1. Field data sheet to survey the canopy layer
Survey area:……………………….Transect number:…………………..
Plot number:…………………..…...Areas…………………………..m2
Date of suvey:……………………..Investigator:…………………………..
No.
Species
𝑫𝟏.𝟑 (cm)
Hvn (m)
Dt (m)
Tree
quality
1
2
…
Quality of canopy trees is divided into three levels in which, Good quality trees (A)
have good growth quality, strait form and have no diseased. Bad quality trees (C) have
poor growth, diseased and broken branches. Medium quality trees (B) are the intermediate
level of A and C.
In the field, canopy cover of forest was determined by estimation methods. Within
each plot, 50 points were randomly selected to observe canopy types. At each point if one
can see main foliage at the top crown, that point will get value of 1.0. If investigator sees
the canopy edge and empty space, these points will get values of 0.5 and 0 respectively.
Finally, canopy cover ratio is a mean value of 50 points.
b. Survey characteristics of regeneration:
During field study, some main parameters including name of species, root collar
diameter of a tree (Doo),tree height and canopy diameter were identified using normal
forest survey methods. In which, tree height was classified into four different level
including Hvn≤ 0.5m, 0.5 < Hvn ≤ 1m, 1< Hvn <1.5m and Hvn > 1.5m.
Collected data was recorded in following table:
6
Table 3.2. Field data sheet to survey the regenerated trees
Survey area:……………………….Transect number:…………………..
Plot number:…………………..…...Areas…………………………..m2
Date of survey:……………………..Investigator:…………………………..
No.
Species
Hvn (m)
𝑫𝟎𝟎 (cm)
≤ 0.5
0.5÷1
1÷ 1.5
>1.5
1
2
…
c. Survey some factors affect to the regenerated trees:
Some factors affect to the regenerated trees such as canopy cover, substratum,
salinity and other factors as sea weed, marine-fouling organisms and human activities.
These information were investigated during field survey.
- Canopy cover was determined by estimation method.
- Data of substratum and salinity was collected from Resources and Environment
Department of Tien Hai.
3.2.3. Data analysis
After collecting data in field work, data is analyzed and calculated by Excel software:
a. Characteristics of the canopy layer
-
Species composition of the canopy layer
Composition coefficient:
𝑛∗10
K=
𝑁
Where: K is composition coefficient of species; n is number of specific species; N
is total number of species in a plot.
Composition coefficient consists of both letters and numbers, in which numbers are
7
arranged and wrote from the highest number to the lowest number, and letters are the
abbreviation of name of species and wrote after numbers.
-
Tree density of the canopy layer: N/ha =
Where:
-
𝑁∗10000
𝑆
N is total number of trees in one plot; S is plot area
Quality of trees in the canopy layer plants: (A,B,C) % = ( Ni/N ) / 100
Where: A, B, C are quality of trees; Ni is number of trees; N is total number of trees.
-
Growth of the canopy layer: Calculate standard deviation and standard error are two
parameters which refer to variation of sample mean in a population mean, meaning
the difference levels of sample mean. Calculate mean value of density, diameter at
breast height, diameter at crown canopy, height of tree in each plot.
b. Characteristics of the regenerated trees
-
Species composition of the regenerated trees:
Composition coefficient: Ki =( ni * 10 ) / m
Where Ki is composition coefficient of the ith species
ni is total number of individuals in the ith species
m is total number of individual of all species
-
Tree density of the regenerated trees: N/ha = ( N * 10000) / S
Where N is total number of individual in a plot; S is plot area
-
Height distribution of the regenerated trees: Di = (ni / M) / 100
Where Di is distribution of regenerated trees at height level i
ni is the number of regenerated trees at height level i
M is total number of regenerated trees in a plot
c. Evaluate structure and regeneration of mangroves based on data collection and write
report.
8
IV. RESULTS AND DISCUSSIONS
4.1. Characteristics of canopy layer
4.1.1. Species composition of canopy layer
Species composition is one of the most important ecological elements that used to
assess biodiversity, stability of forest ecosystem, refers to species composition and
appearance of plants components of forest plants communities. Based on number of
species and species composition, we may classify into pure stands or mixed stands.
Through survey the growth of mangroves showed that rate and quantity of each mangrove
species in mangrove communities are different and summarized in table 4.1 as follows
Table 4.1. Species composition of trees in canopy layers
Study area
Transect number
Trang
Mean
Trang – Ban
Trang- Ban - Su
Species composition
10Trang
1
9.32Trang + 0.68Ban
2
9,17Trang + 0.83Ban
3
9.55Trang + 0.45Ban
Mean
9.35Trang + 0.65Ban
1
9.17Trang + 0.14Ban + 0.69Su
2
9.41Trang + 0.12Ban + 0.47Su
3
8.75Trang + 0.36Ban + 0.97Su
Mean
9.11Trang + 0.21Ban + 0.71Su
The pure plantation of Trang is in a good growth and development, high density on silt
while a mixed plantation between Trang – Ban in which Trang is dominant species with
composition value of 9.17 ÷ 9.55, only grow onshore. Ban is planted at the sea edge and
9
inshore at the lowest composition value of 0.45 ÷ 0.83. In addition, people usually plant
Casuarina equisetifolia near dike footing to reduce salinity in soil.
In mixed plantation of Trang – Ban –Su: Trang is dominant species with
composition value of 8.75 ÷ 9.17; Su grows mostly at sea edge and along the canal with
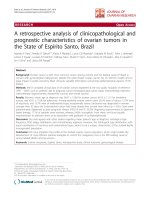
composition value of 0.47 ÷ 0.97. Especially, Ban Myanmar has height of 20 meters with
the advantages of non-deciduous in winter, broad canopy and high salt tolerance.
Picture 4.1. Mangrove community of Trang – Ban – Su
In summary, on transect lines the appearance of some mangrove trees at shoals and
along the dike footing, such as Ipomoea pescaprae, Portulaca oleracea, Cynodon
dactylon, Casuarina equisetifolia. Also, planting Casuarina equisetifolia and Hibiscus
tiliaceus on high ground without tidal.
4.1.2. Density of trees in canopy layer
Tree density indicates the number of individual per hectare. This is an important
factor impacts on process of forest formation and the potential growth and competition for
survival among individuals in stands.
The survey results of mangroves density in study areas are shown in table
10
Table 4.2. Mean density of trees in canopy layer at the study area
Study area
Trang
Trang - Ban
Trang – Ban - Su
Tree density
Transe
ct
Individual/plot
Individual/ha
1
263
6,575
2
354
8,850
3
301
7,525
Mean
306
7,650
1
105
2,732
2
125
3,125
3
132
3,300
Mean
121
3,052
1
246
6,150
2
332
8,300
3
255
6,375
Mean
278
6,942
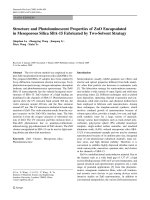
Survey results of canopy layer's tree density in study areas show that pure
plantations of Trang has the mean highest density of 7,650 trees/ha, where trees grow
mostly in height. Survey in field work knew that with each foot of one Trang is divided
into 2 -3 branches growing and developing as an independent tree in the dense plot.
Picture 4.2. Division of branches of Trang
11
Besides that, mangrove community of Trang – Ban has the lowest density. It may
because Ban grows the largest diameter at breast-height in most of mangrove species, thus
their presence limit the growth of other species and occupy a large amount of nutrient.
Overall, in the same species, density not only depends on the growth of species but
the stages of growth and development of forests. The older forest is, the less density of
trees is by laws of natural selection.
4.1.3. Canopy cover
Canopy cover is an important structural indicator of forest status represented the
coverage of forest on the soil surface, which affected to regeneration, growth and
development of seedlings by light. The study results showed that the pure Trang plantation
has the highest coverage while canopy cover of the pure plantation of Trang is 0.92, a
mixed plantation of Trang – Ban is 0.83 and mixed plantation of Trang – Ban – Su is 0.90.
4.1.4. Characteristics of the growth of mangroves
Study the growth in height and diameter is to find out the growth stages of
mangrove species from which choose the suitable silvicultural measures to grow the yields
of mangrove trees, also the change in the growth stages of mangroves. In study areas, the
growth characteristics of mangrove communities are shown in table:
12
Table 4.3. Growth parameter of trees in canopy layer
D1.3(cm)
Hvn (m)
Dt (m)
Study area
Mean
SE
SD
Mean
SE
SD
Mean
SE
SD
Trang
4.3
0.4
2.5
2.2
0.2
1.0
1.3
0.2
1.2
Trang – Ban
4.7
0.7
4.2
2.8
0.3
2.0
1.6
0.1
1.5
Trang – Ban - Su
4.0
0.5
2.6
2.5
0.3
1.7
1.3
0.3
0.7
Growth of plant communities in study areas represents in diameter at breast-height,
height and diameter at canopy. Growth of each community is different clearly. Both of
Trang and Trang – Ban have an equal growth ability. In pure plantation of Trang, mean
growth of mangrove species in D1.3= 4.3m, Hvn = 2.2 m and Dt = 1.3m. In a mixed
plantations, mean growth of mangrove species in D1.3 = 4 m, Hvn = 2.5m and Dt = 1.3 m
while mixed plantation of Trang – Ban has the most mean growth of mangrove species
with D1.3= 4.7m, H = 2.8m and D.canopy = 1.6m.
5.0
4.5
4.0
3.5
3.0
Trang
2.5
Trang - Ban
2.0
Trang - Ban - Su
1.5
1.0
0.5
0.0
D13
H
D.canopy
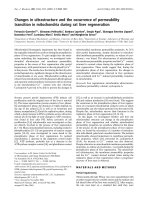
Figure 4.1. Mean growth of mangrove forest
Research results in the Figure 4.1 shows that the growth of mangrove species in the
different mangrove communities is represented by diameter at breast-height, diameter of
13
canopy and height. The more growth in height grows, the more growth in diameter at
breast-height grows. In which the growth in plant communities of Trang – Ban is the
largest, and plant community of Trang – Ban – Su is the lowest.
Quality of trees in the canopy layer plants is shown in table 4.4. In pure plantation
of Trang, the percentage of good quality trees is 53%, bad quality trees 11 % and medium
quality trees 36%. In a mixed plantation of Trang – Ban, the percentage of good quality
trees is the lowest 35 %, bad quality trees 17%. In a mixed plantation of Trang – Ban – Su,
the percentage of good quality trees is the highest 55 %, bad quality trees 13%.
Therefore, the majority of trees have the good quality. There is a small proportion of bad
quality trees remaining in the community.
Table 4.4. Quality of trees in the canopy layer
Quality (%)
Study area
A
B
C
Trang
53
36
11
Trang – Ban
35
48
17
Trang – Ban - Su
55
32
13
Survey results show that the mangrove forests are still developing in study areas.
However, the difference in density leads to the difference clearly in formation of forest,
due to the difference site conditions, such as soil texture, thickness of sediment, salinity,
and tidal fluctuation from which the characteristics of the tree growth reflect the difference
in density, make a difference in the difference conditions of forest. In status of the thick
forests, trees must compete with other trees for nutrition, sunlight so trees grow higher than
in the thin forests. And in the thin forest of plant community of Trang - Ban, trees have
enough nutrition and light to develop in diameter, have many branches, broaden canopy,
14
typically Sonneratia caseolaris. Besides, a mixed community of Trang – Ban –Su is
flooded in water in a long time, the roots of trees are broaden because spongy tissues
absorb water from the pore-water of roots.
4.2. Characteristics of regeneration
4.2.1. Species composition and density of trees regeneration
With mangrove ecosystem, tree regeneration formed by propagates growing before
dropping from the parent trees, which each propagate may be lying horizontally on the
sediment or standing up and covered by water during this time. When the seedling falls
from the parent tree, it seems to plant itself in the sediment under the parent tree, but more
often it is dispersed further away by the tidal action as the method of dispersal to avoid
crowding of young plants. The position where propagates stranded finally will be a place
for regenerated trees to develop.
Table 4.5. Species composition and mean density of the regenerated trees
Study area
Trang
Trang – Ban
Trang – Ban -Su
Transect
Density
(trees/ha)
Species composition
1
745
10Trang
2
685
10Trang
3
785
10Trang
Mean
738
10Trang
1
780
9.27Trang + 0.73Ban
2
775
9.74Trang + 0.26Ban
3
710
9.80Trang + 0.20Su
Mean
755
9.60Trang + 0.40Su
1
740
9.31Trang + 0.69Su
2
715
9.74Trang + 0.26Su
3
800
9.44Trang + 0.56Su
Mean
752
9.50Trang + 0.50Su
15
a. Species composition
Survey indicated that regenerated trees in three study areas are mainly in the stage
of propagates. Regenerated trees’ height is differentiated clearly at height level. The
number of regenerated trees grows mainly regeneration of Trang under the parent trees,
distributed at sea edge and dike edge. There is no regeneration of Ban in plant community
of Trang – Ban – Su due to high density of canopy layer trees, small seedlings, poor
growth in cold weather; only grow in low salt concentrations (5-15𝑜⁄𝑜𝑜 ). On transect
number 02 of plant communities of Trang – Ban and Trang – Ban - Su, the high growth
and density are causes of less regenerations.
Clearly, most saplings in canopy layer are representing in the regenerated trees
layer. And there is not significant change in mangrove species-community in the future.
b. Density
In wetlands, mangrove trees have the different forms of regeneration. Su and Trang
regenerated by propagules beneath the parent trees, there is no regeneration of Ban.
Survey results on transect number 03 of plant communities of Trang – Ban – Su has
the highest density of regeneration is 800 trees/ha and all three study areas, tree
regeneration grows the high density inward of dike footing.
16
Picture 4.3. Regeneration of Trang in plant communities of Trang-Ban-Su
c. Distribution of regenerated trees
Table 4.6. Distribution of regenerated trees at four height levels
Study areas
Trang
Trang – Ban
Trang – Ban - Su
Transect
Distribution (%)
≤ 0.5
0.5 ÷≤1.0
1.0÷ 1.5
>1.5
1
63.5
35.6
0.9
0
2
42.7
48.6
0
0
3
73.9
25.2
0
0
Mean
60.0
36.5
0.3
0
1
57.4
40.5
2.1
0
2
65.7
33.7
0.6
0
3
60.9
39.1
0
0
Mean
61.3
37.3
0.9
0
1
66.4
31.4
2.2
0
2
70.8
28.3
0.9
0
3
75.2
24,1
0.7
0
Mean
70.8
27.9
1.3
0
17