- Trang chủ >>
- Khoa Học Tự Nhiên >>
- Vật lý
holocene extinctions sep 2009
Bạn đang xem bản rút gọn của tài liệu. Xem và tải ngay bản đầy đủ của tài liệu tại đây (4.43 MB, 365 trang )
Holocene Extinctions
Dedicated to the memory of the Yangtze River dolphin
More should have been done
Holocene Extinctions
EDITED BY
Samuel T. Turvey
Institute of Zoology
Zoological Society of London
1
3
Great Clarendon Street, Oxford OX2 6DP
Oxford University Press is a department of the University of Oxford.
It furthers the University’s objective of excellence in research, scholarship,
and education by publishing worldwide in
Oxford New York
Auckland Cape Town Dar es Salaam Hong Kong Karachi
Kuala Lumpur Madrid Melbourne Mexico City Nairobi
New Delhi Shanghai Taipei Toronto
With of ces in
Argentina Austria Brazil Chile Czech Republic France Greece
Guatemala Hungary Italy Japan Poland Portugal Singapore
South Korea Switzerland Thailand Turkey Ukraine Vietnam
Oxford is a registered trade mark of Oxford University Press
in the UK and in certain other countries
Published in the United States
by Oxford University Press Inc., New York
© Oxford University Press 2009
The moral rights of the author have been asserted
Database right Oxford University Press (maker)
First published 2009
All rights reserved. No part of this publication may be reproduced,
stored in a retrieval system, or transmitted, in any form or by any means,
without the prior permission in writing of Oxford University Press,
or as expressly permitted by law, or under terms agreed with the appropriate
reprographics rights organization. Enquiries concerning reproduction
outside the scope of the above should be sent to the Rights Department,
Oxford University Press, at the address above
You must not circulate this book in any other binding or cover
and you must impose the same condition on any acquirer
British Library Cataloguing in Publication Data
Data available
Library of Congress Cataloging in Publication Data
Data available
Typeset by Newgen Imaging Systems (P) Ltd., Chennai, India
Printed in Great Britain
on acid-free paper by
CPI Antony Rowe, Chippenham, Wiltshire
ISBN 978–0–19–953509–5
10 9 8 7 6 5 4 3 2 1
In the deep discovery of the Subterranean world, a shallow part
would satis e some enquirers . . . The treasures of time lie high.
Sir Thomas Browne (1605–1682)
Hydriotaphia: Urne-Burial or, A Brief Discourse of the
Sepulchrall Urnes Lately Found in Norfolk
This page intentionally left blank
vii
Preface ix
A note on radiocarbon dating conventions xi
List of contributors xii
1 An introduction to Late Glacial–Holocene environments 1
Anson W. Mackay
2 In the shadow of the megafauna: prehistoric mammal and bird
extinctions across the Holocene 17
Samuel T. Turvey
3 Holocene mammal extinctions 41
Samuel T. Turvey
4 Holocene avian extinctions 63
Tommy Tyrberg
5 Past and future patterns of freshwater mussel extinctions in North America
during the Holocene 107
Wendell R. Haag
6 Holocene extinctions in the sea 129
Nicholas K. Dulvy, John K. Pinnegar, and John D. Reynolds
7 Procellariiform extinctions in the Holocene: threat processes and wider
ecosystem-scale implications 151
R. Paul Scofield
8 Coextinction: anecdotes, models, and speculation 167
Robert R. Dunn
9 Probabilistic methods for determining extinction chronologies 181
Ben Collen and Samuel T. Turvey
10 The past is another country: is evidence for prehistoric, historical, and
present-day extinction really comparable? 193
Samuel T. Turvey and Joanne H. Cooper
11 Holocene deforestation: a history of human–environmental interactions,
climate change, and extinction 213
Rob Marchant, Simon Brewer, Thompson Webb III, and Samuel T. Turvey
Contents
viii CONTENTS
12 The shape of things to come: non-native mammalian predators and the
fate of island bird diversity 235
Julie L. Lockwood, Tim M. Blackburn, Phillip Cassey, and Julian D. Olden
13 The Quaternary fossil record as a source of data for evidence-based
conservation: is the past the key to the future? 249
John R. Stewart
14 Holocene extinctions and the loss of feature diversity 263
Arne Ø. Mooers, Simon J. Goring,
Samuel T. Turvey, and Tyler S. Kuhn
References 279
Index 339
ix
also allow us to begin to appreciate the true extent
of human-caused extinctions throughout the Late
Quaternary.
This book hopes to encourage such research,
and to provide a stepping stone towards a better
understanding of human impacts both past and
present, by presenting an overview of the state of
our current knowledge of what we have already
lost during the Holocene. Although the major-
ity of research in this eld has been conducted
into the timing, causation, and magnitude of past
human-caused extinctions of mammals and birds,
two groups which inevitably again receive a dis-
proportionate amount of attention in this book
relative to their overall contribution to global bio-
diversity, it is also important that human impacts
to other major taxonomic groups and also to wider
ecosystems across the Holocene are not neglected,
and these have also been represented here as fully
as possible. In particular, research into changing
ecosystems and species losses across the Holocene
represents a fertile meeting ground for many aca-
demic disciplines, notably zoology, ecology, palae-
ontology, archaeology, and geography, and stronger
interconnections between these potentially dispar-
ate elds are also required to lead to the greatest
future advances in understanding regional and
global human impacts across the recent geological
past; it is hoped that this book will be read by
researchers and students from all of these differ-
ent backgrounds.
The compilation and production of this book
has been facilitated by a huge number of people.
First and foremost I must give my grateful thanks
to all of the authors who have provided their time
and expertise over the past couple of years to pre-
pare the series of chapters that together provide
a uni ed overview of the broad subject matter of
Holocene extinctions. I also wish to thank the long
The scienti c community and the wider public
have both become increasingly aware that our
world is currently experiencing an extinction crisis,
a mass extinction of comparable magnitude to the
K-T event, the end-Permian event or ‘Great Dying’,
and other rare intervals of hugely elevated extinc-
tion from the deep geological past. Although the
vast levels of biodiversity loss that are being docu-
mented today are uncontroversially recognized to
be driven by human actions, present-day species
extinctions are only the latest stage in a consider-
ably longer-term sequence of biotic impacts stretch-
ing far back into the Quaternary, which follow the
prehistoric spread of modern humans out of Africa
and into pristine ecosystems around the world.
However, large-scale faunal extinctions at the end
of the Pleistocene Epoch, which saw the disappear-
ance of much of the world’s charismatic continen-
tal vertebrate megafauna, also coincided with the
major climatically driven environmental changes
that accompanied the most recent global shift from
glacial to interglacial conditions, and character-
izing the role of humans in the end-Pleistocene
extinctions has been the subject of intense debate
for over a century. In contrast, the subsequent
geological epoch, the Holocene—approximately
the last 11 500 years from the end of the last gla-
ciation to the present day—has also seen massive
levels of extinction that have continued through-
out the recent prehistoric and historical eras, but
has conversely experienced only relatively minor
climatic uctuations. As such, the Holocene poten-
tially provides a far more useful system in which
to investigate the impacts of changing human
activities over time on different species and eco-
systems. Such research has the potential to pro-
vide unique and novel insights into the dynamics
of both the prehistoric end-Pleistocene extinctions
and also modern-day biodiversity loss, and will
Preface
x PREFACE
team at Oxford University Press who have seen
the book through its development and production
from start to nish: in particular, I need to single
out Ian Sherman and Stefanie Gehrig, who were
there from the beginning and who helped to keep
the momentum going at many key moments, and
Helen Eaton, who has ably seen the book through
to completion in its nal stages.
Samuel T. Turvey
London
October 2008
line of academic reviewers who freely gave their
invaluable constructive criticism about the various
contributions that were sent their way for perusal
and comment, and also the many colleagues who
gave me many further thoughts and suggestions
both about extinctions in the past and about being
an editor in the present. In particular, I must give
special acknowledgement here to Georgina Mace,
who provided me with such great encouragement
and support during the early stages of the book’s
preparation. Finally, my biggest thanks go to the
xi
calendar years. To calculate an accurate calendar
age, atmospheric
14
C uctuations have to be cor-
rected by means of a calibration curve obtained
by comparing raw
14
C measurements with true
calendar ages provided by independent dating
methods (e.g. dendrochronology). The current
internationally agreed radiocarbon calibration
curve, IntCal04 (Reimer et al. 2004), is character-
ized by a long-term trend with raw
14
C ages being
signi cantly younger than calendar ages during
most of the last 45 000 years (the temporal limit
of radiocarbon dating), and with superimposed
abrupt
14
C shifts which occurred over centuries to
millennia. Although modern radiocarbon studies
provide calibrated dates, older studies typically
provided only
14
C ages, and although efforts have
been made herein to minimize potential confusion,
many of the chapters in this volume have been
forced to include both types of data when review-
ing research into different extinction chronologies
across the Holocene.
Radiocarbon dating is the most common radio-
metric dating method for determining the age
of subfossil and archaeological samples from the
Holocene and Late Pleistocene. This dating method
is based on the radioactive decay of the unstable
isotope
14
C into
14
N, which has a half-life of 5568±30
years. Atmospheric
14
C is xed by plants during
photosynthesis and constantly incorporated into
living organisms, but is not incorporated after
death. Measuring the amount of
14
C that remains
in organic material provides a radiocarbon or
14
C
age that is usually reported in years before present
(years ), where ‘present’ corresponds by conven-
tion to 1950 (so that the year in which the ori-
ginal sample was dated is not needed). However,
the production of
14
C in the upper atmosphere has
varied through time, due to changes in the solar
magnetic eld. Concentrations of atmospheric
14
C
have also been in uenced by changes in ocean
circulation, especially during the Late Glacial.
Radiocarbon years are therefore not equivalent to
A note on radiocarbon dating
conventions
xii
Anson W. Mackay Environmental Change
Research Centre, Department of Geography,
University College London, Gower Street,
London WC1E 6BT, UK
Rob Marchant York Institute of Tropical
Ecosystem Dynamics, Environment
Department, University of York, University
Road, Heslington, York YO10 5DD, UK
Arne Ø. Mooers BISC and IRMACS, Simon Fraser
University, Burnaby, BC V5A 1S5, Canada;
Institute for Advanced Study, 14193 Berlin,
Germany
Julian D. Olden School of Aquatic and Fishery
Sciences, University of Washington, Box 355020,
Seattle, WA 98195–5020, USA
John K. Pinnegar Centre for Environment,
Fisheries and Aquaculture Science, Lowestoft
Laboratory, Pake eld Road, Lowestoft, Suffolk
NR33 0HT, UK
John D. Reynolds Department of Biological
Sciences, Simon Fraser University, Burnaby, BC
V5A 1S5, Canada
R. Paul Sco eld Canterbury Museum, Rolleston
Avenue, Christchurch 8013, New Zealand
John R. Stewart Department of Palaeontology,
Natural History Museum, Cromwell Road,
London SW7 5BD, UK
Samuel T. Turvey Institute of Zoology, Zoological
Society of London, Regent’s Park, London NW1
4RY, UK
Tommy Tyrberg Kimstadsvägen 37, SE-610 20
Kimstad, Sweden
Thompson Webb III Department of Geological
Sciences, Brown University, Providence, RI
02912–1846, USA
Tim M. Blackburn Institute of Zoology,
Zoological Society of London, Regent’s Park,
London NW1 4RY, UK
Simon Brewer Institut d’Astrophysique et de
Géophysique, Université de Liège, Bat. B5c, 17
Allée du Six Août, B-4000 Liège, Belgium
Phillip Cassey School of Biosciences, University
of Birmingham, Edgbaston, Birmingham B15
2TT, UK
Ben Collen Institute of Zoology, Zoological
Society of London, Regent’s Park, London NW1
4RY, UK
Joanne H. Cooper Department of Zoology,
Natural History Museum at Tring, Akeman
Street, Tring, Hertfordshire HP23 6AP, UK
Nicholas K. Dulvy Centre for Environment,
Fisheries and Aquaculture Science, Lowestoft
Laboratory, Pake eld Road, Lowestoft, Suffolk
NR33 0HT, UK; Department of Biological
Sciences, Simon Fraser University, Burnaby, BC
V5A 1S5, Canada
Robert R. Dunn Department of Zoology, North
Carolina State University, Raleigh, NC 27695,
USA
Simon J. Goring BISC, Simon Fraser University,
Burnaby, BC V5A 1S5, Canada
Wendell Haag Center for Bottomland Hardwoods
Research, USDA Forest Service, 1000 Front
Street, Oxford, MI 38655, USA
Tyler S. Kuhn BISC, Simon Fraser University,
Burnaby, BC V5A 1S5, Canada
Julie L. Lockwood Ecology, Evolution and
Natural Resources, Rutgers University, 14
College Farm Road, New Brunswick,
NJ 08901–8551, USA
List of contributors
1
considered external to the climate system. The
main natural external factors driving climate on
Earth are linked to changes in the Earth’s orbit,
changes in solar irradiance and volcanic eruptions.
The relative importance of each of these factors has
changed through time, and trying to disentangle
their in uences is challenging and often contro-
versial. Understanding the impacts of external for-
cing mechanisms provides an essential backdrop
against which extinctions can be critically assessed.
However, these external forcings are by themselves
not suf cient to account for the speed and strength
of ecosystem responses during the transition from
glacial into interglacial environments, which is
rapid and often abrupt. That is, while changes in
the Earth’s orbit force glacial–interglacial cycles, the
cycles themselves are not caused by orbital param-
eters, but rather by the Earth’s climate- system
feedback mechanisms (Maslin et al. 2001). For exam-
ple, the deglaciation of extensive ice masses requires
amplifying factors such as increases in atmospheric
greenhouse gases, especially CO
2
, changes in the
world’s ocean currents (thermohaline circulation),
and changes in land-surface albedo associated
with ice, snow, and vegetation cover. Interactions
between external forcings and feedback mecha-
nisms are detailed in, for example, Maslin et al.
(2001) and Old eld (2005).
1.2.1 Orbital forcing
During the Quaternary, regular variations in the
Earth’s orbit (commonly known as Milankovitch
cycles) have been the dominant mechanism
driving the Earth in and out of intervals of intense
1.1 Introduction
The term Holocene was rst coined in the early
nineteenth century and was adopted in Bologna
by the International Geological Congress in 1885.
The Holocene (also known as the Postglacial or the
Flandrian) is one of the most easily identi ed fea-
tures in palaeoclimate records, and marks the end
of the Pleistocene Epoch approximately 11 500 years
(11.5 ka) before present (). The Holocene is the
most recent geological epoch of the Quaternary
Period (the past 2.6 million years), which itself is
characterized by glacial–interglacial cycles. The
Holocene is the Earth’s most recent interglacial: a
climatically warm interval that separates cooler
glacials (or ice ages).
Accurately dating the start of the Holocene has
proved challenging. For example, before the wide-
spread use of cal ibrat ion in radioca rbon (
14
C) dating,
the start of the Holocene was commonly placed at
10 000
14
C years . This date undoubtedly persisted
so long due to its ‘elegant simplicity’ (Roberts 1998).
However, developments of more accurate chronolo-
gies, especially with regard to improved calibra-
tion of radiocarbon dates using annually resolved
archives (e.g. tree rings, lake sediments, and ice
cores) have revealed the start of the Holocene to be
c.11.5–11.6 calibrated (cal) ka . All dates presented
in this chapter are calibrated.
1.2 External climate-forcing
mechanisms
Factors that drive climate change on Earth but
are not in themselves affected by that change are
CHAPTER 1
An introduction to Late
Glacial–Holocene environments
Anson W. Mackay
2 HOLOCENE EXTINCTIONS
through the Holocene have had differential, regional
impacts on the Earth’s climate, primarily through
atmospheric interactions in the stratosphere and
troposphere (Bradley 2003). A commonly used
measure of solar variability is total solar irradi-
ance (W m
−2
). Direct records of past solar activity
(extending beyond several centuries) do not exist.
Instead, variations in the cosmogenic isotopes of
14
C and
10
Be in natural archives have been used as
proxies of past total solar irradiance (Fig. 1.2b). This
is based on the assumption that their production
in the Earth’s upper atmosphere is inversely pro-
portional to variations in solar radiation; that is,
as radiation from the sun decreases, production of
cosmogenic isotopes increases. Over the Holocene
this has been shown to vary by about 0.4% (in com-
parison to modern levels). Variations in solar inso-
lation have been implicated in changes in North
Atlantic thermohaline circulation (e.g. Björck et al.
2001; Bond et al. 2001), although the mechanisms of
how these processes interact are still uncertain.
1.2.3 Volcanic activity
The third major external forcing to in uence
Holocene climate is linked to particulate matter and
aerosols released into the atmosphere from volcanic
eruptions. Large explosive eruptions can result in
cooling which lasts several years (Robock 2000).
This cooling is caused by the injection of sulphate
aerosols into the stratosphere, which cause general
radiative cooling of the surface atmospheric layers.
However, regional impacts are more complex, and
glaciation (Imbrie et al. 1992) (Fig. 1.1). At a primary
level, insolation received from the sun is modi-
ed by a combination of three orbital parameters:
eccentricity, obliquity, and precession. Eccentricity
occurs due to variations in the minor axis of the
Earth’s orbital ellipse as it goes round the sun, and
occurs with a frequency of c.100 ka. Obliquity is
the term used to describe the tilting of the Earth’s
axis, which has a frequency of c.41 ka. Precession
describes the direction of the tilt of the Earth at any
given point of its orbit; cycles vary between 23 and
19 ka (mean = 21.7 ka). Changes in orbital param-
eters have little impact on the total amount of solar
radiation received by the Earth from the sun, but
they do alter the amount of seasonal solar radi-
ation received at different latitudes. Crucial in this
respect is the amount of solar radiation received on
continents at northern latitudes, as this determines
whether snow and ice can persist through the fol-
lowing summer months. During the Late Glacial–
early Holocene, precessional forcing at northern
latitudes peaked between c.14–10 ka, resulting
in warmer summers and colder winters over the
northern hemisphere. Since the early Holocene,
these levels have declined by approximately 10%
relative to recent times (Fig. 1.2a), so that currently
the range of temperatures between summer and
winter months is less extreme.
1.2.2 Solar variability
The amount of energy emitted from the sun is
variable, and changing levels of solar irradiance
T
E
P
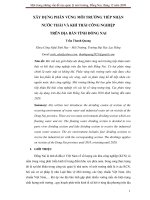
Figure 1.1 Orbital changes of the Earth around the Sun
associated with dominant mechanisms of climate forcing. E,
eccentricity of the Earth’s orbit, which is linked to variations in
the minor axis of the ellipse; T, tilt or obliquity of the Earth’s
axis; P, precession, i.e. the axis tilt direction of the Earth at a
given point of its orbit. Source: Rahmstorf and Schellnhuber
(2007). Reproduced by permission from Verlag C.H. Beck.
Atmospheric carbon dioxide concentration
GRIP, atmospheric methane concentration
GISP2, volcanic sulphate (11-pt running mean)
Meltwater, outbursts, and rerouting events
400
350
300
0
0 1000 2000 3000 4000 5000 6000 7000 8000 9000
10 000
11 000
750
700
650
600
550
0 1000 2000 3000 4000 5000 6000 7000 8000 9000 10 000 11 000
120
100
80
60
40
20
0
0 1000 2000 3000 4000 5000 6000 7000 8000 9000 10 000 11 000
0 1000 2000 3000 4000 5000 6000 7000 8000 9000 10 000 11 000
CO
2
(ppmv)
Methane (ppb)
Volcanic sulphate (ppm)
11
(a)
(b)
(c)
(d)
(e)
(f)
10
9
8
7
6
5
4
3
2
1
0
0 1000 2000 3000 4000
July solar insolation at 60° N
Cal. years
BP
Cal. years BP
Cal. years BP
Cal. years BP
Cal. years BP
Cal. years BP
5000 6000 7000 8000 9000 10 000 11 000
Solar insolation (%)
Solar activity (␦
14
C residual)
–30
–20
–10
0
10
20
30
0 1000 2000 3000 4000 5000 6000 7000 8000 9000 10 000 11 000
Solar activity Low
High
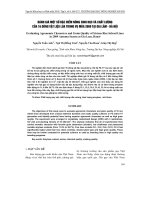
Figure 1.2 Major Holocene climate forcing factors in the northern hemisphere. (a) Percentage insolation anomaly at 60°N (departure from AD 1950 values) for mid June at the top of the
atmosphere; (b) solar activity variation estimated from residual
14
C variations; (c) atmospheric CO
2
concentrations derived from polar ice cores and Mauna Loa Observatory; (d) concentrations
of atmospheric CH
4
found in Greenland Ice Core Project (GRIP) ice core; (e) Greenland Ice Sheet Project 2 (GISP2) volcanic sulphate record (11-pt running mean); (f) early Holocene meltwater
outbursts into the North Atlantic from ice-dammed lakes associated with the Laurentide ice sheet. Note that the CH
4
record for the GRIP ice core does not cover the last approximately
200 years; during this interval, atmospheric concentration of CH
4
has increased from approximately 725 parts per billion (ppb) to over 1750 ppb. ppb, parts per billion; ppm, parts per million;
ppmv, parts per million by volume. Redrawn and adapted from Nesje
et al.
(2005), which also contains detailed information on sources of data used. Reproduced by permission of the
American Geophysical Union.
4 HOLOCENE EXTINCTIONS
to that during the latter part of the Holocene and
to variation predicted for the near future (Loutre
and Berger 2003). MIS11 has therefore been used
as an analogue from which to predict future cli-
mate variability. For example, because the effects
of orbital precession are minimized during inter-
vals of low orbital eccentricity, cold summers at
high latitude (which occurred at the initiation of
the Last Glaciation approximately 116 ka ) will
not occur for at least another 30 ka (IPCC 2007).
Moreover, comparisons between the Holocene
and MIS11 suggest that natural forcings alone can
account for the prediction that Holocene warmth is
likely to last for approximately another 50 ka into
the future (Loutre and Berger 2003). Nevertheless,
whereas previous interglacials can provide us with
information on natural variability linked to exter-
nal forcings and internal feedback mechanisms,
the Holocene is still unique due to the unprece-
dented in uence that humans have had on their
environment.
1.3 Detecting Late Glacial–Holocene
environmental change
Over the Late Glacial–Holocene there is an absence
of direct monitoring or documentary records of
environmental change, and so natural archives
have therefore been exploited. Different archives
have their own strengths and weaknesses, but
those that are continually deposited offer the best
possibility for high-resolution reconstructions at
the sub-decadal level or higher. Some of the most
exploited archives are those that exhibit annually
deposited layers (e.g. varved lake and marine sedi-
ments, ice cores, speleothems) or annual growth
layers (e.g. tree rings, corals). These archives can
provide annually resolved records extending back,
in some cases, to at least the Last Glacial Maximum
(LGM; c.21–22 ka ).
The distribution of any one particular archive
will be geographically restricted. Ice cores, for
example, will only be found where conditions are
optimal for the build-up of ice layers and their
subsequent preservation, for example in the Arctic
and Antarctic, but also in temperate and tropical
alpine regions. Some archives are more widely dis-
tributed than others. Lake sediments, for example,
are dependent on the interactions of aerosol cool-
ing on atmospheric weather patterns. Any one vol-
canic eruption by itself is unlikely to have had a
major climatic impact. However, eruptions occur-
ring in close succession may well have had more
signi cant impacts at the decadal to multi-decadal
scale (Bradley 2003). Such clusters occurred dur-
ing the early Holocene between c.10.5 and 9.5 ka
(Fig. 1.2e). The impact of past volcanic eruptions
on human civilization is controversial. There is no
dispute that past civilizations have been intricately
associated with volcanic regions around the world,
but evidence for eruptions invoking civilization
collapse is much less certain (Grattan 2006).
Information on past environmental change during
the Holocene has the potential to inform questions
about contemporary environmental dynamics,
most notably how long will warm interglacial cli-
mates persist, are current trends in global warm-
ing unusual, and can we expect any surprises in
the future in the form of increasing instability in
the climate system? In order to address these ques-
tions, it is necessary to investigate climate forcings
of previous interglacials with a view to context-
ualizing Holocene variability into the future. In
this respect two previous interglacials provide
much-needed clues: the last interglacial, otherwise
known as the Eemian/Marine Isotope Stage (MIS)
5e (c.130–116 ka ± 1 ka) (although the two are not
directly synchronous; Shackleton et al. 2003), and
MIS11 (c.423–362 ka ) (Droxler et al. 2003).
Global mean surface temperatures during the
Last Interglacial were at least 2°C higher than the
present day (Otto-Bliesner et al. 2006), which led to
high rates of sea-level rise (average 1.6 m per century;
Rohling et al. 2008). Palaeontological records dem-
onstrate a relatively stable climate, although proxy
records increasingly suggest evidence for millenni-
al-scale variability. The orbital con guration of the
Earth during the Last Interglacial was signi cantly
different than during the Holocene. This therefore
limits the extent to which we can use palaeonto-
logical records from the Last Interglacial as ana-
logues for current and future climate change.
Consequently, there has been growing interest
in MIS11 because astronomically driven insola-
tion related to low orbital eccentricity is similar
LATE GLACIAL–HOLOCENE ENVIRONMENTS 5
are not annually laminated; speci c conditions
are required for annual laminations (or varves) to
form, including a strong seasonal climate and the
prevention of bioturbation of bottom sediments
(Zolitschka 2003). The ner temporal resolution
provided by annually laminated lake sediments
has permitted detailed investigation of many Late
Quaternary events, such as the development of
agriculture in the Near East during the Late Glacial
and Holocene (e.g. Baruch and Bottema 1999).
A large variety of biological proxies have been
exploited from sedimentary archives and used to
reconstruct past environments. These all require
speci c properties to enable them to be robust
indicators of past change. For example, they need
to be produced in large enough quantities so that
only relatively small amounts of sediment are
needed for analysis. This holds true for pollen,
diatoms, and foraminifera, for example. For some
other proxies, including beetles and plant macro-
fossils, larger amounts of sediment material are
needed, which usually results in lower-resolution
studies. Each proxy needs to be able to preserve
in the envir onment in which it is deposited, and
so different proxies all contain properties which
aid their preservation. General information is pro-
vided below on a few commonly used isotopic and
biological proxies that have greatly furthered our
understanding of Late Glacial–Holocene environ-
mental change. Several recent comprehensive texts
detail other proxies and their uses (e.g. Smol et al.
2001; Mackay et al. 2003a).
The most widely used geochemical proxies in
Holocene studies are stable isotopes of oxygen
(
16
O and
18
O), carbon (
12
C and
13
C), and hydro-
gen (
1
H and
2
H). Interpretations of past environ-
ments using stable isotopes are based on the ratios
between the isotopes, especially
18
O/
16
O and
2
H/
1
H
in water derived from precipitation, groundwater,
rivers, lakes, and oceans. The ratios between sta-
ble isotopes are controlled by a large number of
factors, especially temperature and evaporative
processes which vary over time. For example, dur-
ing evaporation of water, the heavier isotope (e.g.
18
O or
2
H) is discriminated against (isotopic frac-
tionation). This results in remaining waters being
enriched in heavier isotopes, while the evaporated
water vapour is de cient in these isotopes relative
are particularly useful as these are found in most
regions across the globe, except for deserts, and
even then sediments from palaeo-lakes have often
been exploited. Other archives such as tree rings
and associated dendroclimatological data owe their
signi cance to some individuals of certain species
growing at the margin of their ecological tolerance,
which sensitively record even minor uctuations
in climate. This section provides details on annu-
ally laminated archives, most notably ice cores and
lake and marine sediments. These were selected
because they have been particularly important
in setting the agenda with regard to the high-
resolution reconstruction of Late Glacial–Holocene
ecosystems and associated impacts from both nat-
ural and anthropogenic events.
Recent studies of ice cores have revealed signi -
cant and consistent trends in Late Glacial–Holocene
climate variability. Key sites of note include ice
cores extracted from Greenland (e.g. Greenland Ice
Core Project (GRIP), NorthGRIP, and Greenland
Ice Sheet Project 2 (GISP2)) and Antarctica (e.g.
Vostok, Dome C/European Project for Ice Coring
in Antarctica (EPICA)). The most widely exploited
proxies from ice-core layers include greenhouse
gases, dust, sulphates (produced by volcanic activ-
ity), major ions (such as K
+
and Na
+
), and stable iso-
topes (e.g. δ
18
O). For example, records of greenhouse
gases (e.g. CO
2
, CH
4
, and N
2
O) contained within
trapped air in ice cores are important proxies in the
debates on early Holocene warming, Holocene cool
events, recent global warming, and the processes
which control warming during glacial–interglacial
cycles (e.g. Raynaud et al. 2000). δ
18
O records in turn
can provide quantitative estimates of past tempera-
ture (see below).
Lake and marine sediments are of heteroge neous
composition, consisting of both autochthonous and
allochthonous components. Sediment accumula-
tion can be in uenced by many factors, including
(1) seasonal biological production within the water
column, (2) transport of sedimentary material
either through uvial or aeolian action, (3) sedi-
mentation processes that allow settling of particles
through the water column on to the basin oor, (4)
secondary processes such as redeposition, resus-
pension and focusing, and (5) bioturbation of bot-
tom sediments. Most lake and marine sediments
6 HOLOCENE EXTINCTIONS
reconstruct population ecologies (e.g. plant migra-
tion and plant invasion; Jackson and Overpeck
2000) and community palaeoecology (e.g. past land-
scape disturbance and biodiversity change) (Seppä
and Bennett 2003). Some of the most signi cant
advances in recent years include (1) the improve-
ment and re nement of pollen-based transfer-func-
tion models of palaeoclimate (Birks 2003), based on
relationships between pollen taxa and modern cli-
matic variables (e.g. Seppä and Birks 2001), and (2)
the use of pollen-based palaeoecological records
to provide long-term perspectives on conservation
and biodiversity (e.g. Willis et al. 2007) and on the
role of species refugia in temperate and tropical
forests (Willis and Whittaker 2000; Colinvaux and
Oliveira 2001; Bush 2003).
Diatoms (unicellular eukaryotic algae, Class
Bacillariophyceae) are extensively utilized because
they can be found in virtually every aquatic envir-
onment and they preserve well in most sediments
due to their valves being composed of biogenic sil-
ica. Diatoms can be identi ed to the species level,
and many species have well-de ned niche charac-
teristics, which make them powerful environmen-
tal indicators. Diatoms are often used to investigate
Holocene climate variability (Mackay et al. 2003b),
such as past air temperature (Weckström et al.
2006). Diatoms are especially useful however for
to the source. Thus, by studying isotopic ratios in
palaeoarchives, past climates (colder/warmer; wet-
ter/drier) can be quantitatively inferred (see Figs
1.3 and 1.5, below). Isotopes are incorporated into
lake and marine sediments as either photosynthet-
ically derived precipitates or via biogenic precipi-
tates within organic matter, mollusc shells, diatom
frustules, foraminiferan tests, etc. Some of the most
signi cant applications in the use of stable isotopes
have been their measurement in annually lami-
nated archives. For example, the δ
18
O record from
the Greenland GRIP ice cores highlight the abrupt
changes in global temperature that characterize
the Late Glacial–early Holocene interval (Fig. 1.3).
Pollen analysis is probably the most extensively
used palaeoecological technique since pioneer-
ing work published by von Post in the begin-
ning of the last century. Pollen grains and spores
are useful palaeoenvironmental proxies because
they are produced in large numbers and preserve
well in anoxic sediments. Interpretation of pollen
relies on knowledge of production and dispersal
of grains from source vegetation, although rarely
do proportions of pollen grains found in sedi-
mentary archives have a linear relationship with
past vegetation abundances; careful interpretation
is therefore needed. In recent decades there has
been substantial progress in the use of pollen to
10 000
11 000
12 000
13 000
14 000
15 000
16 000
17 000
18 000
19 000
20 000
21 000
–45
Oxygen isotope ratios (‰)
Holocene
Bølling–Allerød
GS-2a
GS-2b
GS-2c
Younger Dryas
–40 –35 –30
GRIP ice years BP
GI-1e
GI-1c
GI-1a
GS-1
Figure 1.3 δ
18
O ‰ GRIP ice core record from
Dansgaard
et al
. (1993). The division of the Late
Glacial into Greenland stadials (GS) and Greenland
interstadials (GI) follows Björck
et al
. (1998). Adapted
from Björck
et al
. (1998). ©John Wiley & Sons Limited.
Reproduced with permission.
LATE GLACIAL–HOLOCENE ENVIRONMENTS 7
transfer-function methodologies are based on the
premise of collecting knowledge on environmen-
tal requirements of species represented as fossils
in sedimentary records (Birks 2003). Establishing
gradients of interest and importance is therefore
crucial. Relationships between species and their
environment are modelled numerically, based on
strong statistical and theoretical bases. Estimates
of environmental variables of interest such as sum-
mer temperature can then be reconstructed for the
past using the fossils present in the relevant arch-
ive, based on models developed from the calibra-
tion dataset.
Physical models are fundamental tools of cli-
mate change science, both for reconstructing past
variability and for predicting future changes.
They need to be internally consistent, compatible
with biophysical laws, perform robustly, and to be
data-realistic. If these criteria are satis ed, then the
Holocene is an important time frame with which to
test models and improve them so that that they can
be used, for example, for climate change predic-
tion (Valdes 2003). All models are a simpli cation
of the processes that have actually happened, are
happening, or are likely to happen. Models have
themselves increased in complexity from rather
simple box models (often used to simulate chem-
ical species such as carbon or nitrogen) to general
circulation models which are used to understand
climate as a three-dimensional process. General
circulation models are now frequently coupled
with other dynamical models (e.g. ocean circulation
models, terrestrial models of vegetation change)
but their complexity and computing requirements
are enormous. To bridge the gap between these
model types, Earth system models of intermedi-
ate complexity requiring less computing power
are frequently used by palaeoclimatologists, but
still attempt to incorporate other biosphere com-
ponents, such as terrestrial vegetation and land-
ice sheets (Valdes 2003). Because these models are
quicker to process, they have been used to model
past climate at high resolution over many thou-
sands of years. For example, they have made major
contributions to assessing sensitivity and stability
of North African climate during the early to mid
Holocene in relation to concomitant vegetation and
landscape changes (Claussen et al. 1999).
reconstructing the quality of inland and coastal
waters which may be impacted by cultural eutrophi-
cation. They have therefore played a major role in
assessing human impact on freshwater ecosystems
throughout the Holocene. For example, Verschuren
et al. (2002) used diatom analysis of sediments in
Lake Victoria to show that eutrophication has
resulted in the loss of deep-water oxygen since the
1960s. This is likely to have contributed in part to
the extinction of some deep-water endemic cich-
lids, in addition to impacts linked to the introduc-
tion of the Nile perch Lates niloticus.
Foraminifera are amoeboid protists found
mainly in coastal and marine ecosystems, and their
contribution to climate change studies has been
signi cant. Foraminiferan tests preserve in abun-
dance in marine sediments. There are over 10 000
species of foraminifera, which occupy a wide var-
iety of marine environments and ecological niches
(Murray 2002), allowing for robust multi-species
palaeoenvironmental reconstructions. Indeed,
the rst empirical transfer function exploited the
relationships between marine foraminifera to
global sea-surface temperatures and sea-surface
salinities (Imbrie and Kipp 1971). The range of pal-
aeoenvironmental studies using foraminifera is
extensive. For example, planktonic/benthic ratios
within assemblages can provide information on
sea-level changes, δ
18
O in foraminifera tests has
been used as a proxy for changes in Holocene sea-
surface temperatures, and δ
13
C has been used as a
proxy for carbon storage, ocean circulation, and
p r o d u c t i v i t y .
One proxy by itself cannot fully account for a com-
plete record of environmental change, and so multi-
proxy approaches are increasingly undertaken to
reconstruct Late Glacial–Holocene environments
(Birks and Birks 2006). Moreover, different proxies
may be able to compensate for potential weaknesses
in other proxies that have been analysed. Multi-
proxy studies are complex and time-consuming,
although the rewards in recognizing complimenta-
rities between different proxies are great.
Estimates of past climates can be quantitatively
reconstructed either by data (empirical) models
or by models based on physical laws (e.g. thermo-
dynamics) of the climate system. Both approaches
require substantial numerical processing. Empirical
8 HOLOCENE EXTINCTIONS
areas of continental shelves being exposed. These
provided land bridges both between continents
(e.g. Siberia and North America) and between
islands on continental shelves (e.g. the Sunda Shelf
in south-east Asia). These linkages had signi cant
implications for population expansion and disper-
sal patterns for many species.
During the LGM temperate and tropical rain
forests had greatly restricted geographies (Prentice
et al. 2000). In Europe, for example, cooler temper-
atures and increased aridity caused a southwards
displacement and reduction of forests. Conversely,
tundra, steppe, and grassland communities were
much more widespread, extending from the
margins of the ice sheets to the coastlines of the
Mediterranean. Ice-core evidence shows strong
depression of temperatures at high latitudes dur-
ing the LGM in comparison to the present day;
for example, by 21°C in Greenland and 9°C in
Antarctica (IPCC 2007). In western Europe, pollen-
inferred mean annual temperatures were approxi-
mately 15°C cooler than present (Guiot et al. 1993).
In southern Europe, modelling data suggest that
temperatures were between approximately 7 and
10°C cooler during the LGM than the present day.
Temperature estimates for lowland tropical regions
during the LGM were at least 5°C lower than the
present day (Bush et al. 2001), although cooling was
weaker in the western Paci c Rim (<2°C).
The demise of ice sheets marking the end of the
last glacial interval is known as Termination 1. In
the last decade, there has been a marked improve-
ment in the resolution of dating of archives used
to reconstruct climate change during Termination
1 (Björck et al. 1998), and these data show that
temperatures uctuated dramatically by as much
as 10°C over intervals of decades, if not years
(e.g. Alley 2000). Proxy records highlight the Late
Glacial as an interval of signi cant climate instabil-
ity in the northern hemisphere. The rst sign of a
shift to warmer temperatures outside those expe-
rienced during the preceding glacial conditions
occurred between c.14.7 and 14.5 ka , with the
onset of the Greenland interstadial 1, commonly
known as the Bølling–Allerød (GI-1; Björck et al.
1998) (Fig. 1.3; Table 1.1). This was followed by an
equally rapid shift to cooler temperatures charac-
terizing the Greenland stadial 1 (GS-1; also known
Climate models demonstrate that elevated
summer temperatures at higher latitudes dur-
ing the early Holocene in part contributed to
increased monsoonal intensity throughout many
low- latitude regions, resulting in signi cantly wet-
ter environments. Nowhere has this been more
apparent than in the Saharan region of North
Africa. Palaeoecological records provide evidence
for the widespread existence of freshwater eco-
systems, such as Lake Megachad, during the early
Holocene. Archaeological records show that the
region was extensively populated, while pollen
records highlight the persistence of wetlands and
associated vegetated landscapes that were likely to
have played a signi cant role in the maintenance
of hydrologically wetter conditions. After about
c.5.5 ka , summer monsoons began to fail in the
Saharan region, which resulted in increased deser-
ti cation and which may also have played a role
in the extinction of the giant long-horned buffalo
Pelorovis antiquus (Klein 1994; see also Chapter 2 in
this volume). Crucially, however, these hydrological
changes cannot be explained by external solar for-
cing alone. Instead, these models have highlighted
the strong role of internal feedback mechanisms,
such as the extent of terrestrial vegetation covering
land in the region (Claussen et al. 1999).
1.4 Late Glacial–early Holocene
environments
During the last glacial, ice sheets and glaciers cov-
ered approximately 40 million km
2
of the Earth’s
surface (Anderson et al. 2007). The main ice sheets
were in Antarctica, North America (the Laurentide
a nd Cord il le r an ice sh e ets), Gre en la nd, a nd nor the rn
Europe (the Scandinavian ice sheet), with smaller
ice sheets also present in southern South America.
Other notable ice sheets occurred in regions asso-
ciated with expanded glacier activity; for example,
the alpine regions of Europe, Africa, and south-
east Asia. At the time of the LGM, ice volume was
high and global sea levels were low because water
was locked up in ice caps and glaciers. Estimates
for the extent of sea-level decline towards the end
of the Last Glaciation vary considerably between
approxi mately 120 and 135 m (Bell and Walker
2005). Lowered sea levels resulted in extensive
LATE GLACIAL–HOLOCENE ENVIRONMENTS 9
and 11.5 and 8 ka . In these lowland habitats
there were large declines in both plant and animal
populations as shorelines advanced at approxi-
mately 40 cm week
−1
, resulting in the extinction
of many species of megafauna from some of the
smaller islands (Bush 2003). However, isolation
of these islands may have contributed to the per-
sistence in the region of certain other species such
as the orang-utan Pongo pygmaeus, which became
extinct on the south-east Asian mainland (Louys
et al. 2007).
In the northern hemisphere increasing sea levels
resulted in the fragmentation of the vast land area
known as Beringia, which encompassed Alaska,
the shallow Arctic shelf, and the coastal lowlands
of Arctic east Siberia. By c.12 ka , Wrangel Island
in the Arctic Ocean became isolated, resulting
in the local persistence of the woolly mammoth
Mammuthus primigenius well into the Holocene until
c.4 ka (Vartanyan et al. 1993; see also Chapter 2
in this volume). Increasing sea levels during the
Late Glacial also resulted in the most recent inun-
dation of the intercontinental Bering Land Bridge
between North America and Eurasia. Inundation
of this region had signi cant implications for the
migration of human populations from continental
Eurasia to the Americas (see below). In north-west
Europe, inundation of the shallow continental shelf
as the Younger Dryas), which lasted between c.12.65
and 11.50 ka (Fig. 1.3; Table 1.1). This abrupt cold
reversal is linked to an enormous pulse of fresh
water being released from retreating ice on the
Laurentide ice sheet in North America into the
Arctic Ocean (Tarasov and Peltier 2005). This fresh-
water pulse caused marked changes in the salinity
of surface waters of the Arctic Ocean, leading to
a slowdown in North Atlantic Deep Water forma-
tion. During glacials, these abrupt events occurred
approximately every 1500 years and are called
Dansgaard–Oeschger events or cycles (Maslin
et al. 2001). There is increasing evidence to suggest
that these events also persist during interglacials,
including the Holocene.
1.4.1 Sea-level responses
Late Glacial–early Holocene warming was accom-
panied by eustatic (globally averaged) increases
in sea level, as water once locked up in ice sheets
and glaciers was returned to ocean basins. In the
millennia following the LGM, sea levels rose by
over 120 m (IPCC 2007) but stabilized by c.2–3 ka
. At low latitudes, one of the regions most greatly
impacted by sea-level rise was south-east Asia.
The once-exposed Sunda Shelf was rapidly inun-
dated in two phases: between c.16 and 12.5 ka
Table 1.1 Chronological history for the Late Glacial based on the Greenland Greenland Ice Core Project (GRIP) ice core. Greenland
stadial and interstadial stages are given in ice-core years BP (Björck et al. 1998). European population events are derived from
Gamble et al. (2005), and dates demarking the boundaries between the population events (right-hand column) are also given in
GRIP ice-core years BP.
Stage GRIP ice-core
years
BP
Continental north-
west Europe
Western European
population event
Date of boundary
between population
events (ice-core years BP)
Holocene 11 500 Holocene
GS-1 GS-1 12 650 Younger Dryas 5 12 900
GI-1 GI-1a 12 900
GI-1b 13 150 Allerød 4 14 000
GI-1c 13 900
GI-1d 14 050 Older Dryas
GI-1e 14 700 Bølling 3
GS-2 GS-2a 16 900 2 16 000
GS-2b 19 500 19 500
GS-2c 21 200 1
10 HOLOCENE EXTINCTIONS
After the retreat of the ice sheets, trees spread
rapidly to occupy new available niches. Migration
rates were so fast (10
2
–10
3
m y e a r
−1
) that relatively
rare, long-distance dispersal events (leptokurtic
dispersal) are likely to have played a prominent role
(Clark et al. 1998). It has been widely considered that
temperate forests were largely restricted to refugia
(isolated areas of habitat that retain environmental
conditions that were once more widespread, allow-
ing ora and fauna to persist in restricted local ities)
in the Balkan, Iberian, and Italian peninsulas, and
in localized regions of eastern, central, and south-
western Europe during the LGM (Prentice et al.
2000). However, palaeoecologists are increasingly
questioning whether temperate forests were truly
restricted to more southern latitude refugia during
this interval, or whether they were actually more
extensive in periglacial environments (Clark et al.
2001). For example, animals and plants surviving
in cryptic northern refugia (Stewart and Lister
2001) may have played a much larger role in the
spread of thermophilous species through northern
Europe. This is turn is likely to have had a greater
impact on mid- to high-latitude biodiversity (Willis
and Whittaker 2000) and dispersal patterns of
human populations (Gamble et al. 2005) than pre-
viously considered.
The occurrence of cryptic northern refugia is just
one of the questions challenging our understand-
ing of past ecosystems, biodiversity, and speciation
(Willis and Whittaker 2000). The role of tropical for-
est refugia in relation to speciation in the Amazon
rainforest has also been subject to considerable
debate. In order to account for the high levels of
endemicity in the Amazon rainforest, Haffer (1969)
proposed the hypothesis that during intervals of
full glacial conditions, increased aridity resulted
in the Amazon rainforest being restricted to iso-
lated pockets, surrounded by expanded savannah
environments. It was speculated that these dis-
junct, isolated rainforest refugia provided condi-
tions favourable for speciation; new species were
then able to expand their ranges on the return of
warmer temperatures and interglacial conditions.
However, palaeoecological evidence disputes this
hypothesis, as forests were shown to have per-
sisted during full glacial conditions despite over-
all reductions in precipitation (Bush 2003; Augusto
resulted in the loss of large areas of Mesolithic
hunting territory, but at the same time created new
habitats suitable for shallow-water shing. New
European coastal landscapes were created, which
culminated in the isolation of Britain from main-
land Europe by c.7 ka (Shennan et al. 2000).
Global changes in relative sea level are also
affected by other processes such as vertical land
uplift (glacial isostasy) and thermal expansion fol-
lowing melting of heavy ice sheets. The extent of
potential uplift can be considerable; for example, the
absolute uplift in the Baltic region of Scandinavia
was greater than 700 m, while modelled uplift in
North America was in excess of 900 m (Bell and
Walker 2005). Uplift of land is still occurring today
throughout many regions of the North Atlantic
that previously supported glacial ice sheets.
1.4.2 Vegetation responses
Plant species responses to climate are individualis-
tic. Palaeoecological studies have shown that dur-
ing the Late Glacial–early Holocene migrations of
vegetation species, populations, and communities
were extremely complex, although concept ual mod-
els based on ecological niche theory have furthered
our understanding of some of these responses in
relation to climate change (Jackson and Overpeck
2000). Important factors in uencing species migra-
tion include not only their individual dispersal
characteristics, but also their individual responses
to precipitation, seasonal temperature, and other
environmental factors (Davis and Shaw 2001; Seppä
and Bennett 2003). Through processes of disag-
gregation and recombination, plant assemblage
responses during the Late Glacial–early Holocene
therefore formed a changing array of vegetation
patterns (Jackson and Overpeck 2000). Moreover,
pollen and plant macrofossil records demonstrated
that plant associations during the Late Glacial–
early Holocene were very different from the asso-
ciations recognized today. For example, Overpeck
et al. (1992) showed that in North America major
vegetation associations could not be recognized
before the early Holocene. Terrestrial plant assem-
blages can therefore be seen to be highly dynamic,
and concepts of so-called climax communities are
no longer deemed to be valid.
LATE GLACIAL–HOLOCENE ENVIRONMENTS 11
it did not survive the Younger Dryas interval).
However, there is also strong archaeological
and genetic evidence for pre-Clovis occupation
in both North America (c.15 ka ; Goebal et al.
2008) and South America (at Monte Verde) from
at least c.14.6 ka (Dillehay 1999). Further evi-
dence for human presence prior to the Clovis cul-
ture in North America between c.14.3 and 14.0 ka
has recently been determined through genetic
analysis of human coprolites in southern Oregon
(Gilbert et al. 2008).
European population numbers during the LGM
were low, and archaeological evidence suggests that
greatest densities were found in northern Spain,
south-west France, eastern European river basins,
and the Ukraine (Bailey 2007). With the retreat of
ice sheets during the Late Glacial the expansion
and dispersal of human populations in Europe was
complex, and exhibited non-linear relationships to
prevailing climate. Such complexity is probably
related to the role of cryptic refugia for subsequent
vegetation and animal dispersal throughout north-
ern Europe (Willis and Whittaker 2000; Stewart
and Lister 2001). Using a research approach known
as dates-as-data, Gamble et al. (2005) investigated
western European population levels from the Late
Glacial through into the early Holocene. This tech-
nique is based on the principle that population
signals can be determined from analysing the
distributions of calibrated radiocarbon dates from
archaeological sites. At least ve signi cant popu-
lation events (1–5) were recognized (Table 1.1), as
follows.
During the LGM until GS-2b (Table 1.1), Iberia 1
acted as a refugium for human populations,
although archaeological evidence highlighted that
humans were present in other regions, for exam-
ple north-central Europe, albeit at low population
levels.
Populations began to expand throughout west-2
ern Europe, especially south-west France during
GS-2a (c.19.5–16 ka ; Table 1.1). Thus, population
increase and expansion started during an interval
of cooler rather than ameliorating climate as sug-
gested, for example, by Blockley et al. (2000), high-
lighting in this case the importance of cultural
adaptive strategies.
de Freitas et al. 2001; Colinvaux and Oliveira 2001).
The transition from a glacially cooler climate into
the warmer Holocene was not accompanied by
savanna vegetation succeeding to forest, but of one
type of forest succeeding to other different forest
types. Cold-adapted forest species can be detected
in forest assemblages in Neotropical regions during
the LGM. With the onset of the Holocene, some of
these species died out, whereas others persisted for
many thousands of years (Bush 2003). Overall, the
transition into the Holocene is marked by the loss
of cold-adapted species, rather than the appearance
of species adapted to warmer conditions, as they
were continually present.
1.4.3 Human population responses
Several now-extinct hominid species (Homo habilis/
georgicus, Homo erectus/ergaster, and Homo heidelber-
gensis) spread across much of continental and insu-
lar Eurasia and evolved into several new species
(Homo antecessor, Homo neanderthalensis, and Homo
oresiensis) during the early–mid Pleistocene. Late
Pleistocene migrations of Homo sapiens out of Africa
into the Near East, south-east Asia, and Australasia
had taken place by c.40 ka . All of the world’s con-
tinents other than Antarctica had been colonized
by large-scale modern human population migra-
tions by the end of the Pleistocene, and all of these
events were associated with similarly large-scale
extinctions of megafaunal mammal (and some
bird and reptile) species (see also Chapter 2 in this
volume).
North and South America have been colonized
only since the LGM. Genetic pro ling suggests
that the most likely origin of these earliest popu-
lations was from eastern Siberia (Eshleman et al.
2003). These populations crossed into Alaska
via the Bering Land Bridge, and spread rapidly
through ice-free corridors and via the deglaciated
Paci c coastline into the south of the continent
(Goebal et al. 2008). It is widely believed that this
earliest migration of humans into North America
represents the Clovis culture, which our-
ished during the Allerød interstadial between
13.2–13.1 to 12.9–12.8 ka (Waters and Stafford
2007). The Clovis culture spread rapidly through
North America in less than 300 years (although
12 HOLOCENE EXTINCTIONS
rice Oryza spp. and soya bean Glycine max in the
Far East, and squash Cucurbita spp. and corn Zea
mays in the Americas (Bellwood 2005) (Fig. 1.4).
Prior to domestication (c.14 ka ), populations
in the Near East had already formed very close
associations with certain animals, most notably
the wolf Canis lupus, from which all modern-day
dogs are derived. Domestication of other animals
followed during early Holocene including pigs
Sus scrofa domestica, sheep Ovis aries, and goats
Capra aegagrus hircus by c.9 ka , and cattle Bos
taurus by c.8 ka (Kirch 2005) (Fig. 1.4). Animal
domestication in other regions occurred later; for
example, the water buffalo Bubalus bubalis in the
Far East by c.7 ka , and llamas Lama glama and
alpacas Vicugna pacos in South America by c.5 ka
. Domestication had major, signi cant in uences
on global environments. Continent-wide swathes
of land have been modi ed for domestic animals
through forest clearance (see Chapter 11 in this
volume). Freshwater environments have also been
heavily impacted through the introduction of inva-
sive species and modi cation of water quality (e.g.
by nutrient enrichment and subsequent eutrophi-
cation) and water quantity (e.g. through abstrac-
tion), which has led to catastrophic declines in sh
and invertebrate species, sometimes to extinction
(Barel et al. 1985; Verschuren et al. 2002).
1.5 Holocene climate variability
The early to mid Holocene (c.9–5 ka ) was an
interval of warmer climate than the present day.
This interval is commonly known as the Holocene
climatic optimum (or the hypsithermal or altither-
mal) and was followed by orbitally related cool-
ing which began to occur in the last 4–3 ka (Fig.
1.5). However, better-resolved palaeo-records from
around the world have identi ed a much more
complex picture than the simple model of early
Holocene warming followed by late Holocene
cooling. For example, δ
18
O records from Greenland
ice cores highlight that temperatures during the
early stages of the Holocene (approximately the
rst 1500 years) were highly variable. ‘Optimum’
temperatures occurred between c.8.6 and 4.3 ka :
thereafter, records demonstrate a general cooling
followed by recent global warming (e.g. Johnsen
Major European population expansion occurred 3
during 16–14 ka , along a south-to-north lati-
tudinal gradient. Population numbers may have
reached 40 000 individuals (Bocquet-Appel and
Demars 2000).
An interval of population stasis is recognized to 4
have occurred 14–12.9 ka , as settlements re-or-
ganized themselves from being dispersed to more
nucleated (Gamble et al. 2005).
Populations contracted during the Younger 5
Dryas (c.12.9–11.5 ka ), although not to the low
levels estimated for population events 1 and 2
above. These populations formed the basis for sub-
sequent Holocene/Mesolithic recovery and popu-
lation growth (Gamble et al. 2005).
1.4.4 The onset of agriculture and animal
domestication
Agriculture emerged independently in many
regions, with some of the earliest records dating
from the Late Glacial in the Near East, associated
with rapidly uctuating climates (Fig. 1.4). The role
of climate has long been postulated to be a major
driver in the development of agriculture (Childe
1952). However, determining the impacts of climate
change and associated human cultural develop-
ment in the Near East with precise resolution has
proved more challenging (Sherratt 1997). During
the warm Bølling–Allerød (GI-1) interstadial, wild
grasses were abundant in the Near East. However,
at the onset of the Younger Dryas, a shift to colder,
more arid conditions is shown in highly resolved
pollen records from annually laminated lake sedi-
ments in the Near East; for example, at Lake Huleh
in northern Israel (Baruch and Bottema 1999) and
Lake Van in eastern Turkey (Wick et al. 2003). It is
hypothesized that this change to drier and colder
climates led human populations to become more
closely associated, and to develop strains of cereal
crops that were better able to tolerate these new
conditions. Whereas cereal crops such as wheat
Triticum spp. and barley Hordeum vulgare were
among the rst species to be cultivated, the domes-
tication and alteration of other species quickly fol-
lowed. These included legumes such as peas Pisum
sativum and lentils Lens culinaris in the Near East,