Cá nhân phơi nhiễm với Benzene của các nhóm người dân được lựa chọn và tác động của phương thức đi lại tại TP Hồ Chí Minh, Việt Nam
Bạn đang xem bản rút gọn của tài liệu. Xem và tải ngay bản đầy đủ của tài liệu tại đây (639.17 KB, 8 trang )
Personal exposure to benzene of selected population groups and
impact of commuting modes in Ho Chi Minh, Vietnam
Tran Thi Ngoc Lan
a
,
*
, Ngo Quang Liem
a
, Nguyen Thi Thanh Binh
b
a
University of Science, Vietnam National University, 227 Nguyen Van Cu, HCMC, Viet Nam
b
Division of Chemistry and Biological Chemistry, School of Physical and Mathematical Sciences, Nanyang Technological University, 21 Nanyang Link, Singapore 637371, Singapore
article info
Article history:
Received 27 March 2012
Received in revised form
13 December 2012
Accepted 16 December 2012
Keywords:
Benzene
Personal exposure
Ho Chi Minh
Motorcycle exhaust
Commuter
abstract
Personal exposure to benzene of selected populatio n groups, and impacts of traffic on commuters in
Ho Chi Minh City were investigated. The study was carried out in June, July and November 2010.
The preliminary data showed that on average, personal exposure to benzene for non-occupational
people in Ho Chi Minh is w18
m
g/m
3
and most of the exposure is due to commuting. Benzene expo-
sure during travelling by bus, taxi and motorcycle is, respectively, 22e30, 22e39 and 185e 240
m
g/m
3
.
Motorcycleetax i drivers, petrol filling employees and street vendo rs suffer high daily exposures at 116,
52, 32
m
g/m
3
, respectively. Further measurements are needed for a better risk assessment and fi nding
effective measures to reduce exposure.
Ó 2012 Elsevier Ltd. All rights reserved.
1. Introduction
Air pollution in urban areas is a serious problem of many
developing countries. The rapid increase of the urban population
and low transport infrastructure in East Asia has resulted in
formation of megacities with dense motorcycle fleets like Kuala
Lumpur, Bangkok, Delhi, Hanoi and Ho Chi Minh City. A conse-
quence of this is decline of air quality due to volatile organic
compounds (VOCs) and particulate matters discharged from vehi-
cles. Many VOCs are considered toxic to humans, especially
benzene since it is known as a carcinogenic substance. Benzene is
highly volatile, so most exposure is via inhalation. The toxicity of
benzene is stated on the US Environmental Protection Agency (EPA)
website (2012b). Exposure to benzene increases the risk of
leukaemia in humans (Bois et al., 1996; Crump, 1994; Rinsky et al.,
1987). Experimental animal studies, both in inhalation and oral
ingestion, showed evidence of increased risk of cancer in multiple
organ systems including the haematopoietic system, oral and nasal
cavities, liver, forestomach, lung, ovary, and mammary gland
(Cronkite et al., 1985; Snyder et al., 1980, 1993). The risk of
leukaemia associated with lifetime exposure to benzene at 17, 1.7
and 0.17
m
g/m
3
is 10
À4
,10
À5
and 10
À6
, respectively (World Health
Organization [WHO], 2000).
Benzene is carcinogenic; therefore, WHO and the US EPA do not
recommend any safe level of exposure. Benzene in urban areas
mainly originates from vehicle exhaust and evaporation from fuel
tanks. Petrol-filling stations and garages contribute a significant
amount of atmospheric benzene. Other sources that significantly
increase indoor benzene levels are coal burning, tobacco smoking,
off-gassing from building materials (paints, adhesives, etc.), use of
benzene-containing consumer products and unflued oil and petrol
heating. Evaporation from fuel tanks of motorcycle might be
important source of benzene in Vietnam since each family owns
several motorcycles and a guest room is common parking place for
motorcycles. Human exposure to a pollutant is considered as the
concentration of the pollutant in the air that one individual inhales,
and differs from outdoor and indoor pollutant concentration.
Exposure depends on pollution level in the urban air, as well as in
microenvironments that an individual is exposed to, and the
duration of exposure. Personal exposure to benzene of non-
occupational non-smoking population was found to be higher
than the outdoor ambient benzene level in Barcelona City metro-
politan area and Catalan rural areas, Spain (Gallego et al., 2008); in
Rouen, Île de France (Paris area), Grenobleand and Strasbourg,
France (Gonzalez-Flesca et al., 2007); and in Copenhagen, Denmark
(Skov et al., 2001). The right method forthe assessment of toxicity of
benzene to humans is to relate benzene exposure to health effects.
Ho Chi Minh City, with a population of around 8.5 million, is one
of the most crowded cities in East Asia. Public transportation
consists of buses and taxis; however, the usage rate is low.
*
Corresponding author.
E-mail address: (T.T.N. Lan).
Contents lists available at SciVerse ScienceDirect
Environmental Pollution
journal homepage: www.elsevier.com/locate/envpol
0269-7491/$ e see front matter Ó 2012 Elsevier Ltd. All rights reserved.
/>Environmental Pollution 175 (2013) 56e63
Motorcycles are preferred for their flexibility. The number of
motorcycles and automobiles in March 2008 were 3,4 44,86 8 and
346,355, respectively, increasing to 3.9 million and 386,000 by June
20 09. On average, vehicle population increases about 10% per year.
Following this trend, the number of motorcycles at the end of 2011
was probably around 5 million. Traffic volume in the city is
extremely high. Our traffic survey at 29 major and 22 minor roads
on 24 November 2010 showed daily traffic volume in a range of
1.7 Â 10
4
e4.7 Â 10
5
vehicles/day with an average at
1.4 Â 10
5
vehicles/day. Traffic volume in rush hours (7 AMe8AM
and 5 PMe6 PM) was 1.4 Â 10
3
e4.8 Â 10
4
, with average of
1.2 Â 10
4
. Motorcycles contributed 90%e91% of a traffic fleet. On
average, the moving speed of a motorcycle is 20 km/h in non-rush
hours and 17 km/h in rush hours, road width is 18 m and buildings
are mainly three-storey. Road area in rush hours was 10e200 m
2
/
vehicle with a same median and geometric value of 29 m
2
/
vehicle (unpublished data). Traffic jams are frequent. A large
percentage of transportation means is made up of old technology.
EURO II standard takes power in Vietnam since July 2008, but it is
only applied for new imported vehicles.
According to Lan et al. (2011), a daily benzene concentration in
street urban air in Ho Chi Minh was 7e117
m
g/m
3
with a geometric
mean value of w45
m
g/m
3
. A high concentration of benzene may
badly affect human health. Up to date, there was not any published
data on exposure to pollutants in Vietnam. This study aims to
investigate personal exposure to benzene of selected population
groups in Ho Chi Minh. The study was conducted from the end of
20 09 to the end of 2010.
2. Material and methods
2.1. Study population
Ten people in three groups were recruited. The first group consisted of two
housewives. Exposure in this group is equivalent to indoor benzene levels. Two
houses were chosen. The first house was located in a narrow residential lane located
w200 m away from a main street. The other house is a small shop located on and
facing a main street. An entrance to the first house was just opened and closed
few times in a day, while an entrance to the second house was opened from 8 AM
to 9 PM. Windows on the second and third floors of the two houses were opened
day around. None of houses had an air conditioner and/or ventilator. In Vietnam,
most houses and building facing streets are shops. Commonly, shops are opened 12e
14 h per day. The two houses are designated as off-road and roadside indoors,
respectively.
Two students and a lecturer were in the second group for the study on exposure
during commuting and working in university. Motorcycles are the most common
means of urban transportation in Vietnam. Buses are mainly for university students
and temporary visitors. Taxis and private cars are for high-income people. One
student commuted by a city bus, another drove a motorcycle and the lecturer
commuted by a 4-seat taxi. Departure and destination were two university
Campuses, but routes were different. One-way mileage was about 25 km for the
motorcycle and taxi, 32 km for the bus following definite route. One-way
commuting time was 1.5 h by bus, 1 h by taxi and 1 h 10 min by motorcycle in
the morning (6:30 AMe8 AM). The commuting time in the evening (after 6 PM) was
a10e15 min shorter than in the morning. About one third of the route was in
crowded narrow streets, and the other two thirds were in open-space roads. From
w8AMtow7:30 PM, the students and lecturer stayed in the university campus,
which is about 200 m away from a main road. Benzene exposure in the second group
was designated as commuter/bus, commuter/taxi and commuter/motorcycle.
Individuals in the third group were persons at high risk of exposure: a street
vendor, a motorcycleetaxi driver, a bus driver, a taxi driver and a petrol-filling
employee. Working times of street vendors varied depending on cases. The
vendor was working from 6 AM to 10 PM in the front of the roadside house. This
selection enabled evaluation of influence of proximity to road to indoor benzene
levels. Motorcycleetaxis are common in Vietnam. Motorcycleetaxi drivers have no
definite working time, from a few to 14 h per day. The motorcycleetaxi driver in the
study was on the streets for about 10 h/day. In this time, he was driving for 7 h,
waiting in front of university about 2 h, and having lunch and dinner for more than
1 h. The remaining time in the day, he was at home. Commonly, street vendors and
motorcycleetaxi drivers are low-income people and most of them are temporary
residents of the city. They usually live in houses located in narrow lanes in dense
residential areas.
In Ho Chi Minh City, departure of the first and last bus from a terminal is 5 AM
and 8 PM. The bus in the study was a diesel 47-seater, and was air-conditioned like
most of buses in Ho Chi Minh. The bus route was about 30 km. Working time of the
bus driver is from 5 AM to 10 PM with a break after each round. Taxis in Ho Chi Minh
run on petrol and operate throughout the day. A working shift of a taxi driver is
normally 12 h. A 7-seat air-conditioned taxi was employed for a whole day for the
study. All taxis and <9-seat cars in Ho Chi Minh are air-conditioned. Working time of
the petrol-filling employee was 6 AM to 10 PM. The petrol-filling employee wore
a facemask made of cotton-cloth layers. This type of mask is very common in
Vietnam for protection from sunlight, particles and pollutants, and Vietnamese
citizens wear them when commuting by motorcycles. The protection ability of
facemasks from gas pollutants is not clear. Normally, petrol-filling employees, taxi
drivers and bus drivers work one week on and one week off.
2.2. Sampling
Passive sampling was applied for measurement of daily exposure of taxi and
motorcycleetaxi drivers, while active sampling was used for investigation of hourly
exposure in other cases. Active sampling was performed according to the NIOSH
1501 method (NIOSH, 2003). Air was drawn into sample tubes (Sibata 80150-0541,
70 mm Â
f
6 mm/4 mm, 200 mg of activated carbon) at a flow of 100 ml/min in
55 min or 110 min using a programmable minipump (MP
P
30, Sibata, Japan). The
pump was calibrated using a bubble flow meter. A sample tube holder was attached
on a breast pocket. Sampling was conducted throughout the day for the off-road
house, 6 AMe10 PM for the roadside house, street vendor, commuters, bus driver
and petrol-filling employee. To simulate the air that petrol-filling employee inhaled,
sampling tube was attached through a small hole into a PVC bottle (6 cm diameter
and 10 cm height), the mouth of which was covered by the same facemask that the
petrol-filling employee had. Sample tubes after sampling were sealed with plastic
caps. Passive sampling was performed using Lanwatsu passive samplers (Lan and
Binh, 2012). Passive samplers were attached on breast pockets. Sampling duration
was 24 h. Sampling rates of the Lanwatsu passive sampler at 30
C were 17.7, 16.2,
15.3, 15.1 and 14.4 ml/min, respectively, for benzene, toluene, ethylbenzene, p,m-
xylenes and o-xylene. Passive sampling was used in the second sampling campaign
(November 2010) for taxi and motorcycleetaxi drivers, while active sampling was
applied in the first sampling campaign (from June to July 2010) in other cases,
Sampling was done in working days. Totally, 65 samples were taken. All samples
were stored in a plastic bag sealed with a zippered laminar aluminium envelope and
kept in an airtight box, cold-stored and brought to the laboratory.
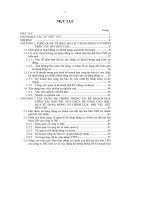
Sampling campaigns, climatic conditions obtained from Ho Chi Minh City
meteorological station (VVTS) and mixing layer depth obtained from HYSPLIT
Trajectory Model (NOAA) are given in Table 1 and Fig. 1. Ho Chi Minh has tropical
monsoon climate. A year has distinct dry season (DecembereApril) and rainy season
(MayeNovember). Temperature is stable all year round with a monthly average of
26
Ce28
C. The difference between daytime and nighttime temperature is 8
Ce
10
C. This difference is greater during the dry season compared with the rainy
season. Commonly, wind velocity in the evening is stronger than in the morning.
Surface thermal inversion is rather frequent in early morning in Ho Chi Minh. The
frequency of surface stable layers of several hundred metres at 7 AM is up to 30% for
any month in a year. Moreover, the thickness of surface stable layers during boreal
winter time is double or triple that of the rainy season. From March to May, the
frequency of surface stable layers decreases while their elevation above the surface
increases and reaches 1.2 km. In addition, additional stable layers develop at 1.5e
3.5 km height above unstable layers during the dry season (Nodzu et al., 2006).
The above conditions enable accumulation of pollutants on the surface in the early
morning.
2.3. Instrumental methods and materials
2.3.1. Chemicals and standards
All chemicals (puriss, anhydrous, analytical standard grade; with a purity
>99.5%) were purchased from SigmaeAldrich. Carbon disulfide was treated by
adding 20 mL of concentrated sulphuric acid and 10 drops of concentrated nitric acid
to 1 L of the solvent and shaking for two days. A CS
2
layer is then decanted off, dried
with anhydrous sodium sulphate and distilled. The treated CS
2
was checked for
benzene by gas chromatography (GC) analyses. Usually, one treatment is enough for
complete benzene removal. The bottle with benzene-free CS
2
was stored in a steel
box containing activated charcoal at 5
C to avoid recontamination.
A calibration curved was constructed using six working standards containing
benzene (0.110e3.52
m
g/ml), toluene (0.215e6.88
m
g/ml), ethylbenzene (0.0542e
1.72
m
g/ml), p,m-xylenes (0.108 e3.46
m
g/ml) and o-xylene (0.0550e1.76
m
g/ml)
and two internal standards (IS), fluorobenzene (3.20
m
g/ml) and chlorobenzene
(3.46
m
g/ml). The working standard solutions were stored in darkness at À5
C.
2.3.2. Analyses
Analysis was carried out within a week after sampling as it was described in our
previous report (Lan and Binh, 2012). A six-point linear calibration curve showed
correlation coefficients above 0.999 for all analytes. The limit of detection was 1.42,
1.35, 1.40, 1.41, 1.42 ng/ml, respectively, for benzene, toluene, ethylbenzene,
T.T.N. Lan et al. / Environmental Pollution 175 (2013) 56e63 57
p,m-xylenes and o-xylene. One working standard was routinely injected after each
ten injections to correct a change in calibration curves. The change was not more
than 2.6% for all analytes.
Pollutant concentrations in the air were evaluated using Eq. (1) for both active
and passive sampling
C ¼
ðW À W
blank
ÞÂ10
6
DE Â A Â t
(1)
Where W and W
blank
(
m
g) are the amounts of pollutant in sample and blank sample
by analyses, DE is desorption efficiency given by the producers for each lot of
charcoal and was 98% in this study, A is the sampling rate (ml/min), t is sampling
duration (hour).
Sampling rate of passive samplers was adjusted by using Eq. (2).
A
1
¼ A
2
Â
T
1
303
1:5
(2)
Where A
1
is a sampling rate at site temperature T
1
(K), A
2
is sampling rate at 30
C.
Two petrol types marketed in Vietnam, RON92 and RON95, were analysed.
Petrol was diluted in benzene-free carbon disulphide containing IS and injected into
the gas chromatograph for quantification.
2.4. Evaluation of daily benzene exposure
Daily exposure to benzene is evaluated using Eq. (3).
Daily exposure ¼
P
24
1
Hour Concentration  Duration of exposure
24
(3)
Sampling in the case of the taxi driver was conducted for two 12-h working
shifts. Actually, the taxi driver was exposed to the measured daily concentration for
only half a day, while the other half day he was exposed to indoor benzene levels in
his house. Sampling was not conducted in the evening and at night for the
commuters, bus driver, taxi driver, street vendor and petrol-filling employee.
Approximately, the indoor benzene concentration in the evening and at night in the
off-road house was assigned to the in-house exposure of the above individuals. This
way of evaluation was reasonable since most of the houses in Ho Chi Minh are
located on narrow residential lanes away from main roads, and the percentage of
roadside houses and buildings is very small.
The risk of leukaemia was roughly estimated using Eq. (4): here, the entire
population groups were considered to be exposed to benzene levels found in this
study for all their life.
Risk ¼
10
À4
 Daily exposure
17
(4)
An average daily exposure to benzene for the non-occupational population in
the city was approximately using Eq. (5), where a transportation usage rate was
evaluated using Eq. (6).
Average exposure ¼ Daily exposure
commuting mode
i
 usage rate
commuting mode
i
(5)
Usage rate
commuting mode
i
¼
Number of persons in vehicle
i
 traffic volume of vehicle
i
P
3
1
Number of persons in vehicle
i
 traffic volume of vehicle
i
 100
(6)
3. Results and discussion
3.1. Daily exposure to benzene in Ho Chi Minh City
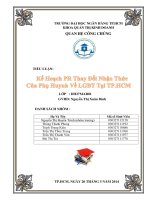
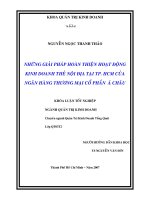
Daily exposure to benzene was given in Fig. 2. The housewife in
the off-road house was exposed to benzene levels of 2.7
m
g/m
3
;
while the one in the roadside house suffered 8.5-folds higher
benzene exposure at 23
m
g/m
3
. Exposure of the motorcycleetaxi
driver and the petrol-filling employee was 116 and 52
m
g/m
3
, and
is higher than roadside benzene levels of 45
m
g/m
3
. The daily
exposure for taxi and bus drivers was 21 and 15
m
g/m
3
, lower than
the exposure of the street vendor at 32
m
g/m
3
. Exposure of the
student commuting by a motorcycle was 19.6
m
g/m
3
, about four
folds of the exposure of the student commuting by bus (4.1
m
g/m
3
)
and of the lecturer commuting by a taxi (4.3
m
g/m
3
).
Should the obtained values hold for the entire group population,
the risk of leukaemia would be 1.2 Â 10
À5
, 2.4 Â 10
À6
, 2.5 Â 10
À6
,
1.6 Â 10
À6
,1.4Â 10
À5
, 9.0 Â 10
À6
,1.2Â 10
À5
,3.1Â 10
À5
,1.9Â 10
À5
,
respectively for motorcycle commuter, bus commuter, taxi
commuter, indoor/off-road housewife, indoor/roadside housewife,
bus driver, taxi driver, petrol-filling employee, and street vendor.
Up to now, there is not any published data on personal exposure
to pollutants and commuting behaviour in Ho Chi Minh City. Ho Chi
Minh is a big city in Vietnam with an area of 2095 km
2
. The distance
from the northernmost point to the southernmost point is 102 km,
and from the easternmost point to the westernmost point is 47 km.
Approximately, the average commuting time is considered to be
2 h/day/person. In this situation, the students and the lecturer can
Fig. 1. Daily variation in mixing layer depth during sampling campaigns.
Table 1
Climatic conditions of the exposure campaigns.
Rain Temperature (
C) Relative humidity
(%)
Pressure
(atm)
Wind speed
(km/h)
Wind direction Mixed layer
depth (m)
Range Average Range Average
Off-road June 14the15th 2010 No 23e34 28 47e100 80 0.9960 7 S, SW (daytime)
W, NW (night)
86e985
Roadside
a
June 21st 2010 No 25e31 28 62e100 85 0.9943 9 E, SE, S 172e1296
Vendor
a
Bus driver June 25th 2010 No 26e30 30 46e94 75 0.9927 13 S, SW 139e1157
Petrol-filling employee June 30th 2010 No 24e34 29 41e100 80 0.9939 9 S, SW, W 138e1371
Commuter/bus, commuter/
motorcycle
July 6th 2010 No 24e33 28 51e100 79 0.9960 8 S, SE (daytime)
NE (night)
84e1115
Commuter/taxi July 8th 2010 No 23e34 28 49e100 78 0.9954 6 NE, NW 128e1750
Taxi and motorcycleetaxi
driver
Nov 24the25th 2010 No 23e31 27 51e100 80 0.9945 5 S (daytime)
NW (night)
76e900
a
Short-time traffic jam was from 7 AM to 8 AM.
T.T.N. Lan et al. / Environmental Pollution 175 (2013) 56e6358
be considered as representative of the three non-occupational
population groups working indoors and commuting by motor-
cycle, bus and car. A percentage of the above population groups can
be roughly estimated from the traffic volume of the above means of
transport. The survey on the 24th November 2010 showed daily
traffic volumes of motorcycles, 2e5-seat cars, 7 e12-seat cars, 13e
29-seat passenger cars and >29-seat buses on 49 major and
minor roads in Ho Chi Minh were, respectively, 6,092,086, 122,292,
224,187, 33,516 and 30,335 (unpublished data). Approximately, the
number of 7-seat cars was about half of 7e12-seat cars. Normally,
12e29-seat passenger cars are long-distance intercity buses;
therefore, only numbers of motorcycles, 2e7-seat cars and >29-
seat buses are used for evaluation of the usage rate of commuting
modes. On average, the in-vehicle number of people in one vehicle
is 1.3, 2 and 35 for a motorcycle, 2e7-seat cars, and >29-seat buses.
Thus, the usage rate of motorcycle mode, car mode and bus mode is,
respectively, w87%, w1.3% and 11.7%. Thus, an average exposure to
benzene for the non-occupational population that has to commute
would be 19.6 Â 87% þ 4.3 Â 1.3% þ 4.1 Â 11.7%
m
g/m
3
¼ 18
m
g/m
3
;
here the non-commuting population group was neglected since
this group is composed of elderly and under-1-year-old children.
3.2. Daily profile of benzene exposure
It is important to know diurnal variation in benzene exposure
and sources of benzene. This information is essential for effective
solutions for reducing exposure. Measurement of diurnal variation
taken on a typical weekday showed that indoor exposure in the off-
road house was w4
m
g/m
3
from 6 AM to 20 PM, four times higher
than 0.96
m
g/m
3
at night. Indoor exposure in the roadside house
was similar to outdoor exposure, although commonly the indoor
exposure was lower than the outdoor exposure, as the house had its
doors open. Exposure was high in the morning and evening peak-
hours (7 AMe9 AM, 5 PMe7 PM) and low at midday (Fig. 3(a)).
Should this hold for other days, we could assume that diurnal
variation of indoor exposure in the roadside house is the same as
diurnal variation of roadside benzene concentration found in our
previous study (Lan et al., 2009, 2010); accordingly, roadside
benzene concentration was well correlated with the number of on-
road motorcycles. Indoor benzene levels at midday were higher
than outdoor benzene levels due to indoor stagnant conditions
depressing dispersion of pollutants. A very high benzene concen-
tration in the early morning was due to the short-time traffic jam in
the sampling day.
Fig. 3b gives the variation of exposure of the bus drive and
petrol-employee during the working day. Exposure of the petrol-
employee varied a lot (30ew130
m
g/m
3
), and was high in the
Fig. 2. Daily benzene exposure of different population groups in Ho Chi Minh.
a
b
c
Fig. 3. Hour variation in benzene exposure.
T.T.N. Lan et al. / Environmental Pollution 175 (2013) 56e63 59
morning and at night, and low at midday. This phenomenon is
difficult to explain since exposure of the petrol-employee depends
on many factors like traded amount of petrol, climatic conditions,
and working behaviour. Benzene exposure of the bus driver was
15
m
g/m
3
e35
m
g/m
3
with an average of 22
m
g/m
3
(Fig. 3b), and was
high in the morning and evening, and low at midday. It is difficult to
explain variation of the exposure of the bus driver, since a bus is
a moving object. Benzene levels inside a bus depends on many
factors like moving speed, number of stops, ventilation conditions,
outside benzene concentration, etc. Low mixing layer depth or the
possible formation of a stable surface layer in the early morning and
at nighttime could be one of the many reasons for the observed
high exposure in morning and nighttime for the petrol-filling
employee and bus driver.
Fig. 3c reports the daily profile of exposure to benzene of the
students and the lecturer. Exposure during commuting by bus, taxi
and motorcycle was 22e30
m
g/m
3
,22e39
m
g/m
3
and 185e240
m
g/
m
3
, respectively. The high exposure of the motorcyclist is due to
direct exposure to highly polluted streams of exhaust gas from his
own motorcycle and other on-road vehicles in a dense traffic fleet.
According to Lan et al. (2010), benzene concentration in exhaust gas
from 23 in-use motorcycles in Ho Chi Minh is in a range of 11e
1078 mg/m
3
and largely depends on vehicle technology, moving
speed and accumulated mileage. Benzene exposure should be
higher for lower technology and higher fleet density, depend largely
on climatic conditions. Eye irritation and headaches are symptoms
that motorcyclist in big cities in Vietnam often suffer; therefore,
they normally wear protective facemasks. On average, exposure to
benzene on the motorcycle was 7e8 times of those in the bus and
taxi. Benzene concentration was w3
m
g/m
3
in the university
campus, and w1
m
g/m
3
at home during nighttime. The contribution
of commuting in personal daily benzene exposure of university
students and staffs was almost 99% for motorcycles, and 60%e65%
in the bus and taxis. In other words, commuting contributes
a main part of personal exposure to benzene. This was reported by
Kuo et al. (2000) and Horton et al. (200 6) for Taichung and Perth.
3.3. Comparison of benzene exposure in Ho Chi Minh and in the
world
Studies on benzene exposure were conducted over the world.
Examples are the EXPOLIS (Hanninen et al., 2004) and PEOPLE
(Ballesta et al., 2006, 2007) projects. EXPOLIS is a population-based
study of urban adult personal exposures to multiple pollutants
conducted between 1996 and 1998 in Athens, Greece; Basel,
Switzerland; Grenoble, France; Helsinki, Finland; Milan, Italy; and
Prague, Czech Republic. The PEOPLE (Population Exposure to Air
Pollutants in Europe) project is a study of outdoor, indoor and
human exposure to benzene. The PEOPLE project involved sixcities,
namely Brussels, Lisbon, Bucharest, Ljubljana, Madrid and Dublin. A
similar project named UATMP (US EPA website, 2012a) was carried
out in the US. A study on benzene exposure was also conducted in
Asia (Liu et al., 2009; Navasumrit et al., 2005; Tunsaringkarn et al.,
2012).
Table 2 gives an overview of personal exposure to benzene
reported in the literature. Ho Chi Minh City is in a group of hi gh-
level exposure cities together with Athens and Bucharest. In Ho
Chi Minh, only a small percentage of the population, living far
from roads and commuti ng by taxi or by bus, has almost the same
exposure as in Europe, th e US and Asian developed countries,
while most of population is exposed to much higher benzene
levels. Proximity to main roads and motorcycle commuting
significan tly increase benzene exposure. Benzene exposure of the
petrol-filling employee during working time in this study was
30e120
m
g/m
3
, in the same order with the reported values of
17.5
m
g/m
3
e51
m
g/m
3
for urban areas in Ioannina, Greece
(Karakitsios et al., 2007), 92.75e121.67 pp b (290e390
m
g/m
3
)in
Bangkok, Thailand (Navasumrit et al., 2005; Tunsaringkarn et al.,
2012) and 530
m
g/m
3
in Rome (Carere et al., 1995). Daily
benzene exposure of the bus driver was 15.7
m
g/m
3
, almost half of
24.7
m
g/m
3
found in Athens (Chatzis et al., 2005).
Table 3 summarises mean in-vehicle benzene concentrations
reported. Motorcycle commuting is popular in Thailand, Malaysia,
Vietnam, Pakistan and India. On-motorcycle benzene levels found
in this study were in the same range of that reported for Taiwan. In
general, on-motorcycle benzene levels are higher than in-bus and
in-car benzene levels, and in-car benzene levels were often found
to be higher than that of in-bus levels. Except values obtained for
Taipei, Taichung (Taiwan) and Sydney (Australia), benzene levels in
buses and cars were from 5
m
g/m
3
to 50
m
g/m
3
.
3.4. Relationship between benzene and toluene
In urban areas, benzene is mainly airborne and generated by
vehicular traffic; therefore, toluene/benzene (T/B) ratio is often
used to evaluate the contribution of sources to atmospheric
benzene and toluene. A good relationship between species indi-
cates a single source. A clearly distinguishable ratio indicates
significant contributions of different sources. T/B values below 3
have been found to be characteristic of traffic emissions worldwide
(Perry and Gee, 1995; Brocco et al., 1997; Heeb et al., 2000; Monod
et al., 2001; Chan et al., 2002; Hiesh et al., 2006; Kumar and Tyagi,
2006; Khoder, 2007; Truc and Oanh, 2007; Hoque et al., 2008;
Hoshi et al., 2008; Liu et al., 2009; Matysik et al., 2010). T/B values of
1.5e4.3 are considered an indicator of traffic emissions, as reported
by Hoque et al. (2008) and Liu et al. (2009). For T/B values >4.3,
solvent source impacts are probable. A specific B/T ratio below 0.20
Table 2
Personal exposure to benzene (
m
g/m
3
) reported in literature.
Average for
population
Population
commuting
by bus
Population
commuting
by bus car
Athens, Greece 13.1e24.6 Chatzis et al.,
2005
Helsinki, Finland 2.6
n
e4.7
TSE
Edwards et al.,
2001
Rouen, France 4.7 Gonzalez-Flesca
et al., 2007Grenoble, France 6.4
Ile de France, France 5.3
Strasbourg, France 5.9
Florence, Italy 2.4
s
,7
w
2.3
s
, 6.6
w
Fondelli et al.,
2008
Perth (Australia) 1.76
s
, 1.98
w
Horton et al.,
2006
Copenhagen,
Denmark
5.22 Skov et al.,
2001
Windsor, Ontario
(Canada)
1.69
s
, 1.96
w
Stocco et al.,
2008
Oxford (England) 4.6 Lai et al., 2004
Brussels (Belgium) 5.1 4.5 5 Ballesta et al.,
2006Lisbon (Portugal) 6.1 5 5.3
Bucharest (Hungary) 12.9 13.2 18.8
Ljubljana 5.5 4 5
Madrid 5.1 8.8 10.9
Dublin, Ireland 2.9 2.4 2.4
Daegu, Korea 2.6e8.1 Park and Jo,
2004
Madrid, Spain 6.5 10 Ballesta et al.,
2008
California, USA 5.1 Marshall et al.,
2006
s
: spring,
w
: winter,
n
: non-smoking environment,
TSE
: tobacco smoking
environment.
T.T.N. Lan et al. / Environmental Pollution 175 (2013) 56e6360
has been proposed as an indicator of samples strongly affected by
industrial emissions in Dongguan, China (Barletta et al., 2008),
while a ratio of 0.4e1.0 has been used as an indicator of air
propelled by vehicular exhaust in Beijing (Wang et al., 2012). T/
B > 4.3 was used to identify sources influenced by solvent use in
Windsor, Ontario, Canada (Xu et al., 2010). A high T/B ratio (8.6) in
Taiwan suggested large additional sources of toluene from industry
(Hiesh et al., 2006). Monod et al. (2001) reported an overview of
inter-species ratios between BTEX species in different environ-
ments in Asia, Europe and South America, accordingly T/B value
was 2.3 (R
2
¼ 0.91) for a traffic microenvironment.
The contents of benzene and toluene in RON92 and RON95
petrols were 1.81, 4.55 and 1.85 and 4.20 wt%, respectively. Thus,
the T/B ratio in A92 and A95 gasoline were 2.5 and 2.3. Fig. 4 shows
daily profile of T/B ratio. T/B was 1.9e2.3 for the motorcycle mode
and 3.1e3.7 for the taxi mode, but was not put on Fig. 4 due to
limited data. T/B ratios for motorcycle, daytime outdoor air
(vendor) and indoor air, and bus microenvironment were similar to
that in petrol and in motorcycle exhaust (Lan et al., 2009), implying
the same origin of benzene and toluene from gasoline vehicles. The
higher T/B for indoor air and the street vendor in late evening and
nighttime can be explained by a change in fleet composition and
increase of the contribution of off-gassing from construction
materials due to decreases in traffic volume. Heavy trucks in Ho Chi
Minh are allowed from 8 PM to 6 AM. T/B was 3.1e3.7 for taxi, and
5e6 for the off-road house at nighttime, implying an additional
source of toluene, possibly from fragrances. T/B ratio for the petrol-
filling employee was the low at 1.28e1.57. The low T/B ratio at the
filling station is due to direct evaporation of petrol. Light benzene
evaporates more than toluene owing to higher vapour pressure and
results in a lower T/B ratio in comparison with the ratio in petrol.
This phenomenonwas observed by Correa et al. (2012), accordingly,
the presence of lighter BTEX was more pronounced in the atmo-
sphere of gas stations than in the gasoline vapour in equilibrium
with the liquid petrol.
4. Conclusions
Personal exposure to benzene was measured in Ho Chi Minh
City. The preliminary data showed that
(1) Benzene exposure was 22e30
m
g/m
3
for bus commuter, 22e
39
m
g/m
3
for taxi commuter, and 185e240
m
g/m
3
for motor-
cycle commuter.
(2) Average personal exposure to benzene in Ho Chi Minh is
around 18
m
g/m
3
, about 40% of the benzene level in outdoor
roadside air.
(3) Benzene exposure during commuting time contributes as the
main part of daily exposure.
(4) Motorcycleetaxi drivers, petrol-filling employees and street
vendors are people of high exposure to benzene.
Personal exposure to benzene is a changing parameter over time
and depends on many factors such as vehicle technology, use rate of
transportation modes, transportation behaviours, quality of fuels,
condition of infrastructures, climatic conditions, etc. Therefore,
further measurements, which replication over time, are needed for
a be risk assessment.
Acknowledgement
This research was supported by Vietnam National Foundation
for Development of Science and Technology (NAFOSTED).
References
Balanay, J.A.G., Lungu, C.T., 2009. Exposure of jeepney drivers in Manila, Philippines,
to selected volatile organic compounds (VOCs). Industrial Health 47, 33e42.
Ballesta, P., Field, R.A., Connolly, R., Cao, N., Caracena, A.B., De Saeger, E., 2006.
Population exposure to benzene: one day cross-sections in six European cities.
Atmospheric Environment 40, 3355e3366.
Ballesta, P., Field, R., Saeger, E., 2007. Population exposure to air pollutants in Europe
(people) how clean is the air in European cities? Communicating European
Research 2005 (2007), 211 e217. />Ballesta, P.P., Field, R.A., Patier, R.F., Madruga, D.G., Connolly, R., Caracena, A.B., De
Saeger, E., 2008. An approach for the evaluation of exposure patterns of urban
populations to air pollution. Atmospheric Environment 42, 5350e5364.
Barletta, B., Meinardi, S., Simpson, I.J., Zou, S., Rowland, F.S., Blake, D.R., 2008.
Ambient mixing ratios of nonmethane hydrocarbons (NMHCs) in two major
urban centers of the Pearl River Delta (PRD) region: Guangzhou and Dongguan.
Atmospheric Environment 42, 4393e4408.
Barrefors, G., Petersson, G., 1996. Exposure to volatile hydrocarbons in commuter
trains and diesel buses. Environmental Technology 17, 643e647.
Batterman, S.A., Peng, C.Y., Braun, J., 2002. Levels and composition of volatile
organic compounds on commuting routes in Detroit, Michigan. Atmospheric
Environment 36, 6015e6030.
Bois, F.Y., Jackson, E.T., Pekari, K., Smith, M.T., 1996. Population toxicokinetics of
benzene. Environmental Health Perspectives 104, 1405e141 1.
Brocco, D., Fratarcangeli, R., Lepore, L., Petricca, M., Ventrone, I.,1997. Determination
of aromatic hydrocarbons in urban air of Rome. Atmospheric Environment 31,
557e566.
Table 3
In-vehicle benzene concentration (
m
g/m
3
) in urban areas.
Bus Car, Taxi Motorcycle
Current study 15e35 22e39 185e240
Bangkok, Thailand 11.7, 37.1 Maneerat and
Orathai, 2010
Detroit, Michigan 14.1e21.5 7.9e21.2 Batterman et al.,
2002
Dublin, Ireland 5.2 6.5 McNabola et al.,
2008
Gothenburg,
Sweden
7.2 Barrefors and
Petersson, 1996
Guangzhou, China 11.3e13.5 33.6 Chan et al., 2003
Kao-Pin, Taiwan 19e459 Lee et al., 2006
Korea, Taegu 20.7 33.1 Lee and Jo, 2002
Madrid, Spain 15 Ballesta et al.,
2008
Manila,
Philippines
55.6 Balanay and
Lungu, 2009
Mexico City,
Mexico
34 41.9 Shiohara et al.,
2005
Mexico City,
Mexico
19e42 Wohrnschimmel
et al., 2008
Munich, Germany 8.1 Rommelt et al.,
1999
Sydney, Australia 81e98 72e157 Duffy and Nelson,
1997
Taichung, Taiwan 135 145 Kuo et al., 2000
Taipei, Taiwan 160 248 371 Chan et al., 1994
Fig. 4. Hour variation in toluene/benzene ratio.
T.T.N. Lan et al. / Environmental Pollution 175 (2013) 56e63 61
Carere, A., Antoccia, A., Crebelli, R., Di Chiara, D., Fuselli, S., Iavarone, I., Isacchi, G.,
Lagorio, S., Leopardi, P., Marcon, F., 1995. Exposure to benzene and genotoxic
effects among filling station attendants. Epidemiologia E Prevenzione 19 (62),
105e119.
Chan, C.C., Lin, S.H., Her, G.R., 1994. Office worker’s exposure to volatile organic
compounds while commuting and working in Taipei city. Atmospheric Envi-
ronment 28, 2351e2359.
Chan, C.Y., Chan, L.Y., Wang, X.M., Liu, Y.M., Lee, S.C., Zou, S.C., Sheng, G.Y., Fu, J.M.,
2002. Volatile organic compounds in roadside microenvironments of metro-
politan Hong Kong. Atmospheric Environment 36, 2039e2047.
Chan, L.Y., Lau, W.L., Wang, X.M., Tang, J.H., 2003. Preliminary measurements of
aromatic VOCs in public transportation modes in Guangzhou, China. Environ-
ment International 29, 429e435.
Chatzis, C., Alexopoulos, E.C., Linos, A., 2005. Indoor and outdoor personal
exposure to benzene in Athens, Greece. Science of the Total Environment
349, 72e80.
Correa, S.M., Arbilla, G., Marques, M.R.C., Oliveira, K.M.P.G., 2012. The impact of
BTEX emissions from gas stations into the atmosphere. Atmospheric Pollution
Research 3, 163e169.
Cronkite, E.P., Drew, R.T., Inoue, T., Bullis, J.E., 1985. Benzene hematotoxicity and
leukemogenesis. American Journal of Industrial Medicine 7, 447e456.
Crump, K.S., 1994. Risk of benzene-induced leukemia: a sensitivity analysis of the
Pliofilm cohort with additional follow-up and new exposure estimates. Journal
of Toxicology and Environmental Health 42, 219e242.
Duffy, B.L., Nelson, P.F.,1997. Exposure to emissions of 1,3-butadiene and benzene in
the cabins of moving motor vehicles and buses in Sydney, Australia. Atmo-
spheric Environment 31, 3877e3885.
Edwards, R.D., Jurvelin, J., Saarela, K., Jantunen, M., 2001. VOC concentrations
measured in personal samples and residential indoor, outdoor and workplace
microenvironments in EXPOLIS-Helsinki, Finland. Atmospheric Environment
35, 4531e4543.
Fondelli, M.C., Bavazzano, P., Grechi, D., Gorini, G., Miligi, L., Marchese, G., Cenni, I.,
Scala, D., Chellini, E., Costantini, A.S., 2008. Benzene exposure in a sample of
population residing in a district of Florence, Italy. Science of the Total Envi-
ronment 392, 41e49.
Gallego, E., Roca, F.X., Guardino, X., Rosell, M.G., 2008. Indoor and outdoor BTX
levels in Barcelona City metropolitan area and Catalan rural areas. Journal of
Environmental Sciences 20, 1063e1069.
Gonzalez-Flesca, N., Nerriere, E., Leclerc, C., Le Meur, S., Marfaing, H.,
Hautemaniere, A., Zmirou-Navier, D., 2007. Personal exposure of children and
adults to airborne benzene in four French cities. Atmospheric Environment 41,
2549e2558.
Hanninen, O.O., Alm, A., Katsouyanni, K., Kunzli, N., Maroni, M.,
Nieuwenhuijsen, M.J., Saarela, K., Sram, R.J., Zmirouh, D., Jantunena, M.J., 2004.
The EXPOLIS study: implications for exposure research and environmental
policy in Europe. Journal of Exposure Analysis and Environmental Epidemiology
14, 440e456.
Heeb, N.V., Forss, A.M., Bach, C., Reimann, S., Herzog, A., Jäckle, H.W., 2000.
A comparison of benzene, toluene and C
2
-benzene mixing ratios in automotive
exhaust and in the suburban atmosphere during the introduction of catalytic
converter technology to the Swiss Car Fleet. Atmospheric Environment 34,
3103e31 16.
Hiesh, L.T., Yang, H.H., Chen, H.W., 2006. Ambient BTEX and MTBE in the neigh-
borhoods of different industrial parks in Southern Taiwan. Journal of Hazardous
Materials 128, 106e115.
Hoque, R.R., Khillare, P.S., Agarwal, T., Shridhar, V., Balachandran, S., 2008. Spatial
and temporal variation of BTEX in the urban atmosphere of Delhi, India. Science
of the Total Environment 392, 30e40.
Horton, A., Murray, F., Bulsara, M., Hinwood, A., Farrar, D., 2006. Personal
monitoring of benzene in Perth, Western Australia: the contribution of
sources to non-industrial personal exposure. Atmospheric Environment 40,
2596e2606.
Hoshi, J., Amano, S., Sasaki, Y., Korenaga, T., 2008. Investigation and estimation of
emission sources of 54 volatile organic compounds in ambient air in Tokyo.
Atmospheric Environment 42, 2383e2393.
Karakitsios, S.P., Papaloukas, L.C., Kassomenos, P.A., Pilidis, G.A., 2007. Assessment
and prediction of exposure to benzene of filling station employees. Atmo-
spheric Environment 41, 9555e9569.
Khoder, M.I., 2007. Ambient levels of volatile organic compounds in the atmosphere
of Greater Cairo. Atmospheric Environment 41, 554e566.
Kumar, A., Tyagi, S.K., 2006. Benzene and toluene profiles in ambient air of Delhi as
determine by active sampling and GC analyses. Journal of Science and Industrial
Research 65, 252e257.
Kuo, H.W., Wei, H.C., Liu, C.S., Lo, Y.Y., Wang, W.C., Lai, J.S., Chan, C.C., 2000. Exposure
to volatile organic compounds while commuting in Taichung, Taiwan. Atmo-
spheric Environment 34, 3331e3336.
Lai, H.K., Kendall, M., Ferrier, H., Lindup, I., Almd, S., Hanninen, O., Jantunen, M.,
Mathys, P., Colvile, R., Ashmore, M.R., Cullinan, P., Nieuwenhuijsen, M.J., 2004.
Personal exposures and microenvironment concentrations of PM
2.5
, VOC, NO
2
and CO in Oxford, UK. Atmospheric Environment 38, 6399e6410.
Lan, T.T.N., Le, V.N., Le, U.T.M., 2011. Daily benzene concentration in the road-side air
in HoChiMinh city measured by Lanwatsu passive samplers. In: Proc. ICAS 2011.
25pC103.
Lan, T.T.N., Binh, N.T.T., 2012. Da ily roadside BTEX concentrations in East Asia
measured by the Lanwatsu, Radiello and Ultra I SKS passive samplers.
Science of the Total Environment. />08.086.
Lan, T.T.N., Binh, N.T.T., Minh, P.A., Minh, N.H.N., Kondo, A., Kaga, A., 2010. Real-
world emission factors of benzene, toluene, ethylbenzene and xylenes from
motorcycles. In: Proc. 19th Symposium on Environmental Chemistry. Japan
Society of Environmental Chemistry, pp. 210e211.
Lan, T.T.N., Minh, P.A., Ha, D.N., 2009. Atmospheric benzene, toluene, ethylbenzene
and xylenes in relation with traffic in HoChiMinh City. In: Proc. 18th Symposium
on Environmental Chemistry. Japan Society of Environmental Chemistry,
pp. 130e131.
Lee, C.W., Chang, B.H., Hung, C.H., Huang, Y.L., Yuan, C.S., 2006. Commuter
exposures to VOCs and PM
2.5
in Kao-Pin Area of Taiwan. Epidemiology 17,
S456.
Lee, J.W., Jo, W.K., 2002. Actual commuter exposure to methyltertiary butyl ether,
benzene and toluene while traveling in Korean urban areas. The Science of the
Total Environment 291, 219e228.
Liu, H., Liang, Y., Bowes, S., Xu, H., Zhou, Y., Armstrong, T.W., Wong, O.,
Schnatter, A.R., Fang, J., Wang, L., Nie, L., Fu, H., Irons, R., 2009. Benzene
exposure in industries using or manufacturing paint in China e a literature
review, 1956e2005. Journal of Occupational and Environmental Hygiene 6,
659e670.
Maneerat, O., Orathai, C., 2010. Commuter exposure to BTEX in public transportation
modes in Bangkok, Thailand. Journal of Environmental Sciences, 397e404.
Marshall, J.D., Granvold, P.W., Hoats, A.S., McKone, T.E., Deakin, E., Nazaroff, W.W.,
2006. Inhalation intake of ambient air pollution in California’s South Coast Air
Basin. Atmospheric Environment 40, 4381e4392.
Matysik, S., Ramadan, A.B., Schlink, U., 2010. Spatial and temporal variation of
outdoor and indoor exposure of volatile organic compounds in Greater Cairo.
Atmospheric Pollution Research 1, 94e101.
McNabola, A., Broderick, B.M., Gill, L.W., 2008. Relative exposure to fine particulate
matter and VOCs between transport microenvironments in Dublin: personal
exposure and uptake. Atmospheric Environment 42, 6496e6512.
Monod, A., Sive, B.C., Avino, P., Chen, T., Blake, D.R., Sherwood, R.F., 2001. Mono-
aromatic compounds in ambient air of various cities: a focus on correlations
between the xylenes and ethylbenzene. Atmospheric Environment 35, 135e
149.
Navasumrit, P., Chanvaivit, S., Intarasunanont, P., Arayasiri, M., Lauhareungpanya, N.,
Parnlob, V., Settachan, D., Ruchirawat, M., 2005. Environmental and occupa-
tional exposure to benzene in Thailand. Chemico-Biological Interactions 30
(153e154), 75e83.
NIOSH, 2003. Hydrocarbons, Aromatic: Method 1501, fourth ed. NIOSH Manual of
Analytical Methods (NMAM).
Nodzu, M.I., Ogino, S.Y., Tachibana, Y., Yamanaka, M.D., 2006. Climatological
description of seasonal variations in lower-tropospheric temperature
inversion layers over the Indochina Peninsula. Journal of Climate 19, 3307e
3319.
Park, K.H., Jo, W.K., 2004. Personal volatile organic compound (VOC) exposure of
children attending elementary schools adjacent to industrial complex. Atmo-
spheric Environment 38, 1303e1312.
Perry, R., Gee, I.L., 1995. Vehicle emissions in relation to fuel composition. Science of
the Total Environment 169, 149e156.
Rinsky, R.A., Smith, A.B., Horning, R., Filloon, T.G., Young, R.J., Okun, A.H.,
Landrigan, P.J., 1987. Benzene and leukemia: an epidemiologic risk assessment.
New England Journal of Medicine 316, 1044e1050.
Rommelt, H., Pfaller, A., Fruhmann, G., Nowak, D., 1999. Benzene exposures caused
by traffic in Munich public transportation systems between 1993 and 1997. The
Science of the Total Environment 241, 197e203.
Shiohara, N., Bremauntz, A.A.F., Jimenez, S.B., Yanagisawa, Y., 2005. The commuters’
exposure to volatile chemicals and carcinogenic risk in Mexico City. Atmo-
spheric Environment 39, 3481e3489.
Skov, H., Hansen, A.B., Lorenzen, G., Andersen, H.V., Lofstrom, P., Christensen, C.S.,
2001. Benzene exposure and the effect of traffic pollution in Copenhagen,
Denmark. Atmospheric Environment 35, 2463e2471.
Snyder, C.A., Goldstein, B.D., Sellakumar, A.R., Bromberg, I., Laskin, S., Albert, R.E.,
1980. The inhalation toxicity of benzene: incidence of hematopoietic neoplasms
and hematoxicity in AKR/J and C57BL/6J mice. Toxicology and Applied Phar-
macology 54, 323e331.
Snyder, R., Witz, G., Goldstein, B.D., 1993. The toxicology of benzene. Environmental
Health Perspectives 100, 293e
306.
S
tocco, C., MacNeill, M., Wang, D., Xu, X., Guay, M., Brook, J., Wheeler, A.J., 2008.
Predicting personal exposure of Windsor, Ontario residents to volatile organic
compounds using indoor measurements and survey data. Atmospheric Envi-
ronment 42, 5905e5912.
Truc, V.T.Q., Oanh, N.T.K., 2007. Roadside BTEX and other gaseous air pollutants in
relation to emission sources. Atmospheric Environment 41, 7685e7697 .
Tunsaringkarn, T., Siriwong, W., Rungsiyothin, A., Nopparatbundit, S., 2012. Occu-
pational exposure of gasoline station workers to BTEX compounds in Bangkok,
Thailand. The International Journal of Occupational and Environmental Medi-
cine 3 (3), 117e125.
US EPA, 2012a. 2001 Urban Air Toxics Monitoring Program (UATMP). From: http://
www.epa.gov/ttn/atw/hlthef/benzene.html.
US EPA, 2012b. Benzene. From: />Wang, Y., Ren, X., Ji, D., Zhang, J., Sun, J., Wu, F., 2012. Characterization of volatile
organic compounds in the urban area of Beijing from 2000 to 2007. Journal of
Environmental Sciences 24, 95e101.
T.T.N. Lan et al. / Environmental Pollution 175 (2013) 56e6362
WHO, 2000. Benzene. In: Air Quality Guidelines for Europe, second ed.
World Health Organization Regional Office for Europe, Co penhagen.
From: 0 5/74732/E71922.
pdf.
Wohrnschimmel, H., Zuk, M., Martınez-Villa, G., Ceron, J., Cardenas, B., Rojas-
Bracho, L., Bremauntz, A.F., 2008. The impact of a Bus Rapid Transit system on
commuters’ exposure to Benzene, CO, PM
2.5
and PM
10
in Mexico City. Atmo-
spheric Environment 42, 8194e8203.
Xu, X., Pereira, M., Miller, L.J., Grgicak-Mannion, A., Wheeler, A., 2010. Methods used
to detect additional sources using Toluene/Benzene in Windsor, Ontario (2004e
2006). In: Proceedings of 2010 American Geophysical Union Fall Meeting:
Atmospheric Sciences. San Francisco, California, USA. 13e17 March.
T.T.N. Lan et al. / Environmental Pollution 175 (2013) 56e63 63