báo cáo hóa học:" Validation of a flow cytometry based chemokine internalization assay for use in evaluating the pharmacodynamic response to a receptor antagonist" potx
Bạn đang xem bản rút gọn của tài liệu. Xem và tải ngay bản đầy đủ của tài liệu tại đây (1.1 MB, 12 trang )
BioMed Central
Page 1 of 12
(page number not for citation purposes)
Journal of Translational Medicine
Open Access
Methodology
Validation of a flow cytometry based chemokine internalization
assay for use in evaluating the pharmacodynamic response to a
receptor antagonist
Timothy Wyant*
1
, Alan Lackey
2,3
and Marie Green
1
Address:
1
Millennium Pharmaceuticals, Cambridge, MA, USA,
2
Esoterix Center for Clinical Trials, Brentwood, TN, USA and
3
Nodality Inc.
Brentwood, TN, USA
Email: Timothy Wyant* - ; Alan Lackey - ; Marie Green -
* Corresponding author
Abstract
Pharmacodynamic assays are important in clinical trial design to investigate the relationship
between drug concentration (pharmacokinetics) and drug "effect' or biological activity. Increasingly
flow cytometry is being used to examine the pharmacodynamic effect of new drug entities.
However, to date, the analytical validation of cytometry based assays is limited and there is no
suitable guidance for method validation of flow cytometry-based pharmacodynamic assays. Here
we report the validation of a flow cytometry-based chemokine internalization assay for use in
evaluating the effect of a receptor antagonist in clinical trials. The assay method was validated by
examining the stability of the reagent, assay robustness, sensitivity, repeatability and reproducibility
precision. Experimental results show the assay reagent was stable over 26 weeks. The assay
demonstrated a sensitivity to distinguish 0.005 μg/ml of a CCR2 antagonist with a %CV of 13.3%.
The intra-assay repeatability was less than 15% with an inter-assay repeatability of less than 20%. In
vivo study results demonstrated that the assay was consistent and a reliable measure of antagonist
activity.
Background
Chemokines are a class of small proteins that have potent
chemotactic activity for cells of the immune system. In
addition, they have the ability to activate leukocytes, to
stimulate cytokine and proteolytic enzyme production, to
mediate angiogenesis, and may be involved in cell prolif-
eration and death. [1] The chemokine receptor CCR2 is
widely expressed on mononuclear cells and a subset of
memory (CD45RO+) CD4+ helper T cells. Activation of
CCR2 by monocyte chemoattractant protein-1 (MCP-1),
the major CCR2 ligand, is known to mediate chemotaxis
and degranulation of monocytes as well as migration of
activated effector memory T cells. [2,3] The MCP-1/CCR2
pathway has been implicated in a variety of disease states
such as Rheumatoid Arthritis, Multiple Sclerosis, and
Atherosclerosis making the development of antagonists of
this pathway an attractive pharmacological target [4-8].
Currently several companies have begun clinical trials of
CCR2 antagonists [9].
In vitro pharmacodynamic assays are increasingly being
utilized to demonstrate that a compound is having a
desired biological effect after in vivo dosing. For CCR2
antagonists, the monitored effect is inhibition of either
receptor signaling or ligand binding, depending on the
mode of action of the drug being examined. When bound
Published: 1 December 2008
Journal of Translational Medicine 2008, 6:76 doi:10.1186/1479-5876-6-76
Received: 3 September 2008
Accepted: 1 December 2008
This article is available from: />© 2008 Wyant et al; licensee BioMed Central Ltd.
This is an Open Access article distributed under the terms of the Creative Commons Attribution License ( />),
which permits unrestricted use, distribution, and reproduction in any medium, provided the original work is properly cited.
Journal of Translational Medicine 2008, 6:76 />Page 2 of 12
(page number not for citation purposes)
to their receptors chemokines, such as MCP-1, induce the
receptor to internalize [2,3]. We have capitalized on this
and developed a flow cytometry assay to measure MCP-1
ligand internalization in clinical trials as a measure of the
pharmacodynamic effect of our CCR2 antagonist.
Unlike pharmacokinetic and immunogenicity assays [10-
15], there has not been any regulatory guidance published
on the essential parameters for validation of pharmacody-
namic assays such as those based on flow cytometry. In
the past, variations in instruments, instrument settings,
reagents and population heterogeneity had made validat-
ing assays based on flow cytometry difficult. Fortunately,
advances in instrument standardization protocols based
on fluorescent beads, more user friendly instruments and
a greater reagent and instrument control by manufacturers
has now made it possible to address the criteria and rigor
that would accompany a validated flow cytometry assay
[16]. Using the guidance for ligand binding assays [12] as
a foundation in which to base the validation of a flow
cytometry pharmacodynamic assay and applying the
"appropriate" parameters for a cell based cytometry assay,
we validated a MCP-1 internalization assay. The parame-
ters we examined included the stability of the reagents, the
robustness, sensitivity, repeatability, precision and repro-
ducibility of the assay. The precision was determined both
in the in vitro validation phase and through retrospective
analysis of in-study data.
Methods
Generation of Alexa 488 labeled MCP-1
Recombinant carrier free human MCP-1 was purchased
from R&D Systems and fluorescently labeled with Alexa
488 (In Vitrogen Molecular Probes) using the conditions
recommended for small proteins by Molecular Probes
procedure. Alexa Fluor 488 was chosen due to the dye's
increased stability and resistance to pH changes over a
wide range of pH values (InVitrogen). The Alexa-488
labeled MCP-1 (AF488-MCP-1) was purified from the
excess labeling reagent and free MCP-1 by RP-HPLC using
a Vydac C18 semi-prep column (10 × 250 mm) and Bio-
Cad Vision Workstation. Labeled Peaks were identified
and examined for their ability to bind to receptor positive
cells. Identified peaks were pooled and retested for bind-
ing in a flow cytometry binding assay. The reagent was
aliquoted, tested for freeze-thaw stability and frozen at -
70°C.
MCP-1 alexa 488 internalization assay
Briefly, whole blood was incubated with AF488-MCP-1
for one hour at 37°C. Erythrocytes were lysed using
PharmLyse (BectonDickenson) and the remaining white
blood cells were briefly exposed to an acid salt wash (0.5
M NaCl, 0.2 M Acetic Acid, 0.5% sodium azide) by sus-
pending the cells in 1 mL of solution for 5 minutes. This
procedure was done to strip surface AF488-MCP-1 allow-
ing only internalized AF488 MCP-1 to be observed. Sam-
ples were subsequently washed with PBS (pH 7.4) and a
cocktail of anti-CD14 APC, anti-CD45RO PE, anti-CD4
PerCP was added to identify the CCR2 expressing mono-
cytes and memory T cells during acquisition and analysis.
Formaldehyde (1.5%) was added to fix the samples which
were then analyzed on a flow cytometer (BD FACS Cali-
bur). In one reaction, excess unlabeled MCP-1 was added
prior to the addition of AF488-MCP-1 as a control. An
example of the staining is in Figure 1. For most purposes
the internalization assay was performed within 2 hours of
blood draw. However, as part of the validation the ability
to process the blood after 24 hours was examined (see
below).
For the purpose of assay validation, whole blood collected
from normal healthy volunteers was incubated ex-vivo
either with or without the CCR2 antagonist prior to the
addition of the fluorescent staining reagents. MESF (Mean
Equivalence of Soluble Fluorescence) values were deter-
mined by utilizing standardized MESF calibration beads
(Bangs Laboratories Fishers, IN).
Assay validation
Overall criteria for evaluation
In general, for determination of %CV relevance, the guide-
lines established for ligand binding ELISA pharmacoki-
netic assays [10] was used to establish the %CV
boundaries. A %CV less than 20% was considered an
acceptable parameter. A 25% CV was used for values fall-
ing on the lower ends of curves. It was expected that frac-
tional values such as that observed after saturation
inhibition to have greater variability. Similarly, the inter-
person variability was also anticipated to be greater and
was to be documented here by retrospective analysis of
phase one data.
Instrument set-up, MESF calibration and data analysis
A Becton Dickenson FACSCalibur instrument using 488
argon and red-diode lasers was calibrated daily using QC3
calibration beads (Bangs Laboratories). MESF was deter-
mined using the Quantum 1000 series bead sets from
Bangs Laboratories daily. All raw instrument data was
analyzed using WinList 5.0 (Verty Software House). Curve
fitting and determination of EC
50
and IC
50
values was per-
formed using Prism 4.0 (Graphpad) when applicable. The
mean, standard deviation, standard error and % coeffi-
cient of variation (%CV) were calculated using Excel 2003
(Microsoft).
Reagent titration on whole blood
In order to determine the optimum reagent AF488-MCP-
1 concentrations to use in the assay, a titration curve was
performed. Serial dilutions of AF488-MCP-1 was added to
Journal of Translational Medicine 2008, 6:76 />Page 3 of 12
(page number not for citation purposes)
80 μL of whole blood and allowed to incubate at 37°C for
1 hour. The maximum internalization at 1 hour was deter-
mined to be the point at which no additional fluorescence
was observed with increasing concentrations of AF488-
MCP-1. For purposes of the in vitro validation, titration
curves were generated by serially diluting a CCR2 antago-
nist into whole blood and incubating at room tempera-
ture for one hour prior to addition of the AF488-MCP-1.
The CCR2 antagonist used here was an in house anti-
CCR2 antibody which had been demonstrated to inhibit
the binding and activity of MCP-1 in vitro (data not
shown).
Stability
AF488-MCP-1 reagent stability was determined by exam-
ining both the binding of AF488-MCP-1 in whole blood
over time and after five freeze-thaw cycles of the reagents.
Stability of the AF488-MCP-1 was measured over a 26
week period at -70°C. Stock reagent stored at -70°C was
diluted down to 150 nM, 100 nM, and 50 nM and added
to whole blood (final concentration of AF488-MCP: 15
nM, 10 nM, 5 nM). Four different healthy volunteer blood
donors were tested in the internalization assay at each
time point and the resulting MESF and % positive values
from each individual were averaged. Freeze-thaw (-70°C)
stability was assessed by aliquoting the AF488-MCP-1 and
cycling the various aliquots through different numbers of
freeze-thaws. The cycled AF488-MCP-1 was subsequently
utilized in the internalization assay and the resultant val-
ues for each cycle compared. Since the material was frozen
after production the 1
st
freeze thaw cycle is the baseline
value from which all other freeze thaw values were com-
pared.
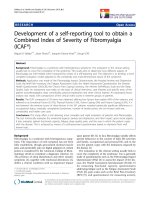
Representative histogram of AF488-MCP-1 staining in human whole bloodFigure 1
Representative histogram of AF488-MCP-1 staining in human whole blood. Cells were stained with AF488-MCP-1 in the pres-
ence (black) or absence of a CCR2 receptor antagonist (blue) and without the AF488-MCP-1 (red). Gating was based on the
monocyte profile in forward and side scatter followed by gating on the CD14+ monocyte population.
10
0
10
1
10
2
10
3
10
4
MCP-1 Alexa-488
0 50 100 150 20
0
Number
10
0
10
1
10
2
10
3
10
4
MCP-1 Alexa-488
0 50 100 150 20
0
Number
10
0
10
1
10
2
10
3
10
4
MCP-1 Alexa-488
0 50 100 150 20
0
Number
No inhibitor
+ AF488MCP-1
CCR2 antagonist
No AF488MCP-1
0 200 400 600 800 1000
FSC-Height
0 200 400 600 800 1000
SSC-Height
R1
R2
10
0
10
1
10
2
10
3
10
4
CD45RO PE
10
0
10
1
10
2
10
3
10
4
CD14 APC
R5
CD45RO
FSC
SSC
CD14
Journal of Translational Medicine 2008, 6:76 />Page 4 of 12
(page number not for citation purposes)
Robustness and sensitivity
Assay robustness was defined as how "reproducibly" the
assay performed over time within the same blood sample,
or in other words, how well the assay can withstand delib-
erate manipulation of environmental influences. Since
the whole blood samples were to be shipped to a process-
ing site, robustness was addressed by assaying the inter-
nalization of bound AF488-MCP-1 in CD14 (+) and
CD4+CDR45RO+ cells over time at 1 hour, 24 hours, 48
hours and 72 hours after in vitro spiking of whole blood
samples. Changes in overall fluorescence or the percent-
age of cells able to internalize MCP-1 were compared to
the one hour "fresh" sample. Additionally, in order to
examine the effect of overnight shipping on inhibition of
internalization of AF488-MCP-1 by the receptor antago-
nist a direct comparison of the effect of overnight storage
on the IC
50
of the CCR2 inhibitor was examined. Briefly,
receptor antagonist was incubated with whole blood at
ambient temperature for 24 hours followed by processing
through the internalization assay. Results obtained from
the overnight incubation were compared to results
obtained by processing the whole blood after only one
hour incubation with the CCR2 antagonist.
The sensitivity of the assay, or the ability of the assay to
demonstrate inhibition of ligand internalization at low
concentrations of CCR2 inhibitor, was determined by
serially diluting the CCR2 antagonist into whole blood
and incubating for 1 hour at room temperature. The
curves generated from the results of a minimum of 4 indi-
viduals were averaged.
Precision (repeatability/reproducibility)
Assay reproducibility was determined by assaying inter-
nalization of AF488-MCP-1 from the 10 different donors'
blood drawn at 3 different times (each individual drawn
3 times). The blood draws were spaced 2–4 days apart to
allow for recovery of the donor prior to the next blood
draw. Measuring the intra-individual donor repeatability
was accomplished by performing the internalization assay
in triplicate. The mean, standard deviation and % CV were
calculated from triplicate values (intra-sample repeatabil-
ity), for each individual over time (intra-person reproduc-
ibility/inter-assay repeatability), and across individuals
(inter-person reproducibility).
In-study validation
108 individuals (54 placebos, 54 CCR2-antagonist
treated) were assayed in the internalization assay over a
113 day in the absence (placebos) or presence (treated) of
AF488-MCP-1 the CCR2 receptor antagonist. Volunteers
were dosed with a single dose of either antagonist or vehi-
cle control and whole blood was drawn, shipped over-
night to the processing laboratory and assayed. Blood
samples were drawn prior to dosing (pre) and immedi-
ately (within 5 minutes) following completion of the
infusion on Day 1, and again on day 3 (9 individuals
only), 8, 15, 29, 43, 57, 71, 85, and 113. All 108 (54 pla-
cebo and 54 dosed) individuals were assessed at all time
points except day 3. Mean, standard deviation % CV and
standard error for the data grouped across all placebos
and placebos + pre-dose of all 108 individuals were exam-
ined. The pharmacodynamic effect was examined by plot-
ting the internalization of AF488-MCP-1 in CD14+
monocytes and memory helper T cells (CD4+CD45RO+)
after dosing with the CCR2 antagonist on the first day. The
pharmacodynamic effect in the dosed group was meas-
ured throughout the period however; the pharmacoki-
netic/pharmacodynamic relationship is beyond the scope
of this manuscript.
Results
Reagent titration
In order to determine the optimum concentration of
AF488-MCP-1 to use in the assay the reagent was titrated
on whole blood from 3 healthy volunteers and a titration
curve was produced. As shown in Figure 2a, saturation of
binding was achieved at a concentration of 60–70 nM of
AF488-MCP-1. Since the internalization assay is to be
used as a measure of pharmacodynamic effect of a CCR2
antagonist, it was also important to demonstrate the abil-
ity of the CCR2 antagonist to inhibit the saturating con-
centration of the AF488-MCP-1 used in the assay. To
accomplish this CCR2 antagonist was titrated into the
assay using the derived optimum AF488-MCP-1 concen-
tration and an inhibition curve was generated. As shown
in figure 2b, the CCR2 antagonist was able to inhibit the
internalization of a saturating concentration of AF488-
MCP-1. This result confirmed that 60 nM was the opti-
mum concentration AF488-MCP-1 to use in the internali-
zation assay.
Reagent stability
The stability of the AF488-MCP-1 reagent, stored at -
70°C, was determined in the whole blood internalization
assay by performing the assay on 4 different volunteers
(differing at each time point) over a period ending at 26
weeks. The baseline value represents 6 weeks post manu-
facture of the reagent. The results demonstrate consistent
staining despite prolonged storage of the AF488-MCP-1 at
-70°C (Figure 3). There appeared to be a 20–30% drop in
intensity of fluorescence (MESF) at the 26 week time
point however, the overall results suggest this drop may
be more of a reflection in donor variability rather than sta-
bility of the reagent (the same drop was observed at 10
weeks yet at 16 weeks the intensity was higher than that at
6 weeks). There was no significant difference between the
MESF value obtained at baseline and week 4 (p = 0.15) or
between week 4 and week 26 (p = 0.34).
Journal of Translational Medicine 2008, 6:76 />Page 5 of 12
(page number not for citation purposes)
In addition the AF488-MCP-1 was also assayed after five
freeze/thaws. Using the same whole blood sample, there
did not appear to be an effect of the first 4 freeze thaw
cycles on internalization (as shown by a lack in the
decrease in MESF or percent positive) (Table 1) as com-
pared to initial freeze-thaw. However, an 11.8% decrease
in MESF value was observed after the 5
th
freeze thaw/cycle.
Due to this 12% decrease at the 5
th
freeze thaw cycle, it
was decided that no greater than 4 freeze thaw cycles
would be permitted with the material.
Assay robustness and sensitivity
The robustness of the assay was examined using blood
from 5 individuals at different time points: "fresh"
(within 1 hour of blood draw), 24 hours, 48 hours and 72
hours post blood draw. This was performed both with and
without the addition of the CCR2 antagonist. As shown in
Figure 4, there was little change in the percentage of
CD14+ cells staining positive for AF488-MCP-1 (80.8 ±
1.2%) or in the relative level of fluorescence (91612.3 ±
17543.1 MESF) observed over the 72 hour period. The
variability across the time points was 15.8%. This variabil-
ity is within that observed between individuals (16.3%–
18.2%). A similar result was observed for the percentage
of CD4+CD45RO+ cells staining positive for AF488-MCP-
1 (17.6 ± 0.9%) (Figure 4).
It was determined that due to extremely low fluorescence
values using MESF as an analytical measure on memory T
cells (CD4+CD45RO+) cells was not reproducible (MESF
Titration of assay reagentsFigure 2
Titration of assay reagents. A) AF488-MCP-1 was serially
diluted in whole blood and allowed to react at room temper-
ature. CD14+ monocytes were examined and the Mean
Equivalence of soluble fluorescence (MESF) was reported.
Maximum saturation was determined to be 60–75 nM. B)
Titration of CCR2 antagonist against optimum concentration
(60 nM) of AF488 MCP-1
-5.0 -2.5 0.0 2.5 5.0
0
10
20
30
40
50
60
70
80
90
100
% inhibtion of MCP-1a488 binding
CCR2 Antagonist (Log μg/ml)
0 50 100 150 200
0
25000
50000
75000
100000
AF488 MCP-1 (nM)
MESF
A
B
Stability of AF488-MCP-1: The ability of AF488-MCP-1 to bind and be internalized was examined over a 26 week period starting from 6 weeks post material productionFigure 3
Stability of AF488-MCP-1: The ability of AF488-MCP-1 to
bind and be internalized was examined over a 26 week
period starting from 6 weeks post material production. Data
represents the mean of 4 different individuals per time point.
No significance was observed between baseline and week 4
(p = 0.15) or week 4 and week 26 (p = 0.34, paired 2 sided
analysis).
AF488 MCP-1 (MESF)
AF488 MCP-1 reagent stability
0
5000
10000
15000
20000
25000
30000
35000
Baseline Week 4 Week 10 Week 13 Week 19 Week 23 Week 26
Table 1: Freeze thaw stability of AF488-MCP1
MESF Percent positive
Negative Control 2162.97 0.45
1 Freeze/Thaw 16844.06 98.59
2 Freeze/Thaw 16457.7 98.37
3 Freeze/Thaw 16249.23 98.63
4 Freeze/Thaw 17208.48 98.95
5 Freeze/Thaw 14850.99 97.8
Journal of Translational Medicine 2008, 6:76 />Page 6 of 12
(page number not for citation purposes)
Robustness of assay over 3 daysFigure 4
Robustness of assay over 3 days. The AF488-MCP-1 internalization assay was tested in whole blood over a 3 day period.
CD14+ monocytes and CD4+ memory T cells were examined and the Mean Equivalence of Soluble Fluorescence (MESF) of
the CD14+ cells (A) or percentage of CD14+ cells (B) or CD4+ (C) staining positive cells were examined. The percent CV of
the parameters over the three day period (n = 5) are 15.5,8.8 and 18.6 respectively. Day 1 represents the initial baseline com-
parative value.
CD14+MCP-1al+ MESF
0.0
20000.0
40000.0
60000.0
80000.0
100000.0
120000.0
Day 1Day 2Day 3
CD14+MCP-1al+ cells
0.0
10.0
20.0
30.0
40.0
50.0
60.0
70.0
80.0
90.0
100.0
Day 1 Day 2 Day 3
%CV 15.5
%CV 8.8
Percent CD14+AF488 MCP-1+
MESF
A
B
0.0
5.0
10.0
15.0
20.0
25.0
30.0
35.0
40.0
45.0
Day 1 Day 2 Day 3
Day 1 Day 2 Day 3
C
Percent CD4+AF488 MCP-1+
%CV 18.6
Journal of Translational Medicine 2008, 6:76 />Page 7 of 12
(page number not for citation purposes)
range on CD4+CD45RO+ cells was 0 to 617 MESF with an
average of 320 as compared to CD14+ MESF range of
53054 to 75851 averaging 61853 MESF). For this reason
MESF values for the memory T cell population are not
reported.
Results from the experiments to investigate potential
effects of shipping overnight or inhibition of AF488-MCP-
1 internalization after 24 hours incubation with antago-
nist demonstrated that there was not a significant differ-
ence between the IC
50
of inhibitor at 1 hour and 24 hours
(Figure 5) (0.9 ± 0.3 μg/ml vs. 1.6 ± 0.6 μg/ml pvalue =
0.15).
Assay sensitivity, the ability to reliably demonstrate inhi-
bition of internalization at low concentrations of inhibi-
tor, was determined by serially diluting CCR2 into whole
blood and determining the concentration at which the
assay %CV of inhibition became greater than 20% and
using the dilution below that point as the sensitivity. As
shown in Table 2, at the lowest concentration of CCR2
inhibitor examined the % CV was 13.3% and therefore
since the %CV was never greater than 20%, the sensitivity
of the assay was determined to be the lowest titration
point (0.005 μg/ml) of CCR2 antagonist.
Assay precision
The assay was performed using whole blood from 10
healthy volunteers which were drawn 3 times over a 2
week period. As shown in Table 3, CD14+ monocyte
MESF values for AF488-MCP-1 ranged from 51476–
115497 and were observed across all time points of the 10
individuals. Overall, 8 out of 10 individuals had %CVs of
less than 20% with an average % CV of 15.5% across all
10 individuals. The percentage of CD4+CD45RO+ cells
internalizing AF488-MCP-1 ranged from 11.7%–44.6%.
Similar to the CD14+ monocytes, 8 out of the 10 individ-
uals had %CVs of less than 20% with an overall average of
16.3% (Table 4). The CVs generated for replicate analysis
(triplicate runs of all 10 individuals at all time points) are
shown in Table 5. There was consistently a variability of
less than 15% in all the assay parameters tested. In partic-
ular, the triplicate MESF data derived from the CD14+
cells had variability of less than 10% across all individuals
and all days (Table 5).
In-study results
This assay was used as a pharmacodynamic marker for
biological activity of a CCR2 antagonist in a clinical trial
consisting of 108 healthy individuals. The data generated
from this study was used retrospectively to further validate
the internalization assay. Fifty four individuals were given
a single dose of a CCR2 antagonist and 54 individuals
were given a vehicle control placebo. Blood was drawn at
various time points throughout 113 days and the ability
of monocytes and memory T cells to internalize AF488-
MCP-1 was measured and examined for reproducibility
over time, across individuals (population heterogeneity)
as well as the ability of the assay to demonstrate a phar-
macodynamic effect. As shown in figures 6a and 6b (bar
graphs), shortly after dosing on day 1 there was a com-
plete and rapid inhibition of internalization in both
CD14+ monocytes and CD4+CD45RO+ memory T cells
from the group receiving the CCR2 antagonist. In con-
trast, there was no inhibition of internalization in the pla-
cebo (Figures 6a and 6b placebo line). An effect was
observed at day 3 (up to 40% decrease in internalization
of AF488-MCP-1) however, only 9 of the 54 individuals
were sampled at the day 3 time point leading to a poten-
tial sampling bias in the data. At all other time points, all
108 (54 placebo and 54 dosed) individuals where
assessed using the internalization assay. The assay varia-
bility in the placebo data is 15.5% over the 113 days of
sampling (day-3 time point included for a total of 528
samples) (Table 6). This data suggests that over a 113 day
period there is relatively little change in the overall expres-
sion of the CCR2 receptor as well as the cell's capacity to
internalize the ligand.
The inter-person reproducibility of the assay was demon-
strated by testing the pre-dose samples of all 108 individ-
uals. The average fluorescence MESF value for monocytes
was 101586.5 ± 38366.8 across all pre-dose samples
(Table 6). The observed variation in the fluorescence val-
Robustness of assay: comparison of AF488-MCP-1 internali-zation inhibition at 1 hour and 24 hoursFigure 5
Robustness of assay: comparison of AF488-MCP-1 internali-
zation inhibition at 1 hour and 24 hours. The AF488-MCP-1
internalization assay was tested in whole blood after one
hour incubation with a serial dilution of CCR2 inhibitor and
compared to incubation with the inhibitor for 24 hours. The
IC50 for 1 hour was determined to be 0.9 ± 0.3 μg/ml com-
pared to 1.6 ± 0.6 μg/ml (n = 4). Inhibition of percent posi-
tive cells shown with similar results observed for MESF.
% Positive base
% Positive 24hr
N=4
-3 -2 -1 0 1 2 3
0
10
20
30
40
50
60
70
80
90
100
CCR2 inhibitor (Log
μ
μμ
μ
g/ml)
Percent inhibition
Journal of Translational Medicine 2008, 6:76 />Page 8 of 12
(page number not for citation purposes)
ues for the CD14+ cells across the population was 37.8%.
The percentage of CD4+CD45RO+ T cell staining positive
for AF488 MCP-1 internalization was 22.7 ± 0.7 giving a
3.2%CV for all of the individual pre-dose values.
Discussion
The ability to demonstrate biological activity of drug
(pharmacodynamic biomarkers) has become a valuable
measurement in the development cycle of a pharmaceuti-
cal. For example, changes in lipid profiles, CRP and blood
pressure have been used as pharmacodynamic (PD) meas-
ures for the assessment of drug treatment effect [17-21].
Pharmacodynamic assays such as the one described here
are important for the overall clinical development of a
pharmaceutical entity for which target effects are not eas-
ily identified in vivo. The ability to confidently and reliably
demonstrate the action of drug on target enables the
researcher early on to evaluate drug effects. Unfortunately,
many of the mechanistic pharmacological effects have
been difficult to observe in vivo and/or have been limited
by the availability of reliable techniques for measuring the
effect.
Flow cytometry has been a proven useful tool in the diag-
nosis of hematological disorders [22] as well as the diag-
nosis and monitoring of progression for diseases such as
AIDS [23] and hematological cancers [24]. Recent
advances in instrument platforms, reagent quality and the
increase in clinical usage have driven flow cytometry to be
highly reproducible and consistent. For these reasons,
flow cytometry has become an excellent platform for
pharmacodynamic assays.
Cytometry can measure both phenotypic and functional
parameters from whole blood. To date, the use of flow
cytometry in clinical trials has for the most part been lim-
ited to measuring changes in phenotypic profiles and cell
populations in response to therapeutics. However, several
examples of flow cytometry assays being used to measure
PD effects have recently been published. Ebo et al have
recently published the validation of a flow cytometry
assay showing the antagonistic effect of a compound on
the ability of basophils to undergo a shape change [25].
Similarly, Kelly et al has demonstrated the effect of an
anti-CD40 antibody on the levels of circulating B cells in
cynomolgus monkey [26]. While the examples noted have
demonstrated the power and versatility of flow cytometry
in clinical and pre-clinical trials, to date, there has been no
guidance or white papers released addressing validation
of pharmacodynamic assays, particularly assays based on
flow cytometry. This is in contrast to other assays used in
drug development such as ligand binding and immuno-
genicity assays [10-15]. Additionally, there has been a
recent white paper published in which recommendations
Table 2: Percent Inhibition of monocyte internalization of AL488-MCP-1 with a CCR2 inhibitor
CCR2 inhibitior (μg/ml) Vol A Vol B Vol C Vol D Average Stdev %CV
555.560 96.50 95.48 95.49 95.16 95.66 0.58 0.61
185.187 95.51 95.44 94.25 94.53 94.93 0.64 0.67
61.729 92.82 92.76 92.64 93.63 92.96 0.45 0.49
20.576 90.89 91.16 90.10 90.00 90.54 0.58 0.64
6.859 84.82 86.28 85.47 86.23 85.70 0.69 0.81
2.286 78.30 76.71 81.54 79.55 79.03 2.04 2.58
0.762 71.21 75.22 71.71 69.85 72.00 2.29 3.18
0.254 59.49 67.06 62.80 59.43 62.20 3.61 5.80
0.085 43.23 57.00 49.56 47.31 49.28 5.78 11.73
0.028 31.18 38.57 36.08 35.06 35.22 3.07 8.72
0.009 23.76 24.64 21.35 24.84 23.65 1.60 6.77
0.005 13.81 15.68 11.31 13.44 13.56 1.79 13.22
Based on MESF values
Journal of Translational Medicine 2008, 6:76 />Page 9 of 12
(page number not for citation purposes)
were made on the use and validation of conventional
biomarker assays in clinical trials [27,28]. To date, no
parameters for validating specifically flow cytometry PD
assay have been proposed.
These guidance and white papers can serve as a template
or guide for the validation of a flow cytometry PD assay.
Flow cytometry PD assays should also demonstrate simi-
lar parameters: reagent stability (to ensure reagents
remain consistent from day to day), assay robustness
(how the assay is affected by variables such as overnight
shipping), sensitivity (how the assay responds to low con-
centrations of compound i.e. the drug effect threshold),
repeatability (the variability of results when the assay is
performed multiple times on the same sample (inter-
assay) and in replicate (intra-assay)) and reproducibility
precision (the variability of results from blood drawn
from the same individual multiple times and also from
different individuals). Accuracy, as classically defined for
ELISA and mass spectrometry based technologies, is the
ability of an assay to measure analyte against a standard or
quantitative control (QC) and is the most difficult of the
parameters to define for flow cytometry based assay
because the controls that would allow one to address this
parameter directly (such as fixed cells of known antigen
expression and density) do not exist or are untried for this
purpose. However, several bead based methods by which
instrument precision can be measured do exist. These
bead based procedures not only standardize instrument
settings accounting for daily fluctuations but also include
fluorescence intensity standards to which to relate the
results allowing greater reproducibility of data from
instruments across laboratories and over time [16]. The
lack of standard controls for each parameter examined in
flow cytometry limits the ability of the assay to be used in
a quantitative manner and at best renders it semi-quanti-
tative. For this reason, analysis in longitudinal clinical tri-
als may best be served by examining the value observed
relative post exposure to a baseline pre-drug treatment
value. It is therefore critical that the variability of the cyto-
metric assay be well understood prior to initiation of a
clinical trial. Further refinement of the longitudinal varia-
bility during phase 1 trials solidifies our confidence in the
assay and allows the scientist to better define the limits of
Table 3: Reproducibility of Monocyte MESF
volunter day 1 day 2 day 3 average Stdev %CV
A 61940 87026 91080 80015.4 16017.8 20
B 91392 122966 115497 109952 19147.8 17.4
C 51476 99899 103507 84960.7 25690.2 30.2
D 96517 90421 108916 98617.8 14227.2 14.4
E 78818 66928 68908 71551.6 8026.7 11.2
F 97349 89816 88213 91792.6 6327.6 6.9
G 103644 114153 114181 110659.2 8417.7 7.6
H 88285 96544 92983 92604 5061.8 5.5
I 103690 101193 74133 93005.3 16437.9 17.7
J 105782 82502 60611 82964.7 19887.1 24
* Day 1 refers to the initial baseline value obtained from freshly
obtained whole blood.
All samples were processed within one hour of blood dra
Table 4: Reproducibility of Percentage of Memory T cells
Positive
volunter day 1* day 2 day 3 average Stdev %CV
A 30.6 36.0 33.4 33.3 2.7 8.1
B 18.6 24.4 23.7 22.2 3.2 14.2
C 11.7 44.6 33.8 30.0 16.8 55.8
D 29.8 23.6 29.1 27.5 3.4 12.3
E 36.4 30.4 38.2 35.0 4.1 11.7
F 13.5 15.4 18.1 15.7 2.3 14.8
G 27.3 29.6 28.3 28.4 1.2 4.1
H 40.9 41.9 39.8 40.9 1.1 2.6
I 13.6 14.3 20.4 16.1 3.7 23.2
J 25.5 35.0 34.0 31.5 5.2 16.6
* Day 1 refers to the initial baseline value obtained from freshly
obtained whole blood.
All samples were processed within one hour of blood draw.
Table 5: Average % CV of triplicate test of 10 individuals over 3
days
CD14+MCP-1al+ CD4+MCP-1al+
% MESF % N/A
Day 1 5.6 8.9 11.9 N/A
Day 2 2.2 8 13.9 N/A
Day 3 3 7.4 7.7 N/A
Journal of Translational Medicine 2008, 6:76 />Page 10 of 12
(page number not for citation purposes)
what observed effects can be considered as a direct result
of the therapy and not due to variations in the assay.
The purpose of validating an assay is to be able to demon-
strate that the assay not only scientifically addresses the
questions (Fit-for-Purpose [27]) but also does so in a
reproducible and reliable manner. To this end, a whole
blood alexa-488 labeled MCP-1 internalization assay was
validated here for use in clinical trials investigating a
CCR2 antagonist by examining a standard reagent con-
centration to use, the stability of the reagent, the robust-
ness of the assay, the reproducibility across individuals
over time, and the intra-assay repeatability through repli-
cate analysis. Since this is a whole blood assay other
parameters such as matrix effects were not examined
However, parameters such as these are important to con-
sider when moving from differing disease states and may
require cross validations in new disease state whole blood
matrix [12,27].
The AF488-MCP-1 internalization assay described here
was shown to be sensitive, robust, repeatable and repro-
ducible. The assay is able to demonstrate a pharmacody-
namic effect after in vivo dosing and additionally
established that expression of CCR2 on both monocytes
and memory T cells is relatively stable over 113 days using
a controlled flow cytometry platform. The AF488-MCP-1
internalization assay will be an important tool which
In study validationFigure 6
In study validation. AF488-MCP-1 internalization assay was performed on whole blood of individuals either dosed with a CCR2
antagonist or placebo. Various time points from pre-dose through 113 days were examined for the ability of the assay to distin-
guish antagonist response. Shown here are the CD14+ monocytes MESF (A) and percentage of CD4+CD45RO+Memory T
cells (B) staining for AF488 MCP-1 internalization. Reported values are the mean ± SE of the 54 individuals per group with the
exception of day 3 were the n = 9. Bar graphs demonstrate the overall drug effect on the assay post dose on day one. The lon-
gitudinal pharmacodynamic effect is beyond the scope of this paper and therefore subsequent values are not shown.
A
B
CD14+ AL488 MCP-1 (MESF)
Percent CD4+ 45RO+ AL488 MCP-1+
0.0
20000.0
40000.0
60000.0
80000.0
100000.0
120000.0
140000.0
160000.0
Day1 pre Day1
post
Day 3 Day 8 Day 15 Day 29 Day 43 Day 57 Day 71 Day 85 Day 113
Dosed Placebo
0.0
5.0
10.0
15.0
20.0
25.0
30.0
35.0
40.0
Day1 pre Day1 post Day 3 Day 8 Day 15 Day 29 Day 43 Day 57 Day 71 Day 85 Day 113
Dosed Placebo
Journal of Translational Medicine 2008, 6:76 />Page 11 of 12
(page number not for citation purposes)
allows the clinical researcher to determine CCR2 satura-
tion and a pharmacodynamic-pharmacokinetic relation-
ship in clinical trials investigating CCR2 ligand
antagonists.
Competing interests
Drs. Wyant and Green are employees of Millennium Phar-
maceuticals at which the research was completed. Mr.
Lackey formally worked at Esoterix and is now at Nodal-
ity. The authors list no competing interest.
Authors' contributions
TW designed and carried out experiments and drafted the
manuscript. AL carried out the assay in the clinical trials.
MG aided in the design of the experiments and review of
the manuscript. All authors read and approved the final
manuscript.
Acknowledgements
The authors would like to thank Brain Harty for is invaluable work on this
project.
References
1. Szekanecz Z, Koch AE: Chemokines and angiogenesis. Curr Opin
Rheumatol 2001, 13(3):202-208.
2. Needham M, Sturgess N, Cerillo G, Green I, Warburton H, Wilson
R, Martin L, Barratt D, Anderson M, Reilly C, Hollis M: Monocyte
chemoattractant protein-1: receptor interactions and cal-
cium signaling mechanisms. J Leukoc Biol 1996, 60(6):793-803.
3. Dzenko KA, Andjelkovic AV, Kuziel WA, Pachter JS: The chemok-
ine receptor CCR2 mediates the binding and internalization
of monocyte chemoattractant protein-1 along brain micro-
vessels. J Neurosci 2001, 21(23):9214-23.
4. Quinones MP, Estrada CA, Kalkonde Y, Ahuja SK, Kuziel WA, Mack
M, Ahuja SS: The complex role of the chemokine receptor
CCR2 in collagen-induced arthritis: implications for thera-
peutic targeting of CCR2 in rheumatoid arthritis. J Mol Med
2005, 83(9):672-81.
5. Dawson J, Miltz W, Mir AK, Wiessner C: Targeting monocyte
chemoattractant protein-1 signalling in disease. Expert Opin
Ther Targets 2003, 7(1):35-48.
6. Barlic J, Murphy PM: Chemokine regulation of atherosclerosis.
J Leukoc Biol 2007, 82(2):226-36.
7. Schober A, Zernecke A: Chemokines in vascular remodeling.
Thromb Haemost 2007, 97(5):730-7.
8. Szczucinski A, Losy J: Chemokines and chemokine receptors in
multiple sclerosis. Potential targets for new therapies. Acta
Neurol Scand 2007, 115(3):137-46.
9. Xia M, Hou C, Demong DE, Pollack SR, Pan M, Brackley JA, Jain N,
Gerchak C, Singer M, Malaviya R, Matheis M, Olini G, Cavender D,
Wachter M: Synthesis, Structure-Activity Relationship and in
Vivo Antiinflammatory Efficacy of Substituted Dipiperidines
as CCR2 Antagonists. J Med Chem 2007, 50(23):5561-5563.
10. DeSilva B, Smith W, Weiner R, Kelley M, Smolec J, Lee B, Khan M,
Tacey R, Hill H, Celniker A: Recommendations for the bioana-
lytical method validation of ligand-binding assays to support
pharmacokinetic assessments of macromolecules.
Pharm Res
2003, 20(11):1885-900.
11. Findlay JW, Smith WC, Lee JW, Nordblom GD, Das I, DeSilva BS,
Khan MN, Bowsher RR: Validation of immunoassays for bioa-
nalysis: a pharmaceutical industry perspective. J Pharm Biomed
Anal 2000, 21(6):1249-73.
12. Smolec J, DeSilva B, Smith W, Weiner R, Kelly M, Lee B, Khan M,
Tacey R, Hill H, Celniker A, Shah V, Bowsher R, Mire-Sluis A, Findlay
JW, Saltarelli M, Quarmby V, Lansky D, Dillard R, Ullmann M, Keller
S, Karnes HT: Bioanalytical method validation for macromol-
ecules in support of pharmacokinetic studies. Pharm Res 2005,
22(9):1425-31.
13. Viswanathan CT, Bansal S, Booth B, DeStefano AJ, Rose MJ, Sailstad J,
Shah VP, Skelly JP, Swann PG, Weiner R: Quantitative bioanalyti-
cal methods validation and implementation: best practices
for chromatographic and ligand binding assays. Pharm Res
2007, 24(10):1962-73.
14. Bansal S, DeStefano A: Key elements of bioanalytical method
validation for small molecules. AAPS J 2007, 9(1):E109-14.
15. Gupta S, Indelicato SR, Jethwa V, Kawabata T, Kelley M, Mire-Sluis
AR, Richards SM, Rup B, Shores E, Swanson SJ, Wakshull E: Recom-
mendations for the design, optimization, and qualification of
cell-based assays used for the detection of neutralizing anti-
body responses elicited to biological therapeutics. J Immunol
Methods 2007, 321(1–2):1-18.
16. Purvis N, Stelzer G: Multi-platform, multi-site instrumentation
and reagent standardization. Cytometry 1998, 33(2):156-65.
17. Davidson MH: Introduction: utilization of surrogate markers
of atherosclerosis for the clinical development of pharma-
ceutical agents. Am J Cardiol 2001, 87(4A):1A-7A.
18. Revkin JH, Shear CL, Pouleur HG, Ryder SW, Orloff DG: Biomark-
ers in the prevention and treatment of atherosclerosis: need,
validation, and future. Pharmacol Rev 2007, 59(1):40-53.
19. Devaraj S, Rogers J, Jialal I: Statins and biomarkers of inflamma-
tion. Curr Atheroscler Rep 2007, 9(1):33-41.
20. Abramson JL, Vaccarino V: Pulse pressure and inflammatory
process in atherosclerosis. Adv Cardiol 2007, 44:223-33.
21. Tsimikas S: Oxidized low-density lipoprotein biomarkers in
atherosclerosis. Curr Atheroscler Rep 2006, 8(1):55-61.
22. Drouet M, Lees O: Clinical applications of flow cytometry in
hematology and immunology. Biol Cell 1993, 78(1–2):73-8.
Table 6: In study intra and inter-person variability
All Pre-dose samples
average Stdev %CV n Sterror
Monocyte MESF 101586.6 38366.8 37.8 108 3691.8
Percentage of Memory T cell 22.7 0.7 3.2 108 0.3
All Placebo over 113 days
average Stdev %CV n Sterror
Monocyte MESF 111589.34 17265.61 15.47 528 4856.303
Publish with Bio Med Central and every
scientist can read your work free of charge
"BioMed Central will be the most significant development for
disseminating the results of biomedical researc h in our lifetime."
Sir Paul Nurse, Cancer Research UK
Your research papers will be:
available free of charge to the entire biomedical community
peer reviewed and published immediately upon acceptance
cited in PubMed and archived on PubMed Central
yours — you keep the copyright
Submit your manuscript here:
/>BioMedcentral
Journal of Translational Medicine 2008, 6:76 />Page 12 of 12
(page number not for citation purposes)
23. Pattanapanyasat K, Thakar MR: CD4+ T cell count as a tool to
monitor HIV progression & anti-retroviral therapy. Indian J
Med Res 2005, 121(4):539-49.
24. Di Noto R, Mirabelli P, Del Vecchio L: Flow cytometry analysis of
acute promyelocytic leukemia: the power of 'surface hema-
tology'. Leukemia 2007, 21(1):4-8.
25. Ebo DG, Lechkar B, Schuerwegh AJ, Bridts CH, De Clerck LS, Stevens
WJ: Validation of a two-color flow cytometric assay detecting
in vitro basophil activation for the diagnosis of IgE-mediated
natural rubber latex allergy. Allergy 2002, 57(8):706-12.
26. Kelley SK, Gelzleichter T, Xie D, Lee WP, Darbonne WC, Qureshi F,
Kissler K, Oflazoglu E, Grewal IS: Preclinical pharmacokinetics,
pharmacodynamics, and activity of a humanized anti-CD40
antibody (SGN-40) in rodents and non-human primates. Br J
Pharmacol 2006, 148(8):1116-23.
27. Lee JW, Devanarayan V, Barrett YC, Weiner R, Allinson J, Fountain S,
Keller S, Weinryb I, Green M, Duan L, Rogers JA, Millham R, O'Brien
PJ, Sailstad J, Khan M, Ray C, Wagner JA: Fit-for-purpose method
development and validation for successful biomarker meas-
urement. Pharm Res 2006, 23(2):312-28.
28. Colburn WA, Lee JW: Biomarkers, validation and pharmacok-
inetic-pharmacodynamic modelling. Clin Pharmacokinet 2003,
42(12):997-1022.