WETLAND AND WATER RESOURCE MODELING AND ASSESSMENT: A Watershed Perspective - Chapter 16 potx
Bạn đang xem bản rút gọn của tài liệu. Xem và tải ngay bản đầy đủ của tài liệu tại đây (314.96 KB, 13 trang )
187
16
A Conceptual Framework
forIntegratingaSimulation
ModelofPlantBiomass
for
Vallisneria spiralis L.
with Remote Sensing
and a Geographical
Information System
Guofeng Wu, Jan de Leeuw, Elly P. H. Best,
Jeb Barzen, Valentijn Venus, James Burnham,
Yaolin Liu, and Weitao Ji
16.1 INTRODUCTION
Submerged aquatic vegetation (SAV) forms a signicant component of shallow lake
and river ecosystems. This cycles nutrients, stabilizes ow, enhances water clar-
ity, inuences primary production, and protects the shores from erosion (Carr et
al. 1997, Van Nes et al. 2003). Moreover, it provides an important food source for
migratory birds. Bewick’s swans (Cygnus columbianus bewickii), for instance, feed
on the tubers of Potamogeton pectinatus in autumn in the Netherlands (Jonzen et al.
2002), while in Canada Trumpeter swans (Cygnus buccinator) forage on the tubers
of Potamogeton pectinatus during spring (LaMontagne et al. 2003). Migratory
North American waterfowl species in the tribe Athyini depend heavily upon tubers
produced by a variety of SAV species (Korschgen 1989), and Siberian cranes (Grus
leucogeranus) rely on the tubers of Vallisneria spiralis L. throughout the winter
at Poyang Lake, China (Wu and Ji 2002). Careful management of lake and river
systems with SAV are therefore indispensable not only from the perspective of eco-
system health, but also for the conservation of migratory bird species. Protected
lake areas and backwater areas of rivers are not isolated water bodies, but are parts
of larger watersheds. Natural or anthropogenic changes may inuence these water
bodies and, in turn, impact the growing conditions of SAV along with the avail-
ability of food for waterfowl. These changes can often be subtle. Van Vierssen et
al. (1994), for example, described that SAV declined during the 1960s and 1970s
in Lake Veluwe, the Netherlands, due to eutrophication caused by wastewater, and
© 2008 by Taylor & Francis Group, LLC
188 Wetland and Water Resource Modeling and Assessment
recovered following signicant water quality improvement since the late 1980s. Har-
well and Havens (2003) mentioned that elevated water levels and low water trans-
parency during the late 1970s caused a decline in SAV density in Lake Okeechobee
in southern Florida. Similar changes in SAV abundance have also occurred in the
upper Mississippi River over fty years (Jahn and Anderson 1986).
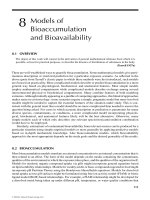
Poyang Lake (Figure 16.1), China, hosts an extremely high density of wintering
birds, many of whom feed on Vallisneria spiralis L. tubers (Wu and Ji 2002). Large
numbers of swans and virtually the entire world’s population of Siberian cranes rely
exclusively on this food source (Meine and Archibald 1996). Vallisneria tubers are
also an important part of the diet of the endangered Swan Goose (Wu and Ji 2002).
The production and availability of Vallisneria tubers depend on the local prevail-
ing environmental conditions in both summer and winter. The environmental con-
ditions, in turn, are not only inuenced by the vegetation, birds, and activities of
the local human community inside the protected areas, but also by the surrounding
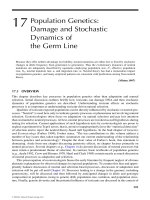
hydrological conditions. The Poyang Lake ecosystem is full of feedback systems
operating among various biotic and abiotic factors (Figure 16.2). The hydrological
conditions might also be changed due to ongoing and proposed engineering projects
in the catchments of both Poyang Lake and the Yangtze River, as well as dredging
as reported by Wu et al. (2007b).
Poyang Lake National Nature Reserve (PLNNR), designated with the highest
conservation category in China, is the oldest protected area in Poyang Lake. It was
established in 1988 to conserve the Siberian cranes, and places 5% of the total area
of Poyang Lake under protected status. Proper management of this nature reserve
requires the ability to forecast the impact of engineering projects on the productivity
of Vallisneria. More importantly, the use of PLNNR by tuber-feeding birds varies
greatly among, as well as within, years (Kanai et al. 2002). Given the spatial scale
of the entire Poyang Lake, models would be the only possible tool that could be
used for predicting future impacts of multiple development projects over such a large
FIGURE 16.1 Landsat TM images of Poyang Lake. In the dry season the water level is rela-
tively low and numerous shallow lakes are disconnected from the main water body of Poyang
Lake (left image captured on 28 October 2004), while in summer all these lakes compose one
large water body (right image captured on 15 July 1989). (See color insert after p. 162.)
© 2008 by Taylor & Francis Group, LLC
A Conceptual Framework 189
and heterogeneous landscape. In contrast, models required to develop this manage-
ment tool are currently lacking in this region. Process-based shallow lake ecosystem
models that incorporate hydrological variables and simulate SAV biomass would be
ideally suited for such a purpose.
PLNNR is composed of nine lakes encompassing approximately 224 km
2
(Wu
and Ji 2002), while the entire Poyang Lake basin encompasses 4,500 km
2
. It would
be costly and difcult to measure the onsite environmental conditions in every lake
within the reserve, much less among the various regions of the entire lake that cranes
use (Kanai et al. 2002). Remote sensing (RS) techniques and geographic information
systems (GIS) might provide the means to quantify some of the variables required to
drive the above-mentioned SAV biomass simulation models. In addition, a GIS could
be used as a tool for the input, storage, retrieval, manipulation, analysis, and output
of these spatial data, and also serve as an intermediary for implementing the SAV
biomass simulation models.
The objective of this paper is to propose a conceptual framework for the integra-
tion of a SAV biomass simulation model for Vallisneria with RS techniques and a
GIS. After implementation, the system could be used to study the response of the
growth of Vallisneria to changes in environmental conditions, and predict the den-
sity and mass of Vallisneria tubers in space and time. The potential roles of GIS and
RS in this endeavor will be emphasized. The questions to be addressed and potential
user communities will be outlined and discussed.
Observations
Field
POYANG LAKE ECOSYSTEM
Biophysical cycles
Measurements
Field
Measurements
Field &
RS & GIS
Data
Social environment
Implementation
authorities
Use and
management by
human community
Policy & decision
Submerged
aquatic vegetation
(incl. tubers)
Physical
environment of
Poyang Lake
Birds
Fish &
invertebrates
Surrounding physical
environment
FIGURE 16.2 Hypothesized and important cause-and-effect interactions among the envi-
ronment, submerged aquatic vegetation, and tuber-feeding birds in the Poyang Lake ecosys-
tem, China. Solid lines are material ow; interrupted lines are activities and information
ows; RS = remote sensing; GIS = geographic information system.
© 2008 by Taylor & Francis Group, LLC
190 Wetland and Water Resource Modeling and Assessment
16.2 ECOLOGY AND PRODUCTION OF VALLI SNERIA
The production ecology of Vallisneria in Poyang Lake has been studied by Wu and
Ji (2002). Vallisneria winters as tubers and seeds. It sprouts in April, owers in June,
reaches its maximum aboveground biomass in mid-September, and lls its tubers
from mid-July until shoots senesce in late October. Field measurements in 1999 indi-
cated that aboveground plant biomass decreased from the shore to the center of the
lakes. The average shoot density close to the shore was about 50 to 70 stems/m
2
, and
individual fresh weight of each green shoot at maximum extent averaged about 12
g/stem. In areas with high tuber abundance, tuber density reached 10 to 70 tubers/m
2
with a biomass range of 6 to 45 g fresh weight/m
2
. Wu and Ji (2002) concluded that
water level, light intensity, temperature, and chemical properties of the water inu-
enced growth and production of Vallisneria most. The importance of water level was
demonstrated by the observation that the Vallisneria population collapsed during the
ood of 1998, when water levels were more than four meters higher than in normal
years (Wu and Ji 2002).
16.3 SAVSIMULATIONMODELS
Relationships between environmental variables and the biomass of SAV have been
included in a variety of plant growth simulation models (Collins and Wlosinski
1989, Scheffer et al. 1993, Calado and Duarte 2000, Best and Boyd 2001b, Van Nes
et al. 2003, Herb and Stefan 2003, Giusti and Marsili-Libelli 2005). Some of these
models are generic, such as Charisma (Van Nes et al. 2003), while others focus on
one species, for example MEGAPLANT for Potamogeton pectinatus L. (Hootsmans
1994, Scheffer et al. 1993) and VALLA for Vallisneria americana Michx (Best and
Boyd 2001a).
All these models include descriptions of the seasonal growth cycle. The modeled
plants may survive the winter as shoots or as wintering structures (tubers or seeds).
Growth is initiated at a preset day, and from that moment onward, each wintering
structure transforms a xed daily percent of its remaining biomass into the sprout.
At a later preset day, aboveground biomass is transformed into belowground struc-
tures that survive the winter.
Environmental factors and vegetation characteristics inuence growth. The
macrophyte characteristics were modeled with different degrees of complexity. For
example, Best and Boyd (2001a) considered different vertical layers within the shoot
biomass, plant organs, and >1 tuber cohort sprouting per year, while Hootsmans
(1994) took the formation of a second shoot into account.
Of particular relevance for our current case is VALLA (Best and Boyd 2001a), a
model that has been developed for Vallisneria americana, a species closely related
to Vallisneria spiralis, and can be run at climates varying from temperate to tropi-
cal. This model has been used to evaluate the feasibility for Vallisneria americana
to recolonize rehabilitated navigation pools of the Illinois River (Best et al. 2004).
It has also been used for ecological risk assessment of planned changes in commer-
cial navigation on the upper Mississippi River (UMR) (Bartell et al. 2000). After
© 2008 by Taylor & Francis Group, LLC
A Conceptual Framework 191
recalibration for fast-owing river conditions (Best et al. 2005), the model is cur-
rently being used to evaluate the tentative effects of changes in water level manage-
ment in navigation pools of the UMR, USA, on the tuber availability for wintering
water fowl (including Tundra swans). The latter UMR case is similar to the current
Poyang Lake case, in which a major goal is to evaluate the tuber availability for the
Siberian cranes and other tuber-grazing waterfowl.
Field data published by Wu and Ji (2002) suggest that the species of Vallisneria
occurring in Poyang Lake is unclear. Wu and Ji (2002) also described the devel-
opment cycle and showed the prevalent Poyang Lake Vallisneria species produces
relatively small shoots and large tubers compared to the default Vallisneria ameri-
cana species used for the latest recalibration of VALLA for the UMR. A clearer
description of the Poyang Lake Vallisneria has been provided now, and new seeds
are currently available, so the identication of the Poyang Lake Vallisneria species
should be possible. Once VALLA is recalibrated for the Poyang Lake Vallisneria
species, various scenarios of water level and transparency changes expected from
development projects could be modeled and the impacts on the tuber production in
Poyang Lake might be predicted. Other research on use of tubers by birds could then
be incorporated into this model to predict changes to the carrying capacity of winter-
ing waterfowl that feed on tubers.
16.4 CONCEPTUAL FRAMEWORK INTEGRATING
THE SAV SIMULATION MODEL WITH RS AND GIS
Typically models have been used to simulate the impact of changing environmental
conditions on SAV, and it would be tempting to combine these growth simulation
models with GIS to make predictions across spatially heterogeneous environments.
Huang and Jiang (2002) distinguished three approaches to integrating environmen-
tal models with GIS: loose, tight, and full coupling. Loose coupling relies on the
transfer of data les between stand-alone GIS and environmental models. For tight
coupling, the environmental models are usually embedded within a GIS, and the
interactions between them depend on the parameter transfers. Full coupling is a full
integration of environmental models within GIS, generally using an advanced pro-
gramming language or GIS macro language.
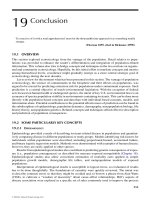
We propose a conceptual framework (Figure 16.3) of loosely integrating VALLA
with RS and a GIS for simulating the plant and tuber biomass of Vallisneria. This
framework consists of three main components: GIS, RS, and the SAV simulation
model. RS and GIS will be used to estimate spatial distributions of important envi-
ronmental variables that vary frequently and have not been recorded in the eld,
such as solar radiation reaching the water surface and water temperature. Addition-
ally, the GIS is also used to input, store, retrieve, manipulate, analyze, and output
spatial variables and other spatial data, such as solar radiation, digital elevation
model (DEM), light attenuation, and spatial distribution of tuber biomass. The SAV
simulation model imports the environmental variables from GIS, simulates the plant
and tuber production of Vallisneria, and exports the results to GIS for analysis and
visualization.
© 2008 by Taylor & Francis Group, LLC
192 Wetland and Water Resource Modeling and Assessment
16.5 ENVIRONMENTAL VARIABLES AND THEIR
MEASUREMENTS IN POYANG LAKE
SAV simulation models require input data such as light intensity reaching the canopy
of the vegetation, water temperature, and the concentrations of nutrients and CO
2
.
The spatial distribution of none of these variables has been measured in Poyang
Lake. However, a number of associated variables that could be used to derive light
intensity reaching the canopy, such as water level and Secchi disk depth (SDD), have
been measured. These in situ measurements, however, have been collected for a few
lakes only. Confronted with such problems, the geoinformation technologies could
be correlated with limited in situ sampling and be used to measure or infer environ-
mental variables for large areas without in situ sampling.
The light intensity reaching the canopy of the Vallisneria is probably the most
important variable to be measured since the availability of light is the primary fac-
tor controlling photosynthesis of SAV, a primary plant function that drives bio-
mass growth in most aquatic systems (Carr et al. 1997). Light at the canopy level
is determined by the radiation reaching the water surface, reection by the water
surface, and penetration of the light through the water column to the canopy of SAV
(Figure 16.4). Presently no reliable solar radiation estimates exist for Poyang Lake,
and the closest station with such data, Nanchang, is 65 kilometers away.
Measurements of sunshine hours (S
+0
) are available for eight stations around
Poyang Lake. Using these data we combined, with a triangulated irregular network
(TIN) and inverse distance weighting (IDW) interpolation method, interpolated
Solar radiation
Light intensity
DEM
Water level
Nutrients
Geographical information
system (GIS)
SAV simulation
model-VALLA
Remote sensing (RS)
Water temperature
Secchi disk depth
Light attenuation
Tuber production
FIGURE 16.3 A conceptual framework integrating a SAV simulation model of Vallisneria
with RS and a GIS. Solar radiation represents the global solar radiation reaching the water
surface, and light intensity represents the light intensity reaching the canopy of SAV.
© 2008 by Taylor & Francis Group, LLC
A Conceptual Framework 193
sunshine hours over the lake. Chen et al. (2006), analyzing the daily global radia-
tion data and sunshine hours from 1994 to 1998 at 86 stations in China, reported
that 92% of the daily global radiation could be explained by daily sunshine hours.
We applied this model combined with sunshine hours derived through interpolation
to estimate daily global solar radiation (R
+0
) within PLNNR. A possible alterna-
tive could be using the duration of cloud cover derived from low-resolution satellite
images to predict daily solar radiation (Kandirmaz et al. 2004). We are currently
studying the possibility of predicting solar radiation over Poyang Lake from hourly
records of cloud cover recorded by the Chinese Fengyun-2C (FY-2C) geostationary
meteorological satellite.
The radiation reaching the canopy depends on the light attenuation and depth
of the water column (d
wc
) above the canopy of SAV. The d
wc
can be derived while
using the DEM, measured water levels, and vegetation height. Light attenuation (k) is
related to SDD (Figure 16.5), a variable that has been recorded in three lakes within
the PLNNR and one lake immediately adjacent to it since 1999. Lillesand and Chip-
man (2001) mentioned the potential of using low-resolution MODIS satellite data
to estimate SDD of large lakes. Lillesand (2004) reported that 79% of variation of
weekly to biweekly SDD of eleven inland lakes in Wisconsin could be explained by
the ratio of the blue and red MODIS bands. Using the in situ SDD measurements
collected in 2004 and 2005 at PLNNR, we developed a regression model between
the natural logarithm of SDD and the blue and red bands of MODIS, and it also
explained 88% of the SDD variation (Wu et al. 2007a). The SDD predicted from
MODIS imagery (Figure 16.6) could thus be used to complement information on
water transparency for those lakes where measurements have not been taken. More-
over, it provides a synoptic overview of the variability in transparency within lakes.
Extra atmosphere
Atmosphere
Water column
Water surface
Nanchang Station
Earth surface
Nature Reserve
Other Stations around
Poyang Lake
h
c
S
ext
, R
ext
S
ext
,
R
ext
S
ext
,
R
ext
S
+0
S
+0
, R
+0
, PAR
+0
S
+0
PAR
–0
PAR
tc
d
wc
d
wb
k
l
k
r
FIGURE 16.4 Model to calculate the light intensity reaching the canopy of SAV. R
ext
: extra
atmosphere global solar radiation; S
ext
: extra atmosphere or potential sunshine hours; R
+0
:
global solar radiation reaching the earth or water surface; S
+0
: measured or estimated sun-
shine hours on the earth or water surface; PAR
+0
: PAR reaching the earth or water surface;
PAR
–0
: PAR entering water body; PAR
tc:
PAR reaching the canopy of SAV; k
r
: reection
coefcient on water surface; k: light (PAR) attenuation coefcient in water column; d
wb
: water
depth; h
c
: height of SAV; d
wc
: height of water column above canopy.
© 2008 by Taylor & Francis Group, LLC
194 Wetland and Water Resource Modeling and Assessment
We are implementing the combination of radiation estimates over the lake and
SDD with other eld-based measurements to calculate the radiation reaching the
canopy of vegetation, which could then be used as an input to a SAV simulation
model coupled to a GIS.
Another important required variable is water temperature, as it has a pronounced
inuence on photosynthesis. Photosynthesis over the whole canopy is integrated from
Secchi disk depth (meter)
Light attenuation
0.0000 0.2000 0.4000 0.6000 0.8000 1.0000
25.0000
20.0000
15.0000
10.0000
5.0000
0.0000
FIGURE 16.5 Relation between light (PAR) attenuation and Secchi disk depth (R
2
= 0.986).
FIGURE 16.6 Secchi disk depths of Poyang Lake National Nature Reserve predicted from
a MODIS image dated August 8, 2004. (See color insert after p. 162.)
© 2008 by Taylor & Francis Group, LLC
A Conceptual Framework 195
instantaneous CO
2
gross assimilation rates, and it is a function of absorbed light
energy and the photosynthesis light response of individual shoots. As only a small
portion of the total incoming solar radiation is used in photosynthesis, growth rates
of individual shoots largely depend on the maximum rate of assimilation (AMAX).
AMAX is the actual CO
2
assimilation rate at light saturation for individual shoots,
which responds dynamically to varying water temperatures at different water depths.
For the related species, Vallisneria americana, AMAX-to-temperature relations are
given in Figure 16.7.
Water temperatures show a diurnal progression, and its amplitude var-
ies with different water depths, as can also be seen from Figure 16.8. Combining
AMAX-to-temperature (Figure 16.7) and diurnal temperatures as observed over
Poyang Lake (Figure 16.8), it is evident that neither daily average water temperatures
0 1020304050
Temperature (C°)
0.000
0.004
0.008
0.012
0.016
AMAX (g CO)
2
g DW
-1
h
-1
FIGURE 16.7 CO
2
assimilation capacity at light saturation (AMAX), based on data pub-
lished by E. P. H. Best and W. A. Boyd (2001a). A simulation model for growth of the sub-
mersed aquatic macrophyte American wildcelery (Vallisneria americana Michx.). ERDC/EL
TR-01-5. Vicksburg, MS: U.S. Army Engineer Research and Development Center.
0246810121416182022
Time
22
23
24
25
26
27
28
29
Temperature (C°)
(A)
(B)
FIGURE 16.8 Average diurnal water temperature from August to September 2005 at dif-
ferent water depths in Poyang Lake.
© 2008 by Taylor & Francis Group, LLC
196 Wetland and Water Resource Modeling and Assessment
from synoptic observations nor observations from polar-orbiting satellites capture
diurnal CO
2
gross assimilation rates well. So it is necessary to obtain radiation and
temperature data with higher temporal resolution (hourly).
At present, no record of seasonal variation of water temperature within PLNNR
exists. RS offers the possibility of measuring surface water temperature. For exam-
ple, Fox et al. (2005) employed SeaWiFS and AVHRR to estimate the spatial and
temporal distributions of water temperature, while Handcock et al. (2006) studied
the accuracy and uncertainty of water temperature estimates from the thermal-infra-
red band of ASTER, MODIS, and Landsat ETM+ images.
Despite the fact that authors have successfully been able to use imagery from
polar-orbiting satellites to estimate water temperatures, too few clear-sky observa-
tions remain to satisfy our strict model requirements. This gap is due to the relatively
low temporal resolution of the images. A challenge lies in the use of geostationary
satellite data to estimate water temperature and insolation commensurate with the
temporal and radiometric requirements our objective. Fengyun-2C (FY-2C), a geo-
stationary meteorological satellite operated by the General National Satellite Meteo-
rological Center (NSMC) of China, observes a large part of Asia centered at 105
degrees east. Future work is focusing on the development of algorithms for estimat-
ing water (skin) temperature and solar irradiance from this relatively new sensor.
Theoretically, temperature and radiation can be determined 24 times per day from
FY-2C, but in practice, fewer observations are available due to cloud cover. Based
on these estimates, an attempt will be made to model underwater temperature and
light conditions using an inductive modeling approach as the optimum water depth
for the growth of Vallisneria spiralis is at 2 to 3 meters depth, and not at the surface
(Chambers and Kalff 1987).
The temporal or spatial distribution of other environmental variables, such as
total phosphorus and total nitrogen, have also been studied through RS by several
researchers (Dewidar and Khedr 2001, Wang and Ma 2001), and their implementa-
tion possibilities in Poyang Lake could be explored in the future.
16.6 QUESTIONS TO BE ADDRESSED
A SAV simulation model coupled to a GIS as described above could be used to
address important environmental questions, of which three major ones are sum-
marized here.
First, plans are underway to change the hydrology of the Poyang Lake and the
Yangtze River. Concern has been expressed that those hydrological changes could
negatively affect Vallisneria production, and therefore the feeding habitat of winter-
ing Siberian cranes or other tuber-feeding waterfowl. To hydrological engineers and
resource planners it would be useful to quantitatively evaluate the impact of future
hydrological changes on biota, especially where endangered species, are involved, as
in the case at Poyang Lake (Wu and Ji 2002). Development plans could then be rede-
signed and expensive alterations, once infrastructure has been built, can be avoided.
Second, once engineering projects have been completed, it is important to evalu-
ate the impacts of hydrological changes on the ecosystem in which the submerged
aquatic vegetation plays an important role. With the Three Gorges Dam approaching
© 2008 by Taylor & Francis Group, LLC
A Conceptual Framework 197
completion, it is not yet understood how various potential water management scenar-
ios from the dam may (or may not) affect SAV production at Poyang Lake, located
downstream of the Three Gorges Dam. Predicting impacts from the Three Gorges
Dam is difcult because there is a tremendous seasonal and year-to-year hydrologi-
cal variability. Dredging is another activity changing the hydrology of Poyang Lake
(Wu et al., 2007b). It has been suggested that it might inuence the prouduction
of Vallisneria, but the exact impacts remain to be assessed. SAV-dominated eco-
systems of Poyang Lake likewise respond to hydrological variability (International
Crane Foundation and PLNNR, unpublished data). SAV simulation models, like
VALLA, might augment our understanding of the system behavior and allow us
to assess the most important variables to monitor. A calibrated model predicting
tuber biomass production, as affected by hydrology, will also enable us to distinguish
between future changes in tuber biomass attributed to natural seasonal and year-to-
year variations versus man-made hydrological changes.
A third application of a SAV simulation model could be to evaluate whether
tuber-feeding bird populations are constrained by the available food sources and in
what years. Such an analysis can only be undertaken at the level of the catchments
within which the birds reside. Application of GIS-based SAV models might ulti-
mately enable conservationists to address such questions.
ACKNOWLEDGMENTS
Financial support for this research was provided by the Stichting voor Wetenschap-
pelijk Onderzoek van de Tropen (the Netherlands Foundation for the Advancement
of Tropical Research [WOTRO], File number: WB 84-550) and the International
Institute for Geo-information Science and Earth Observation (ITC), the Nether-
lands. We also acknowledge support from the School of Resource and Environmen-
tal Sciences, Wuhan University, China; the International Crane Foundation, United
States; the Jiangxi Bureau of Forestry, China; and the Bureau of Jiangxi Poyang
Lake National Nature Reserve, China.
REFERENCES
Bartell, S. M., et al. 2000. Interim report for the upper Mississippi River system—Illinois
waterway system navigation study. Ecological risk assessment of the effects of incre-
mental increase of commercial navigation trafc (25, 50, 75, and 100% increase of
1992 baseline trafc) on submerged aquatic plants in the main channel borders. ENV
Report 17. Rock Island, IL: U. S. Army Corps of Engineers, Rock Island District, St.
Louis District, St. Paul District.
Best, E. P. H., and W. A. Boyd. 2001a. A simulation model for growth of the submersed
aquatic macrophyte American wildcelery (Vallisneria americana Michx.). ERDC/EL
TR-01-5. Vicksburg, MS: U.S. Army Engineer Research and Development Center.
Best, E. P. H., and W. A. Boyd. 2001b. VALLA (version 1.0): A simulation model for growth
of American wildcelery. ERDC/EL SR-01-1. Vicksburg, MS: U.S. Army Engineer
Research and Development Center.
Best, E. P. H., et al. 2004. Modeling the impacts of suspended sediment concentration and
current velocity on submersed vegetation in an Illinois river pool, USA. ERDC/TN
APCRP-EA-07. Vicksburg, MS: U.S. Army Engineer Research and Development Center.
© 2008 by Taylor & Francis Group, LLC
198 Wetland and Water Resource Modeling and Assessment
Best, E. P. H., et al. 2005. Aquatic plant growth model renement for the upper Missis-
sippi River—Illinois waterway system navigation study. ENV Report 51. Rock Island,
IL: U. S. Army Corps of Engineers, Rock Island District, St. Louis District, St. Paul
District.
Calado, G., and P. Duarte. 2000. Modelling growth of Ruppia cirrhosa. Aquatic Botany
68:29–44.
Carr, G. M., et al. 1997. Models of aquatic plant productivity: A review of the factors that
inuence growth. Aquatic Botany 59:195–215.
Chambers, P. A., and J. Kalff. 1987. Light and nutrients in the control of aquatic plant com-
munity structure. Journal of Ecology 75:611–619.
Chen, R., et al. 2006. Estimating daily global radiation using two types of revised models in
China. Energy Conversion and Management 47:865–878.
Collins, C. D., and J. H. Wlosinski. 1989. A macrophyte submodel for aquatic ecosystems.
Aquatic Botany 33:191–206.
Dewidar, K., and A. Khedr. 2001. Water quality assessment with simultaneous Landsat-5 TM
at Manzala Lagoon, Egypt. Hydrobiologia 457:49–58.
Fox, M. F., et al. 2005. Spatial and temporal distributions of surface temperature and chloro-
phyll in the Gulf of Maine during 1998 using SeaWiFS and AVHRR imagery. Marine
Chemistry 97:104–123.
Giusti, E., and S. Marsili-Libelli. 2005. Modelling the interactions between nutrients and the
submersed vegetation in the Orbetello Lagoon. Ecological Modelling 184:141–161.
Handcock, R. N., et al. 2006. Accuracy and uncertainty of thermal-infrared remote sens-
ing of stream temperatures at multiple spatial scales. Remote Sensing of Environment
100:427–440.
Harwell, M. C., and K. E. Havens. 2003. Experimental studies on the recovery potential of
submerged aquatic vegetation after ooding and desiccation in a large subtropical lake.
Aquatic Botany 77:135–151.
Herb, W. R., and H. G. Stefan. 2003. Integral growth of submersed macrophytes in varying
light regimes. Ecological Modelling 168:77–100.
Hootsmans, M. J. M. 1994. A growth analysis model for potamogeton pectinatus L. In Lake
Veluwe, a macrophyte-dominated system under eutrophication stress, ed. W. Van
Vierssen, M. Hootsmans, and J. Vermaat. Dordrecht, the Netherlands: Kluwer Aca-
demic Publishers, 250–286.
Huang, B., and B. Jiang. 2002. AVTOP: A full integration of TOPMODEL into GIS. Environ-
mental Modelling and Software 17:261–268.
Jahn, L. A., and R. V. Anderson. 1986. The ecology of pools 19 and 20, of the upper Missis-
sippi River: A community prole. U.S. Fish and Wildlife Service, Biological Report
8517.67.
Jonzen, N., et al. 2002. Seasonal herbivory and mortality compensation in a swan-pondweed
system. Ecological Modelling 147:209–219.
Kanai, Y., et al. 2002. Migration routes and important resting areas of Siberian cranes (Grus
Leucogeanus) between northeastern Siberia and China as revealed by satellite tracking.
Biological Conservation 106:339–346.
Kandirmaz, H. M., et al. 2004. Daily global solar radiation mapping of Turkey using metepsat
satellite data. International Journal of Remote Sensing 25:2159–2168.
Korschgen, C. E. 1989. Riverine and deepwater habitats for diving ducks. In Habitat manage-
ment for migrating and wintering waterfowl in North America, ed. L. M. Smith, R. L.
Pederson, and R. M. Kaminski. Lubbock: Texas Tech University Press, 157–180.
LaMontagne, J. M., et al. 2003. Compensatory growth responses of Potamogeton pectinatus
to foraging by migrating trumpeter swans in spring stop over areas. Aquatic Botany
76:235–244.
© 2008 by Taylor & Francis Group, LLC
A Conceptual Framework 199
Lillesand, T. M. 2004. Combining satellite remote sensing and volunteer Sechhi disk measure-
ment for lake transparency monitoring. />Papers-Alphabetical%20by%20First%20Name/Thomas%20Lillesand-Satellite.pdf
(accessed June 8, 2006).
Lillesand, T. M., and J. W. Chipman. 2001. Satellite-assisted lake water quality: Using satel-
lite data to observe regional trends in lake transparency. GIM International 15:26–29.
Meine, C. D., and G. W. Archibald, eds. 1996. The cranes—status survey and conservation
action plan. Gland, Switzerland: IUCN.
Scheffer, M., et al. 1993. MEGAPLANT: A simulation model of the dynamics of submerged
plants. Aquatic Botany 45:341–356.
Van Nes, E. H., et al. 2003. Charisma: A spatial explicit simulation model of submerged
macrophytes. Ecological Modelling 159:103–116.
Van Vierssen, W., et al. 1994. Lake Veluwe, a macrophyte-dominated system under eutrophi-
cation stress. Dordrecht, the Netherlands: Kluwer Academic Publishers.
Wang, X. J., and T. Ma. 2001. Application of remote sensing techniques in monitoring and
assessing the water quality of Taihu Lake. Bulletin of Environmental Contamination
and Toxicology 67:863–870.
Wu, G., J. De Leeuw, A. K. Skidmore, H. H. T. Prins, and Y. Liu, (2007a). Comparison of
MODIS and Landsat TM5 images for mapping tempo-spatial dynamics of Secchi disk
depths in Poyang Lake national nature reserve, China, International Journal of Remote
Sensing, In Press, Accepted Manuscript.
Wu, G., J. De Leeuw, A. K. Skidmore, H. H. T. Prins, and Y. Liu, (2007b). Concurrent moni-
toring of vessels and water turbidity enhances the strength of evidence in remotely
sensed dredging impact assessment. Water Research, 41(15):3271–3280.
Wu, Y., and W. Ji. 2002. Study on Jiangxi Poyang Lake National Nature Reserve. Beijing,
China: Forest Publishing House.
© 2008 by Taylor & Francis Group, LLC