báo cáo hóa học: " Onset and persistence of person-perceived participation restriction in older adults: a 3-year follow-up study in the general population" pptx
Bạn đang xem bản rút gọn của tài liệu. Xem và tải ngay bản đầy đủ của tài liệu tại đây (288.59 KB, 11 trang )
BioMed Central
Page 1 of 11
(page number not for citation purposes)
Health and Quality of Life Outcomes
Open Access
Research
Onset and persistence of person-perceived participation restriction
in older adults: a 3-year follow-up study in the general population
Ross Wilkie*, Elaine Thomas, Sara Mottram, George Peat and Peter Croft
Address: Arthritis Research Campaign National Primary Care Centre, Primary Care Sciences, Keele University, Keele, Staffordshire, ST5 5BG, UK
Email: Ross Wilkie* - ; Elaine Thomas - ; Sara Mottram - ;
George Peat - ; Peter Croft -
* Corresponding author
Abstract
Background: Participation restriction is defined as "problems an individual may experience in
involvement in life situations" and refers to the personal and societal consequences of health
conditions. There is a growing interest in participation restriction because (i) problems with work
or looking after others may be more concerning to individuals than the signs and symptoms of
health conditions and (ii) even when poor health persists, participation may still be maintained. The
natural history of participation restriction in the general population is unknown and the aim of this
report is to describe change in status of person-perceived participation restriction over three years
in community-dwelling adults aged 50 years and over.
Method: Prospective cohort study (baseline and 3-year follow-up) using postal questionnaires
mailed to a population-based sample of older adults. Responders were included in this study if they
completed all items of the Keele Assessment of Participation at baseline (n = 6965). Estimates of
onset and persistence of person-perceived participation restriction at 3-year follow-up were
calculated for any and for each aspect of life in the sample as a whole, and then by age and gender
using attrition re-weighted logistic regression to take account of sample attrition.
Results: In the whole sample of 6965 persons, overall participation status at three years was
unchanged in 69%, and changed in 31%. Of 3431 persons with no restriction at baseline, it is
estimated that 29.8% (95% confidence interval: 27.6%, 32.0%) would report restriction in at least
one aspect of life at 3-year follow-up. Of 3534 persons who had baseline restriction, it is estimated
that 68.8% (66.2%, 71.3%) would report continuing restriction in at least one aspect of life after 3
years. Onset and persistence both increased with age, and were most frequently recorded for
restricted mobility outside the home.
Conclusion: Although most older persons do not change their overall participation status during
a three-year period, change does occur which implies that population approaches to improving
participation can be sought. Both onset and persistence of person-perceived participation
restriction are more common the older the age-group.
Published: 5 November 2008
Health and Quality of Life Outcomes 2008, 6:92 doi:10.1186/1477-7525-6-92
Received: 14 May 2008
Accepted: 5 November 2008
This article is available from: />© 2008 Wilkie et al; licensee BioMed Central Ltd.
This is an Open Access article distributed under the terms of the Creative Commons Attribution License ( />),
which permits unrestricted use, distribution, and reproduction in any medium, provided the original work is properly cited.
Health and Quality of Life Outcomes 2008, 6:92 />Page 2 of 11
(page number not for citation purposes)
Understanding the impact of health conditions on the
lives of older people is important for the development of
policies and management strategies to reduce the adverse
consequences of ageing in individuals and society [1,2].
The International Classification of Functioning, Disability
and Health provides a framework to describe the impact
of health conditions on abnormal functioning at three
separate levels: anatomical/physiological (impairment);
individual (activity limitation); and societal (participa-
tion restriction) [3].
Our knowledge of the natural history of these three levels
and of the underlying health conditions, is uneven. The
prevalence and incidence of several health conditions and
impairments (e.g. cardiovascular disease [4]; osteoarthri-
tis [5]; cognitive impairment [6]; diabetes [7]) increase
strongly with age. The impact of these on activity limita-
tion has been previously investigated and, although the
prevalence and incidence of activity limitations, also
increase with age [8], recent studies suggest a dynamic
process, often involving multiple episodes, recovery from
single episodes, and episode recurrence [9-16]. Much less
is known about the pattern of participation restriction,
which is defined as "problems an individual may experi-
ence in involvement in life situations" and refers to the
personal and societal consequences of health conditions
[3]. There is a growing interest in such consequences and
the influence of environmental factors on them [17-19].
Participation in life situations, such as looking after others
and work, as well as psychological well-being [20], may be
of more concern to individuals than the underlying
impairments and activity limitation [21].
We have previously reported from cross-sectional data
that person-perceived participation restriction is common
in adults aged 50 years and over, increases with age and
female gender, and most commonly affects mobility out-
side the home [22]. Incidence and recovery rates of partic-
ipation restriction in the general population are not
known. Such information would help to establish the
extent to which older adults maintain or regain their
desired levels of function in everyday life – despite an
increasing frequency of health conditions, impairments
and activity limitations – by adaptation [23,24], the use of
aids [25-27], assistance from others [28,29] and changes
in perception [30,31]. The aim of this prospective analysis
was to describe the onset and persistence of person-per-
ceived participation restriction in a population sample of
older people, over a period of three years.
Methods
The design was a prospective cohort study, based on
postal surveys at baseline (April 2002) and 3-year follow-
up (April 2005), in an older adult population. Ethical
approval for the study was obtained from the North Staf-
fordshire Local Research Ethics Committee.
Study design and participants
Details of the recruitment survey have been presented pre-
viously [32,33]. In summary, the population registers of
three general practices from the North Staffordshire Pri-
mary Care Research Consortium were used as a popula-
tion sampling frame to mail 11230 adults aged 50 years
and over with a postal questionnaire about health and
lifestyle matters. 7259 adults returned questionnaires in
which all items in one section (Keele Assessment of Partic-
ipation (KAP)[34]) had been completed (overall response
= 71.3%) (April 2002). This group as a whole were very
similar in general health, age, gender and marital status to
UK norms, suggesting that there was no substantial non-
response bias [22]. 5032 gave written permission for fur-
ther contact and were eligible for the follow-up study (Fig-
ure) 1.
There were 3709 fully completed questionnaires returned
at 3 years, giving a follow-up response of 73.7% among
persons who were eligible and had consented to the fol-
low-up and representing 51% of the original responding
population at baseline. Those lost to follow-up include
294 deaths, 12 departures and 24 exclusions because of
terminal illness or severe psychiatric illness; non-respond-
ers among the remaining persons for follow-up included
72 people who declined to participate, 29 people who
stated ill health as the reason for not completing the ques-
tionnaire, 599 people from whom no response was
received and 293 returned questionnaires with incom-
plete KAP items. The study population for the analysis of
observed data thus consisted of the 3709 persons who
returned fully completed questionnaires on both occa-
sions. Estimated data was calculated for adults who com-
pleted the KAP at both time points and those who
completed the KAP at baseline and were lost to follow-up
(this is defined as those who did not consent to follow-up,
non-responders at follow-up, exclusions and those who
did not complete the KAP (n = 6965)).
Data collection
The baseline and follow-up questionnaires collected
information on demographic, socioeconomic and general
health characteristics, including the Short Form-12 instru-
ment (SF-12) [35]. Participation restriction was measured
by the KAP [34]. This short self-complete instrument is
designed to measure participation from the perspective of
the individual in 11 aspects of life mapped to domains
and sub-domains of the ICF: mobility within the home,
mobility outside the home, self-care, looking after belong-
ings, looking after the home, looking after dependents,
interpersonal interaction, managing money, work, educa-
tion, and social activities. Items are phrased to capture
Health and Quality of Life Outcomes 2008, 6:92 />Page 3 of 11
(page number not for citation purposes)
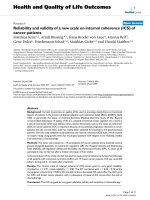
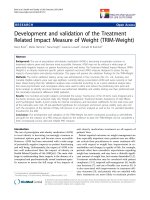
Flow diagram of participantsFigure 1
Flow diagram of participants.
Responders who completed all
KAP items in the cross-sectional
Health Survey in 2002 (n=7259)
Respondents giving permission
for further contact (n=5032)
Mailed 3yr Health Survey
(n=4753)
Deaths and exclusions during
mailing (n=51)
Deaths and exclusions prior to
mailing (n=279)
Non-respondents
(
n=700
)
Respondents to 3yr Health Survey
in 2005 (n=4002)
Adjusted response of 85.1%
Eligible 3yr population
(n=4702)
No permission for further
contact
(
n=2227
)
Missing KAP data in 2005
(
n=293
)
Responders who completed the
KAP in the 3yr Health Survey in
2005 and were included in the
analysis (n=3709)
Mailed baseline health
q
uestionnaire in 2002
(
n=11230
)
Non-response/ineligible
(
n=3971
)
Health and Quality of Life Outcomes 2008, 6:92 />Page 4 of 11
(page number not for citation purposes)
performance ("I have"), individual judgement, and the
nature and timeliness of participation ("as and when I
have wanted"). Responses are on a five point ordinal scale
(All/Most/Some/A little/None of the time) and respond-
ers were considered restricted in an aspect of life if they
did not participate in it "as and when they wanted" for
"all" or "most of the time". The number of aspects of life,
where responders indicated participation restriction, was
calculated for both time points and categorised to (i) any
restriction (participation restriction in at least one aspect
of life) and (ii) minimal (1–2 restricted aspects of life) or
moderate/substantial (3–11 restrictions (moderate and
substantial were combined due to small numbers in the
substantial category for some items (e.g. work)). The reli-
ability and validity of the KAP have been established as
adequate for providing estimates of perceived participa-
tion restriction in population studies [34].
Statistical analysis
Data recorded in the baseline survey was used to assess the
effect of (i) loss to follow-up and (ii) death prior to fol-
low-up, by examining differences in baseline demograph-
ics (age, gender), socio-economic status (occupation,
educational attainment), general health (physical and
mental SF-12 scores) and participation restriction. Per-
centages and means were used to compare groups with
different follow-up outcomes.
The following analysis was carried out on the observed
data, i.e. on those completing the 3-year follow-up, and to
assess the effects of loss to follow-up, we repeated the
onset and persistence analyses assuming that those lost at
follow-up had the same likelihood of participation restric-
tion (examining onset and persistence separately), within
strata defined by age, gender, educational attainment,
occupational class and general health (using SF-12 physi-
cal and mental health scores), as those who did complete
the three year follow-up questionnaire. These six strata-
defining variables were selected a priori as they were used
to describe the differences between responders and those
lost to follow-up. These estimates were calculated using
attrition re-weighted logistic regression [36] performed in
Stata 9.2.
The frequencies of three-year onset of participation restric-
tion (defined as moving from no restriction at baseline to
any restriction at three year follow-up) and three-year per-
sistence (any restriction at both baseline and follow-up)
were calculated overall, and by age and gender, and sum-
marized using percentages.
For those with three-year persistence, the proportion that
reported (i) the same number and same restrictions at
baseline and follow-up, (ii) the same number but differ-
ent restrictions at follow-up, (iii) a lower number at fol-
low-up and (iv) a greater number at follow-up, were
calculated.
Onset of restriction for each of the 11 aspects of life was
calculated as the proportion of those not restricted in that
aspect of life at baseline who reported restriction in that
aspect at 3 years, regardless of whether the individual
reported restriction in other items at baseline or three year
follow-up. This analysis was also conducted stratified by
age group and gender.
In individuals with participation restriction at baseline,
estimates of persistence within each of the 11 aspects of
life were calculated overall, and by age and gender. Persist-
ence was calculated as those with restriction in an aspect
of life at both baseline and follow-up.
To examine the link between onset of restriction in each
aspect of life and amount of restriction at baseline (0, 1–
2, 3–11), we used logistic regression, unadjusted, adjusted
for gender and, separately, adjusted for age (10 year
bands). Associations are presented as odds ratios, with
95% confidence intervals.
Results
Baseline differences between those who completed all KAP
items at three-year follow-up, those lost to follow-up and
those who died before follow-up
Persons who completed all KAP items (n = 3709) at 3-year
follow-up, compared with the 3256 persons lost to fol-
low-up, had higher baseline levels of physical health (SF-
12 physical health score: 42.3 v 39.9) (Table 1) and men-
tal health (SF-12 mental health score: 49.8 v 48.3), and
were more likely to be younger (aged 50 to 69: 72.7% v
55.4%), have gone on to further education (41.1% v
25.6%) and be classified as having a non-manual occupa-
tion (48.7% v 34.7%). They were also less likely to report
participation restriction (any restriction: 44.7% v 57.6%).
In turn, compared with 294 persons who died between
baseline and follow-up, persons lost to follow-up had
higher levels of physical health (39.9 v 32.1), and mental
health (48.3 v 44.3), and were more likely to be younger
(aged 50 to 69: 55.4% v 27.9%). They were less likely to
report participation restriction (any restriction: 57.8% v
76.5%).
There was little difference between the attrition re-
weighted estimates in any of the onset and persistence
analyses. Therefore, all estimates presented here are for
the attrition re-weighted analyses. The observed data are
available in additional file 1 Observed onset and persist-
ence of restriction in any and each aspect of life at three
years.
Health and Quality of Life Outcomes 2008, 6:92 />Page 5 of 11
(page number not for citation purposes)
Onset and persistence of any restriction
Among the whole study population of this analysis (n =
6965), 69% did not change their overall participation sta-
tus, whilst 31% either developed or recovered from partic-
ipation restriction. The estimated proportion of 3431
participants with no restriction at baseline, who would
report restriction at three-year follow-up was 29.8% (95%
confidence interval: 27.6%, 32.0%) (Table 2). This esti-
mated proportion was similar in women and men (29.0%
(26.1%, 32.1%) v 30.6% (27.6%, 33.8%), and increased
with age in both genders, although this trend was more
pronounced in women. Of those with no restriction at
baseline, 26.5% (24.4%, 28.6%) would indicate restric-
tion in one to three items and 3.3% (2.5%, 4.3%) in four
to eleven items, at three-year follow-up.
The estimated proportion of 3534 participants with any
restriction at baseline, who would report restriction at
three-year follow-up was 68.8% (66.2%, 71.3%). The pro-
portion with persistence of restriction was higher in
women than men (72.4% (69.1%, 75.4%) v 63.9%
(59.8%, 67.8%), and increased with age in both genders,
although more so in women than men.
However the overall picture in the persistent group hides
variation in the change in status of individual participa-
tion items. Of those who would indicate three-year per-
sistence, 12.3% (10.3%, 14.6%) would indicate the same
restrictions at both time points, 20.1% (17.5%, 22.9%)
would indicate the same number of restrictions but differ-
ent areas would be restricted, 35.1% (32.0%, 38.4%)
would indicate a lower number of restrictions and 33.2%
(29.5%, 35.8%) would indicate a greater number of
restrictions at follow-up.
Onset and persistence for individual aspects of restriction
Onset of restriction at 3 years in individual aspects of life
ranged from 3.0% (2.5%, 3.7%) (work) to 12.2% (10.9%,
13.6%) (mobility outside the home) (Table 3). Onset
increased with age for 8 aspects of life and decreased with
Table 1: Baseline characteristics of those with completed KAP, lost and dead at follow-up
Completed KAP
at follow-up
(n = 3709)
No (%)
Lost to
follow-up
(n = 3256)
No (%)
Dead at
follow-up
(n = 294)
No. (%)
Age (years)
50–59 1432 (38.6) 936 (28.7) 22 (7.5)
60–69 1264 (34.1) 871 (26.7) 60 (20.4)
70–79 801 (21.6) 931 (28.6) 115 (39.1)
80+ 212 (5.7) 518 (15.9) 97 (33.0)
Gender
Male 1645 (44.4) 1385 (42.5) 172 (58.5)
Female 2064 (55.7) 1871 (57.5) 122 (41.5)
Educational attainment*
Further education 1514 (41.1) 822 (25.6) 86 (29.5)
School education only 2174 (59.0) 2392 (74.4) 206 (70.6)
Occupational class*
Non-manual 1718 (48.7) 1001 (34.7) 123 (44.9)
Manual 1809 (51.3) 1887 (65.3) 151 (55.1)
Participation restriction
Any (≥1 aspect) 1660 (44.8) 1874 (57.5) 225 (76.5)
Minimal (1–3 aspects) 1250 (33.7) 1322 (40.6) 125 (42.5)
Moderate (4–6 aspects) 308 (8.3) 433 (13.3) 81 (27.6)
Substantial (7–11 aspects) 102 (2.8) 119 (3.7) 19 (6.5)
SF-12 Physical health score*
Mean (SD) 42.3 (12.3) 39.9 (12.5) 32.1 (11.0)
SF-12 Mental health score*
Mean (SD) 49.8 (11.1) 48.3 (11.2) 44.3 (11.7)
* – is subject to missing data
Health and Quality of Life Outcomes 2008, 6:92 />Page 6 of 11
(page number not for citation purposes)
age for the remaining 3 aspects of life (looking after
dependents, work, education). Onset was more frequent
in women than in men for two aspects of life (mobility
outside the home, interpersonal interaction) (data not
shown).
Onset of restriction in individual aspects of life was more
frequent in those who had restriction in other aspects of
life at baseline (Table 4). These relationships were not
affected by adjustment for age or for gender. The associa-
tion with onset was stronger as baseline restriction
increased for all aspects of life, other than for looking after
dependents and for work and education.
Persistence of restriction in individual aspects of life,
among persons with baseline participation restriction,
was highest for mobility outside the home (63.7%
(59.6%, 67.6%)) and was lowest for work (10.9% (6.7%,
17.3%)) (Table 3). Persistence increased with age for one
aspect of life (mobility outside the home) and decreased
with age in one aspect (looking after dependants). There
was no relationship between persistence and age for the
remaining nine aspects of life. Persistence was greater in
women than men for four aspects of life (looking after the
home, looking after belongings, interpersonal interaction,
social activities) (data not shown).
Discussion
Participating in life situations "as and when you want" is
an essential part of life, and establishing the natural his-
tory of person-perceived participation restriction in older
adults provides a perspective on the effects of health on
everyday life and the potential need for effective interven-
tions to improve participation. Estimating incidence and
recovery highlights the potential for participation restric-
tion to be modified or prevented. We have previously
reported that about one half of a general population sam-
ple of adults aged 50 and over report participation restric-
tion at any one time; now in this prospective follow-up of
these community-dwelling older adults, we have shown
that there is a substantial degree of change in participation
status over a three-year period. Nearly 30% of those who
were participating "as and when they wanted" in all
aspects of life at baseline indicated that they were not
doing so in at least one aspect of life three years later,
whereas almost one third of those who had a restriction at
baseline were reporting at three-year follow-up that they
were now free of restrictions in any aspect of their lives. In
addition many of those who continue to indicate restric-
tion in at least one aspect of life at three years, have indi-
cated recovery and onset of restriction in different areas to
those indicated at baseline. However these figures must be
set in the context that, for most people, overall status
Table 2: Estimates of the onset and persistence of any restriction at three-year follow-up in older adults who completed the KAP at
three year follow-up and those lost at follow-up; overall and stratified by age and gender
Estimated onset of any restriction Estimated persistence of any restriction
% (95% CI) % (95% CI)
Overall 29.8 (27.6, 32.0) 68.8 (66.2, 71.3)
Gender
Females 29.0 (26.1, 32.1) 72.4 (69.1, 75.4)
Males 30.6 (27.6, 33.8) 63.9 (59.8, 67.8)
Age group
Overall
50–59 years 26.4 (23.4, 29.6) 62.8 (58.5, 66.9)
60–69 years 26.7 (23.4, 30.4) 63.6 (58.9, 68.1)
70–79 years 36.9 (31.8, 42.3) 74.7 (69.5, 79.2)
80+ yrs 48.0 (35.5, 60.8) 86.3 (77.7, 91.2)
Females
50–59 years 25.4 (21.4, 29.6) 66.3 (60.6, 71.5)
60–69 years 26.5 (22.0, 31.6) 69.3 (63.2, 74.9)
70–79 years 35.1 (28.1, 42.8) 75.0 (68.4, 80.6)
80+ yrs 51.4 (33.2, 69.2) 89.6 (80.7, 94.7)
Males
50–59 years 27.4 (23.0, 32.3) 58.4 (51.7, 64.7)
60–69 years 27.0 (22.3, 32.2) 56.8 (49.6, 63.7)
70–79 years 38.8 (31.7, 46.4) 74.2 (65.5, 81.4)
80+ yrs 45.1 (28.4, 63.0) 79.7 (59.6, 91.3)
Health and Quality of Life Outcomes 2008, 6:92 />Page 7 of 11
(page number not for citation purposes)
Table 3: Estimates of onset and persistence of participation restriction in individual aspects of life at three years in older adults who completed the KAP at three year follow-up
and those lost at follow-up
Mobility
within
the
home
%
(95% CI)
Mobility
outside
the
home
%
(95% CI)
Self-
care
%
(95% CI)
Looking
after
the
home
%
(95% CI)
Looking
after
belongings
%
(95% CI)
Looking
after
dependents
%
(95% CI)
Interpersonal
interaction
%
(95% CI)
Managing
money
%
(95% CI)
Work
%
(95% CI)
Education
%
(95% CI)
Social
activities
%
(95% CI)
Onset of
restriction
Overall 6.1
(5.2, 7.2)
12.2
(10.9, 13.6)
6.1
(5.2, 7.1)
8.6
(7.6, 9.9)
5.7
(4.9, 6.8)
3.9
(3.3, 4.7)
8.1
(7.1, 9.2)
10.6
(9.4, 11.8)
3.0
(2.5, 3.7)
3.4
(2.8, 4.1)
10.1
(9.0, 11.3)
50–59 years 3.6
(2.7, 4.9)
7.1
(5.7, 8.8)
4.0
(3.0, 5.3)
7.2
(5.8, 9.0)
5.0
(3.8, 6.4)
4.6
(3.5, 6.0)
5.9
(4.6, 7.4)
8.7
(7.2, 10.6)
3.5
(2.6, 4.7)
5.8
(4.6, 7.2)
9.3
(7.7, 11.1)
60–69 years 4.6
(3.4, 6.2)
9.2
(7.4, 11.3)
5.3
(4.0, 6.9)
6.6
(5.1, 8.4)
4.6
(3.4, 6.3)
4.2
(3.1, 5.6)
6.1
(4.8, 7.9)
10.8
(9.0, 13.0)
3.4
(2.4, 4.7)
2.8
(2.0, 4.0)
8.8
(7.1, 10.8)
70–79 years 8.6
(6.4, 11.3)
20.0
(16.6, 24.0)
7.1
(5.2, 9.7)
11.7
(9.1, 14.9)
6.9
(5.0, 9.6)
3.1
(1.9, 5.0)
11.0
(8.6, 14.1)
12.7
(10.1, 16.0)
2.7
(1.6, 4.3)
1.7
(1.0, 2.9)
12.6
(9.9, 15.7)
80+ years 18.6
(12.3, 27.1)
35.9
(26.5, 46.6)
18.2
(12.1, 26.4)
15.3
(9.6, 23.5)
11.0
(6.5, 18.2)
2.1
(0.7, 6.3)
19.8
(13.6, 27.9)
11.2
(6.6, 18.3)
0.3
(0.1, 2.3)
0.8
(0.2, 3.2)
11.2
(6.9, 17.7)
Persistence
of
restriction
Overall 44.7
(38.8, 50.7)
63.7
(59.6, 67.6)
39.9
(33.2, 47.0)
49.5
(44.3, 54.8)
41.4
(35.5, 47.6)
21.5
(16.0, 28.3)
50.7
(45.2, 56.1)
47.0
(42.1, 52.0)
10.9
(6.7, 17.3)
18.4
(13.1, 25.2)
32.6
(28.2, 37.3)
Health and Quality of Life Outcomes 2008, 6:92 />Page 8 of 11
(page number not for citation purposes)
remained unchanged; 39% of the sample remained
restriction free at three year follow-up and most persons
reporting a restriction at baseline were still restricted in at
least one aspect of life three years later. Although the
three-year interval may miss meaningful transition
between participation and participation restriction
[12,15], our findings still highlight that participation sta-
tus over this time period changes for some adults and
remains stable for others.
These overall figures conceal substantial contrasts in the
patterns of change with age. The high likelihood of per-
Table 4: Estimated associations between the onset of restriction in individual aspects of life and amount of restriction at baseline,
unadjusted, adjusted for gender and adjusted for age; Odds ratios and 95% confidence intervals
Unadjusted OR* (95% CI)
†
Gender adjusted Adj OR (95% CI) Age adjusted Adj OR (95% CI)
Mobility within the home
1–2 2.67 (1.79, 3.97) 2.68 (1.80, 3.98) 2.40 (1.60, 3.60)
3+ 7.53 (4.76, 11.91) 7.61 (4.81, 12.05) 6.52 (4.10, 10.35)
Mobility outside the home
1–2 1.91 (1.45, 2.52) 1.91 (1.45, 2.51) 1.86 (1.40, 2.46)
3+ 3.24 (1.94, 5.40) 3.20 (1.93, 5.32) 3.30 (1.92, 5.66)
Self-care
1–2 2.42 (1.60, 3.66) 2.42 (1.60, 3.66) 2.20 (1.45, 3.34)
3+ 8.12 (5.30, 12.46) 8.16 (5.34, 12.48) 7.40 (4.52, 11.36)
Looking after the home
1–2 2.19 (1.59, 3.03) 2.19 (1.59, 3.02) 2.07 (1.49, 2.88)
3+ 5.99 (3.88, 9.26) 5.98 (3.87, 9.23) 5.53 (3.56, 8.61)
Looking after belongings
1–2 2.31 (1.52, 3.49) 2.29 (1.52, 3.47) 2.21 (1.46, 3.37)
3+ 7.07 (4.48, 11.14) 7.00 (4.46, 1.00) 6.54 (4.05, 10.58)
Looking after dependents
1–2 1.03 (0.63, 1.66) 1.02 (0.64, 1.65) 1.10 (0.68, 1.78)
3+ 3.06 (1.95, 4.81) 3.03 (1.92, 4.78) 3.54 (2.25, 5.55)
Interpersonal interaction
1–2 2.67 (1.92, 3.70) 2.65 (1.91, 3.67) 2.46 (1.77, 3.42)
3+ 5.67 (3.72, 8.65) 5.58 (3.67, 8.48) 5.07 (3.29, 7.86)
Managing money
1–2 1.64 (1.21, 2.21) 1.63 (1.21, 2.20) 1.62 (1.20, 2.18)
3+ 2.08 (1.44, 3.00) 2.05 (1.42, 2.96) 2.03 (1.40, 2.95)
Work
1–2 1.24 (0.78, 1.97) 1.23 (0.78, 1.95) 1.33 (0.83, 2.13)
3+ 1.10 (0.60, 2.03) 1.08 (0.59, 1.98) 1.25 (0.67, 2.32)
Education
1–2 1.14 (0.76, 1.72) 1.14 (0.76, 1.73) 1.31 (0.87, 2.00)
3+ 0.57 (0.30, 1.10) 0.57 (0.30, 1.11) 0.69 (0.35, 1.34)
Social activities
1–2 1.53 (1.14, 2.06) 1.53 (1.14, 2.06) 1.50 (1.11, 2.02)
3+ 2.07 (1.41, 3.04) 2.08 (1.41, 3.05) 1.99 (1.35, 2.94)
* Odds ratio;
†
95 percent confidence interval
Health and Quality of Life Outcomes 2008, 6:92 />Page 9 of 11
(page number not for citation purposes)
sistence at older ages combined with the age-related
increase in the 3-year onset underlines the cumulative
problem of participation restriction as people become
older – exemplified by the declining likelihood of recov-
ery as people reach the oldest ages. Both incidence and
persistence are also higher in women, especially in
women aged 80 years and over, where half of those with-
out restriction at baseline indicated at least one aspect of
life restricted by three year follow-up, and 90% of women
in this age-group with a baseline restriction continued to
indicate restriction at three-year follow-up.
Older adults who were already experiencing restriction in
one aspect of life at baseline were more likely to indicate
restriction in other areas at three year follow-up than
those free of restriction. This indicates that once restric-
tion is present in one area of life, this becomes a risk factor
or risk marker for further areas of life to become restricted.
By contrast there is evidence that restriction is reversible
for some people, notably when it occurs in men and
adults in the younger age range of our sample of over-50
year olds, and when it is an isolated problem in one aspect
of life. However these rates of recovery may be over-esti-
mated for each aspect of life because they will include
individuals who no longer wish to participate in that
aspect of life, either because it has become too difficult to
maintain participation (in which case the extent of persist-
ence will be under-estimated) or because they simply no
longer need to participate in such areas. This may be par-
ticularly true for work, education and looking after
dependents, where persistence was lowest and the propor-
tion with participation restriction decreased with age [22].
The majority of the onset of restriction in mobility outside
the home, managing money, work, education or social
activities is experienced in those with no restriction in any
other aspect of life and this indicates how the profile of
participation restriction begins (data not shown). These
aspects of life provide potential priority areas in which
early interventions may prevent further restriction. In this
model, the evidence presented here highlights again the
prime importance of mobility outside the home because
it is the most common form of restriction and problems
with mobility are often the first function to become lim-
ited in the disability process [37].
The estimates of frequency of onset and persistence of par-
ticipation restriction, adjusting simultaneously for age,
gender, socio-economic status and physical and mental
health, in persons who were subsequently lost to follow-
up were similar to those observed for persons who com-
pleted the KAP at three years. By contrast clear differences
in age, gender, socio-economic status and general health
were observed between those included in the analysis and
those who had died at follow-up. Although prevalence
declined in the three-year period because of this selective
attrition, the overall number of people with participation
restriction in the sample followed from baseline to three
years has increased because the number of people who
have indicated onset of participation restriction is greater
than the number who indicated recovery.
There is a possibility that recovery may also be over-esti-
mated due to regression to the mean which occurs when
apparent abnormalities on initial investigation have a
high probability of being at the extreme end of an individ-
ual's normal range because of random variation [38] or
responder bias (people who recover may be more likely to
respond to a follow-up questionnaire). However partici-
pation restriction at baseline was higher in persons who
subsequently did not respond and it seems unlikely that
recovery estimates are substantially biased. Alternatively
some of the changes may be due to measurement error
rather than a true change in participation, although
repeatability investigations had suggested that most items
on the KAP are not subject to large responder variations in
short-term reporting [38].
Patterns of incidence and persistence over time for indi-
vidual aspects of life varied with age and gender and were
not necessarily the same as those cross-sectional relation-
ships observed at baseline between prevalence, age and
gender [22]. For example, at baseline the prevalence of
restricted self-care increased with age, whereas the persist-
ence of restricted self-care was higher in the younger age-
groups (50–59, 60–69, 70–79) than in those aged 80 and
over. In addition to the limitations of this study discussed
previously (attrition, measurement error and regression to
the mean), small numbers of those restricted at baseline
for some individual items (such as self-care) and the con-
sequent unstable estimate of change, may explain these
inconsistent relationships between age and restriction
patterns over time in some aspects of life.
We have previously shown that person-perceived partici-
pation restriction is common in adults aged 50 years and
over in the community but the follow-up study has high-
lighted the substantial degree of change in participation
status that can occur in a three-year time period. The
results indicate the potential for prevention and reduction
in the level of restriction. Prevention of onset or early
intervention to reverse isolated restriction could poten-
tially reduce the risk of progression to other areas of
restriction. Even for persons who have established restric-
tions, the observations of a significant rate of reversibility
underlines the need to identify ways to enhance such
improvement.
Our results reflect previous studies of the changes and
extent of limitations in other forms of disability [11,12].
Health and Quality of Life Outcomes 2008, 6:92 />Page 10 of 11
(page number not for citation purposes)
Deeg [15] reported that 53% of adults aged between 55
and 85 did not report limitations in climbing stairs, cut-
ting toenails or using transportation over a six-year
period. Barberger-Gateau and colleagues [14] reported
that limitation in three definitions of disability (activities
of daily life, instrumental activities of daily life, mobility
and housework) persisted in around 50% of adults aged
65 and over who had the particular definition at baseline.
For participation, the causes of the onset, persistence and
recovery are likely to be numerous. Although medical
conditions play a major role, and medical interventions
may directly improve participation, environmental influ-
ences on functioning may be of greater importance in
older adults, such that participation may be maintained
even in the presence of health conditions, impairments
and activity limitations [39]. In future analyses we will
investigate the role of such influences on change in partic-
ipation status.
Conclusion
In this prospective follow-up study of community-dwell-
ing older adults, person-perceived participation status
changed during a three-year period, with onset of restric-
tion occurring as well as persistence and recovery. The
onset and persistence of any participation restriction was
more common the older the age-group. However for
some individual aspects, restriction decreased with age.
The results highlight the potential for prevention and
reduction in the level of restriction in older adults.
Abbreviations
KAP: Keele Assessment of Participation; SF-12: Medical
Outcomes Study Short Form 12 Questionnaire
Competing interests
The authors declare that they have no competing interests.
Funding
This study is supported financially by the Medical
Research Council, UK (grant code: G9900220) and by the
North Staffordshire Primary Care R&D Consortium.
Authors' contributions
All authors contributed substantially to (i) the conception
and design of the study, acquisition of data and analysis
and interpretation of data, (ii) drafting of this manuscript
and have given final approval of this version for publica-
tion.
Additional material
Acknowledgements
We would like to thank the administrative and health informatics staff at
Keele University's Primary Care Sciences Research Centre and the doctors
and staff of the participating general practices. We would also like to thank
David Whitehurst, Kelvin Jordan and Milisa Blagojevic for their comments
in drafting this paper.
References
1. Greengross S, Murphy E, Quam L, Rochan P, Smith R: Aging: a sub-
ject that must be at the top of world agendas. BMJ 1997,
351:1029-30.
2. Ebrahim S: Disability in older people: a mass problem requir-
ing mass solutions. Lancet 1999, 353:1990-2.
3. World Health Organization: International Classification of Func-
tioning, Disability and Health. World Health Organization:
Geneva; 2001.
4. Martin J, Meltzer H, Elliot D: OPCS surveys of disability in Great
Britain. Report 1 – The prevalence of disability among
adults. HMSO: London; 1988.
5. Felson DT, Lawrence RC, Dieppe PA, Hirsch R, Helmick CG, Jordan
JM, et al.: Osteoarthritis: new insights. Part 1: the disease and
its risk factors. Ann Intern Med 2000, 133(8):635-46.
6. Brayne C, Mathews FE, McGee MA, Jagger CA: Health and ill-
health in the older population in England and Wales. The
Medical Research Council Cognitive Function and Ageing
Study (MRC CFAS). Age Ageing 2001, 30:53-62.
7. Thomas C, Hyponnen E, Power C: Type 2 diabetes mellitus in
midlife estimated from the Cambridge Risk Score and body
mass index. Arch Intern Med 2006, 166:682-8.
8. Moore EG, Rosenberg MW, Fitzgibbon SH: Activity limitation and
chronic conditions in Canada's elderly, 1986–2011. Disabil
Rehabil 1999, 21:196-210.
9. Verbrugge LM, Reoma JM, Gruder-Baldini AL: Short-term dynam-
ics of disability and well-being. J Health Soc Behav 1994,
35:97-117.
10. Beckett LA, Brock DA, Lemke JH, Mendes de Leon CF, Guralnik JM,
Fillenbaum GG, et al.: Analysis of change in self-reported physi-
cal function among older persons in four population studies.
Am J Epidemiol 1996, 143:766-78.
11. Gill TM, Allore HG, Hardy SE, Guo Z: The dynamic nature of
mobility disability in older persons. J Am Geriatr Soc 2006,
54:248-54.
12. Gill TM, Kurland B:
The burden and patterns of disability in
activities of daily living among community-living older per-
sons. J Gerontol A Biol Sci Med Sci 2003, 58:70-5.
13. Hardy SE, Gill TM: Recovery from disability among commu-
nity-dwelling older persons. JAMA 2004, 291:1596-602.
14. Barberger-Gateau P, Rainville C, Letenneur L, Dartigues JF: A hier-
archial model of domains of disablement in the elderly: a lon-
gitudinal approach. Disabil Rehabil 2000, 22:308-17.
15. Deeg DJ: Longitudinal characterisation of course types of
functional limitations. Disabil Rehabil 2005, 27:253-61.
16. Nusselder WJ, Looman CW, Macenbach JP: The level and time
course of disability: trajectories of disability in adults and
young elderly. Disabil Rehabil 2006, 28:1015-26.
17. Verbrugge LM, Jette A: The disablement process. Soc Sci Med
1994, 38:1-14.
Additional file 1.
Observed onset and persistence of restriction in any and each aspect of life
at three years
Click here for file
[ />7525-6-92-S1.doc]
Publish with BioMed Central and every
scientist can read your work free of charge
"BioMed Central will be the most significant development for
disseminating the results of biomedical research in our lifetime."
Sir Paul Nurse, Cancer Research UK
Your research papers will be:
available free of charge to the entire biomedical community
peer reviewed and published immediately upon acceptance
cited in PubMed and archived on PubMed Central
yours — you keep the copyright
Submit your manuscript here:
/>BioMedcentral
Health and Quality of Life Outcomes 2008, 6:92 />Page 11 of 11
(page number not for citation purposes)
18. Badley EM: The genesis of handicap: Definition, models of dis-
ablement, and the role of external factors. Disabil Rehabil 1995,
17(2):53-62.
19. Grimby G, Smedby B: ICF approved as the successor of ICIDH.
Journal of Rehabil Med 2001, 33:193-4.
20. Hawker GA, Gignac MA: How meaningful is our evaluation of
meaningful change in osteoarthritis? J Rheumatol 2006,
33:639-41.
21. Harwood RH, Jitapunkul S, Dickinson E, Ebrahim S: Measuring
handicap: motives, methods, and a model. Qual Health Care
1994, 3:53-7.
22. Wilkie R, Peat G, Thomas E, Croft P: The prevalence of person-
perceived participation restriction in community-dwelling
older adults. Qual Life Res 2006, 15:1471-9.
23. Miles A, Curran HV, Pearce S, Allan L: Managing constraint: the
experience of people with chronic pain. Soc Sci Med 2005,
61:431-41.
24. Hoenig H, Ganesh SP, Taylor DH Jr, Pieper C, Guralnik J, Fried LP:
Lower extremity physical performance and use of compen-
satory strategies for mobility. J Am Geriatr Soc 2006, 54:262-9.
25. Gosman-Hedstrom G, Sonn U, Aniansson A: Different kinds of
services and informal support in the daily life activities in a
community-based elderly population. Aging 1995, 7:371-8.
26. Edwards NI, Jones DA: Ownership and use of assistive devices
amongst older people in the community. Age Ageing 1998,
27:463-8.
27. Boutron I, Poiraudeau S, Ravaud P, Baron G, Revel M, Nizard R, et al.:
Social and personal consequences of disability in adults with
hip and knee arthroplasty. A French national community
based survey. J Rheumatol 2004, 31:759-66.
28. Almberg B, Jansson W, Grafstrom M, Winblad B: Differences
between and within genders in caregiving strain: a compari-
son between caregivers of demented and non-caregivers of
non-demented elderly people. J Adv Nurs 1998, 28:849-58.
29. Emanuel EJ, Fairclough DL, Slutsman J, Alpert H, Baldwin D, Emanuel
LL:
Assistance from family members, friends, paid care giv-
ers, and volunteers in the care of terminally ill patients. N
Engl J Med 1999, 341:956-63.
30. Menzel P, Dolan P, Richardson J, Olsen JA: The role of adaptation
to disability and disease in health state valuation: a prelimi-
nary normative analysis. Soc Sci Med 2002, 55:2149-58.
31. Rochette A, Komer-Bitensky N, Levasseuar M: 'Optimal' participa-
tion: a reflective look. Disabil Rehabil 2006, 28:1231-5.
32. Thomas E, Wilkie R, Peat G, Hill S, Dziedzic K, Croft P: The North
Staffordshire Osteoarthritis Project–NorStOP: prospective,
3-year study of the epidemiology and management of clinical
osteoarthritis in a general population of older adults. BMC
Musculoskelet Disord 2004, 5:2.
33. Thomas E, Mottram S, Peat G, Wilkie R, Croft P: The effect of age
on the onset of pain interference in a general population of
older adults: Prospective findings from the North Stafford-
shire Osteoarthritis Project (NorStOP). Pain 2007, 129:21-7.
34. Wilkie R, Peat G, Thomas E, Croft P: The Keele Assessment of
Participation: a new instrument to measure participation
restriction in population studies. Combined qualitative and
quantitative examination of its psychometric properties.
Qual Life Res 2005, 14:1889-99.
35. Ware J Jr, Kosinski M, Keller SD: A 12-item Short-Form Health
Survey: construction of scales and preliminary tests of relia-
bility and validity. Med Care 1996, 34:220-33.
36. Dunn G, Pickles A, Tansella M, Vazquez-Barquero JL: Two-phase
epidemiological surveys in psychiatric research. Br J Psychiatry
1999, 174:95-100.
37. Dunlop DD, Hughes SL, Manheim LM: Disability in activities of
daily living: patterns of change and a hierarchy of disability.
Am J Public Health 1997, 87:378-83.
38. Morton V, Torgerson DJ: Effect of regression to the mean on
decision making in health care. BMJ 2003, 326:
1083-4.
39. Harwood RH, Prince M, Mann A, Ebrahim S: Associations between
diagnoses, impairments, disability and handicap in a popula-
tion of elderly people. Int J Epidemiol 1998, 27:261-8.