AUDITOR-GENERAL’S REPORT FINANCIAL AUDITS Volume Three 2009 focusing on Electricity _part3 pptx
Bạn đang xem bản rút gọn của tài liệu. Xem và tải ngay bản đầy đủ của tài liệu tại đây (118.53 KB, 9 trang )
______________________________________________________________________ Electricity Industry Overview
Auditor-General’s Report to Parliament 2009 Volume Three _________________________________________ 13
The projected LRC point does not necessarily mean generating capacity will be insufficient to meet
expected demand at this time, but it provides investors with an indication of the opportunities that
may exist for future investment.
Peak and Average Demand Growth Rates
The Australian Energy Market Operator (AEMO) projects the following peak and average demand
growth rates per year for electricity in New South Wales.
Demand growth rate per year 2009 2008 2007
Peak increase/(decrease) (%) (1.3) 2.3 2.5
Average increase/(decrease) (%) (4.3) 0.8 1.6
Source: AEMO Electricity Statement of Opportunities for the National Electricity Market 2009, and NEMMCO Statement of
Opportunities 2007 energy and demand projections for 2008 and 2009.
The reduction in peak demand and energy growth rates in 2009 is due to:
a poorer economic outlook
additional efficiency allowances, including tightened Minimum Energy Performance Standards
on appliance efficiency and accelerated uptake of solar hot water and small-scale
photovoltaic generation
a revision of non-scheduled energy projections.
This is trial version
www.adultpdf.com
Electricity Industry Overview ______________________________________________________________________
14 _________________________________________ Auditor-General’s Report to Parliament 2009 Volume Three
Existing Capacity in New South Wales
The table below provides a list of major existing New South Wales power stations with an installed
capacity equivalent to or larger than 30 megawatts:
Power station Location Owner Technology Capacity
(MW)
Major Existing NSW Government Power Stations
Mount Piper Central West Delta Electricity Steam/Coal 1,400
Vales Point Central Coast Delta Electricity Steam/Coal 1,320
Wallerawang Central West Delta Electricity Steam/Coal 1,000
Munmorah Central Coast Delta Electricity Steam/Coal 600
Broadwater North Coast Delta Electricity
(1)
BaGasse 30
Condong North Coast Delta Electricity
(1)
BaGasse 30
Eraring Lower Hunter Eraring Energy Steam/Coal 2,640
Shoalhaven Nowra Eraring Energy Hydro 240
Warragamba Sydney Eraring Energy Hydro 50
Bayswater Hunter Macquarie Generation Steam/Coal 2,720
Liddell Hunter Macquarie Generation Steam/Coal 2,080
12,110
(1) Joint venture between Delta Electricity Australia Pty Ltd and Sunshine Renewable Energy Pty Ltd
Non NSW Government Owned
Tallawarra Wollongong TRUenergy CCGT
(a)
435
Tumut Snowy Snowy Hydro* Hydro 2,116
Blowering Snowy Snowy Hydro* Hydro 80
Guthega Snowy Snowy Hydro* Hydro 60
Redbank Hunter Redbank Project Coal Tailings 145
Uranquinty Wagga Wagga Origin Energy OCGT
(b)
648
Cullerin Upper Lachlan Origin Energy Wind 30
Smithfield Smithfield Marubeni Gas Cogen 160
Appin Mine Illawarra EDL Group CSM
(c)
56
Tower Mine Illawarra EDL Group CSM
(c)
41
3,771
Total - Major existing NSW power stations 15,881
Source: Department of Industry and Investment NSW.
(a) CCGT = Combined Cycle Gas Turbine
(b) OCGT = Open Cycle Gas Turbine
(c) CSM = Coal Seam Methane
* Partly owned by New South Wales Government.
This is trial version
www.adultpdf.com
______________________________________________________________________ Electricity Industry Overview
Auditor-General’s Report to Parliament 2009 Volume Three _________________________________________ 15
Committed and Proposed Additional Capacity
Allocated and installed capacity increases as significant, new, committed and scheduled generation
capacity enters the NEM. The table below provides a list of major New South Wales power stations
that are either under construction or proposed and have an installed capacity of more than
30 megawatts.
The Department of Industry and Investment NSW has reported that new power plants with a
capacity of more than 16,000 megawatts (including over 3,800 megawatts from renewable sources)
are at various stages of development from concept to construction.
Power station Location Owner Technology Capacity
(MW)
Projects under construction
NSW Government Owned
Colongra Central Coast Delta Electricity OCGT 668
Non NSW Government Owned (1 project by 1 proponent) 141
Total - Projects under construction 809
Projects with development approval
NSW Government Owned
Bamarang Stage 1* Nowra Delta Electricity OCGT 400
Bamarang Stage 2 Nowra Delta Electricity conversion to
CCGT
Eraring Upgrade Lower Hunter Eraring Energy Coal 360
Tomago Newcastle Macquarie Generation OCGT/CCGT 790
Non NSW Government Owned (11 projects by 8 proponent) 3,180
Total - Projects with development approval 4,730
* Amendment being sought for 450MW, subject to transmission connection amendment.
Projects in the planning system
NSW Government Owned
Marulan Marulan Delta Electricity OCGT/CCGT 450
Mount Piper Power
Station Extension
Mount Piper Power
Station
Delta Electricity CCGT or Ultra-
supercritical
Coal 2,000
Munmorah Power
Station
Rehabilitation
Munmorah Power
Station
Delta Electricity Coal and/or
Gas
700
Bayswater B Bayswater Power
Station
Macquarie Generation CCGT or Ultra-
supercritical
Coal 2,000
Marulan Marulan EnergyAustralia OCGT/CCGT 350
Non NSW Government Owned (22 projects by 15 proponent) 4,110
Total - Projects in the planning system 9,610
Source: Department of Industry and Investment NSW; it is a summary of information contained in the AEMO 2009
‘Electricity Statement of Opportunities for the National Electricity Market’ where a full list of current New South
Wales generators registered with the AEMO can be found on the AEMO website.
This is trial version
www.adultpdf.com
Electricity Industry Overview ______________________________________________________________________
16 _________________________________________ Auditor-General’s Report to Parliament 2009 Volume Three
PERFORMANCE INFORMATION
Financial Performance
Revenue for the New South Wales electricity industry increased by $552 million to $11.3 billion
for 2009. Expenses, including tax, also increased, resulting in a $472 million decrease in profit after
tax.
The New South Wales electricity industry’s returns on equity and assets have fallen from the
previous year and are below the latest national electricity industry figures. Debt levels have
increased ahead of national figures.
Year ended 30 June NSW
2009
NSW
2008
National
Industry*
NSW
2007
Return on average equity (%) (a) 8.7 17.6 16.1 15.7
Return on average assets (%) (b) 6.0 9.4 11.5 8.7
Interest cover (times) (c) 2.4 3.3 4.3 3.5
Debt to equity ratio (d) 1.6 1.3 0.9 1.5
* Latest available July 2008 Productivity Commission Report, whole of electricity sector performance indicators.
Calculated as:
(a) profit after income tax expense divided by average equity.
(b) profit before tax and interest expense divided by average assets.
(c) operating profit plus interest and tax expense divided by interest expense.
(d) external debt divided by equity (net assets).
Profit in 2008 and 2009 does not include superannuation actuarial adjustments due to a change in accounting policy.
Targets for these key ratios are not set for the New South Wales electricity industry. However,
targets for individual agencies are detailed in the comment for each agency elsewhere in this
report.
The change in ratios from 2008 to 2009 reflects reduced earnings and increases in asset values.
There were significant unrealised losses associated with movements in the fair value of electricity
derivatives.
Generators and Distributors
Pre-tax profits of the distributors decreased marginally from $663 million in 2008 to $661 million in
the current year. Pre-tax profits from generators decreased from $977 million to $307 million for
the same period.
This is trial version
www.adultpdf.com
______________________________________________________________________ Electricity Industry Overview
Auditor-General’s Report to Parliament 2009 Volume Three _________________________________________ 17
The following table shows key financial ratios for generators and distributors:
Generators Distributors/Retailers
2009 2008 2007 2009 2008 2007
Return on average equity (%) (a)
5.6 29.7 30.5 12.4 14.5 13.6
Return on average assets (%) (b) 4.6 11.2 9.8 6.5 8.7 8.5
Interest cover times (c) 3.5 8.8 6.5 2.1 2.2 2.8
Debt to equity ratio (%) (d) 68.3 48.8 342.8 287.8 218.7 147.5
Net assets $m 3,850 4,036 538 3,533 3,937 5,003
Pre-tax net profit $m 307 977 484 661 663 844
Calculated as:
(a) profit after income tax expense divided by average equity.
(b) profit before tax and interest expense divided by average assets.
(c) profit plus interest and tax expense divided by interest expense.
(d) external debt divided by equity (net assets).
Profit in 2008 and 2009 does not include superannuation actuarial adjustments due to a change in accounting policy.
Generation
Financial performance achieved during the year was generally lower than the previous year. The
major factors affecting financial performance were:
increases in generating costs without equivalent increases in the average spot price for
electricity sales
significant unrealised losses associated with movements in the fair value of electricity
derivatives (unrealised gains were recorded in the previous year)
increases in employee entitlement provisions brought about by unrealised superannuation
actuarial losses for superannuation.
Overall debt levels for generators increased to finance construction activity. Delta Electricity
reported asset additions for the year of $484 million, largely representing construction costs
associated with the Colongra open cycle gas turbine and gas pipeline.
Distributors/Retailers
Overall financial performance for the year met or exceeded all financial performance targets. This
was largely due to lower than expected electricity purchase prices.
The increase in total assets was primarily due to increased capital expenditure programs for
distribution networks. Debt levels increased significantly to finance capital expenditure programs.
Profits after taxes while similar to the previous year, were affected by unrealised losses from the
fair value movements in electricity forward price contracts as well as increases in employee
entitlement provisions brought about by unrealised actuarial losses from superannuation. The
amounts paid as dividends by the distributors were lower than previous years.
This is trial version
www.adultpdf.com
Electricity Industry Overview ______________________________________________________________________
18 _________________________________________ Auditor-General’s Report to Parliament 2009 Volume Three
Transmission
TransGrid has generally performed well against its targets. It made a profit before tax of
$217 million in 2009 ($190 million in 2008) enabling it to return contributions to Government
totalling $187 million. These comprised a dividend of $120 million and taxation of $67.1 million.
Capital expenditure increased significantly on the completion of major capital projects including
the Western 500kV Development Project and the Wollar-Wellington 330kV Transmission Line
projects.
FINANCIAL INFORMATION
Distribution to Government
Electricity entities’ accrued distributions to the Government were $1.0 billion ($1.5 billion),
comprising $351 million ($524 million) of tax and $696 million ($972 million) of dividends.
After the restructure of the electricity industry, dividends and tax equivalents will continue to be
received from the Government owned entities.
Industry Debt
Borrowing costs for the year were $844 million compared to $789 million in the previous year. The
industry’s debt at 30 June 2009 was $14.8 billion ($12.1 billion at 30 June 2008). The table below
highlights the trend of debt levels, which have increased in line with the significant capital works
projects being undertaken.
2009
$m
2008
$m
2007
$m
Generators
Borrowing costs 123 125 125
External debt 2,631 1,971 1,864
Distributors
Borrowing costs 616 562 470
External debt 10,170 8,611 7,377
TransGrid
Borrowing costs 105 102 101
External debt 1,989 1,532 1,454
TOTAL BORROWING COSTS 844 789 696
TOTAL EXTERNAL DEBT 14,790 12,114 10,695
This is trial version
www.adultpdf.com
______________________________________________________________________ Electricity Industry Overview
Auditor-General’s Report to Parliament 2009 Volume Three _________________________________________ 19
OTHER INFORMATION
Asset Acquisition
In the 2008-09 State Budget, the electricity industry’s asset acquisition program was allocated
$3.5 billion ($2.9 billion), $660 million or 23 per cent above the 2007-08 budget. The focus has
been to replace or refurbish assets reaching the end of their economic life, to meet demand growth
and ensure network reliability and security. Upgrades to the high voltage electricity network across
New South Wales are also being undertaken to meet the growing demand for electricity.
Actual expenditure for 2009 was $3.6 billion, of which $3.0 billion or 82.4 per cent was spent on
the State’s distribution and transmission networks.
Electricity Tariff Equalisation Fund (the Fund)
The Fund enables retail electricity prices to be regulated without exposing retailers or the
Government to unacceptable financial risk.
The Fund manages the retailers’ exposure to the variability of wholesale electricity prices only for
the load that supplies regulated customers. At 30 June 2009, the Fund was $48.9 million in surplus,
($82,000 in 2008). This resulted from lower electricity wholesale prices during the year leading to
less reliance on the Fund from retailers.
The Fund’s transactions were:
Payments Generators Distributors/Retailers
2009
$m
2008
$m
2009
$m
2008
$m
Into the Fund 136 92 271 161
From the Fund 197 151 152 102
In the prior year, the New South Wales Government announced that the Fund would be abolished
by 30 June 2010. As part of the restructure of the electricity industry, ETEF will be phased.
Regulatory Pricing
The Australian Energy Regulator (AER) is the regulator for electricity distribution under a new
national regulatory regime. Its regulatory pricing role was previously undertaken by the New South
Wales Independent Pricing and Regulatory Tribunal (IPART). On 30 April 2009, AER made a five year
determination under the National Electricity Rules, which established the revenue requirements for
each electricity distributor from 1 July 2009 until 30 June 2014. The determination is estimated to
have increased the average retail customer’s annual electricity bill between $1.41 to $1.50
per week.
While no longer responsible for electricity distribution pricing, IPART continues to regulate
electricity prices for small retail customers choosing to remain on a regulated tariff in New South
Wales. The current price determinations were made on 1 July 2007 and affect the regulated retail
electricity tariffs and charges that apply from 1 July 2007 to 30 June 2010. The Minister for Energy
has IPART to review and determine the regulated retail electricity tariffs and charges that will
apply from 1 July 2010 to 30 June 2013.
This is trial version
www.adultpdf.com
Electricity Industry Overview ______________________________________________________________________
20 _________________________________________ Auditor-General’s Report to Parliament 2009 Volume Three
The AER is responsible for the regulation of transmission network charges. A determination for
TransGrid’s transmission services was issued on 28 April 2009, allowing a nominal return of
four per cent on the weighted average cost of capital. This determination covers a five year period
from 1 July 2009 to 30 June 2014.
The AER regulates the wholesale electricity market and is responsible for the economic regulation
of the electricity transmission and distribution networks in the national electricity market (NEM).
The AER is also responsible for the economic regulation of gas transmission and distribution
networks and enforcing the national gas law and national gas rules in all jurisdictions except
Western Australia.
The Australian Energy Market Commission (AEMC) is responsible for developing the Rules and
providing policy advice on how best to develop energy markets over time in relation to the NEM and
elements of natural gas markets.
BACKGROUND
All New South Wales public sector electricity entities are statutory State owned corporations.
The entities have common objectives of:
operating a successful business
protecting the environment
operating efficient, safe and reliable facilities for generating and distributing electricity and
other forms of energy
participating in the wholesale and retail markets for electricity and other forms of energy
(except for TransGrid).
The shareholders of the corporations are the Treasurer and the Minister for Finance.
INDUSTRY FINANCIAL TABLES
Following are abridged income statement and balance sheet tables for generators and distributors
for 2008–09 and the previous year. Comments on each entity and TransGrid follow this section.
This is trial version
www.adultpdf.com
______________________________________________________________________ Electricity Industry Overview
Auditor-General’s Report to Parliament 2009 Volume Three _________________________________________ 21
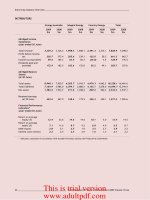
GENERATORS
Delta Electricity Macquarie
Generation
Eraring Energy Total
2009
$m
2008
$m
2009
$m
2008
$m
2009
$m
2008
$m
2009
$m
2008
$m
Abridged Income
Statements
(year ended 30 June)
Total revenue 1,004.6 1,016.9 1,217.2 1,162.4 644.3 745.2 2,866.1 2,924.5
Profit before income
tax 100.7 169.2 117.5 640.1 89.1 168.1 307.3 977.4
Income tax equivalent 25.4 55.6 35.3 191.7 26.7 50.8 87.4 298.1
Dividends paid and
provided 59.2 124.4 150.0 270.0 60.4 114.6 269.6 509.0
Abridged Balance
Sheets
(at 30 June)
Total assets 3,280.2 2,738.9 4,118.8 4,450.1 1,911.3 2,439.6 9,310.4 9,628.5
Total liabilities 2,280.6 1,841.9 2,233.7 2,650.3 945.3 1,100.4 5,459.6 5,592.6
Net assets/net
liabilities 999.6 897.0 1,885.1 1,799.8 966.0 1,339.2 3,850.8 4,035.9
Retained earnings
(at 30 June) - 48.5 139.2 252.9 5.5 42.4 144.6 343.8
Financial Performance
Indicators*
(year ended 30 June)
Return on average
equity (%) 7.9 20.4 4.5 51.5 5.4 13.6 5.6 29.7
Return on average
assets (%) 4.9 7.1 4.0 16.9 5.3 7.0 4.5 11.2
Debt/equity 1.3 0.9 0.4 0.5 0.5 0.3 0.7 0.5
Interest cover (times) 3.2 4.9 3.3 11.2 4.4 9.6 3.5 8.8
* Indicators calculated in accordance with standard formulas used by the Productivity Commission
This is trial version
www.adultpdf.com