báo cáo hóa học: " Development and validation of the Brazilian version of the Attitudes to Aging Questionnaire (AAQ): An example of merging classical psychometric theory and the Rasch measurement model" pptx
Bạn đang xem bản rút gọn của tài liệu. Xem và tải ngay bản đầy đủ của tài liệu tại đây (285.84 KB, 10 trang )
BioMed Central
Page 1 of 10
(page number not for citation purposes)
Health and Quality of Life Outcomes
Open Access
Research
Development and validation of the Brazilian version of the
Attitudes to Aging Questionnaire (AAQ): An example of merging
classical psychometric theory and the Rasch measurement model
Eduardo Chachamovich*
1,2
, Marcelo P Fleck
†1
, Clarissa M Trentini
†1
,
Ken Laidlaw
†2
and Mick J Power
†2
Address:
1
Post-Graduate Program of Psychiatry, Universidade Federal do Rio Grande do Sul, Brazil and
2
Section of Clinical and Health Psychology,
University of Edinburgh, UK
Email: Eduardo Chachamovich* - ; Marcelo P Fleck - ;
Clarissa M Trentini - ; Ken Laidlaw - ; Mick J Power -
* Corresponding author †Equal contributors
Abstract
Background: Aging has determined a demographic shift in the world, which is considered a major
societal achievement, and a challenge. Aging is primarily a subjective experience, shaped by factors
such as gender and culture. There is a lack of instruments to assess attitudes to aging adequately.
In addition, there is no instrument developed or validated in developing region contexts, so that
the particularities of ageing in these areas are not included in the measures available. This paper
aims to develop and validate a reliable attitude to aging instrument by combining classical
psychometric approach and Rasch analysis.
Methods: Pilot study and field trial are described in details. Statistical analysis included classic
psychometric theory (EFA and CFA) and Rasch measurement model. The latter was applied to
examine unidimensionality, response scale and item fit.
Results: Sample was composed of 424 Brazilian old adults, which was compared to an international
sample (n = 5238). The final instrument shows excellent psychometric performance (discriminant
validity, confirmatory factor analysis and Rasch fit statistics). Rasch analysis indicated that
modifications in the response scale and item deletions improved the initial solution derived from
the classic approach.
Conclusion: The combination of classic and modern psychometric theories in a complementary
way is fruitful for development and validation of instruments. The construction of a reliable
Brazilian Attitudes to Aging Questionnaire is important for assessing cultural specificities of aging
in a transcultural perspective and can be applied in international cross-cultural investigations
running less risk of cultural bias.
Background
The world is experiencing a profound and irreversible
demographic shift as older people are living longer and
healthier than ever before [1,2]. The world's older adult
Published: 21 January 2008
Health and Quality of Life Outcomes 2008, 6:5 doi:10.1186/1477-7525-6-5
Received: 18 June 2007
Accepted: 21 January 2008
This article is available from: />© 2008 Chachamovich et al; licensee BioMed Central Ltd.
This is an Open Access article distributed under the terms of the Creative Commons Attribution License ( />),
which permits unrestricted use, distribution, and reproduction in any medium, provided the original work is properly cited.
Health and Quality of Life Outcomes 2008, 6:5 />Page 2 of 10
(page number not for citation purposes)
population is estimated to show a threefold increase over
the next fifty years, from 606 million people today to 2
billion in 2050 [2]. In 2002, older people constituted 7
per cent of the world's population and this figure is
expected to rise to 17 per cent globally by 2050 [3]. The
most dramatic increases in proportions of older people
are evident in the oldest old section of society (people
aged 80 years plus) with an almost fivefold increase from
69 million in 2000 to 377 million in 2050 [4].
The World Health Organisation has described this demo-
graphic shift as a major societal achievement, and a chal-
lenge [5]. The increase in longevity is being experienced in
the developed and the developing world alike, but where
the developed world grew rich before it grew old, the
developing world is growing old before it has grown rich
[5]. While older people are living longer they are generally
remaining healthier with an increase in percentage of life
lived with good health. Nonetheless older people are still
seen as net burdens on society rather than net contribu-
tors to it [5,6].
Quantifying the raise of proportion of old adults in the
world population is relevant but insufficient. It is also
important to study the quality of this increase. The experi-
ence of ageing is primarily subjective and depends on sev-
eral factors, such as gender, physical condition,
environment, behavioural and social determinants, psy-
chological strategies and culture [5,7-10]. Culture is con-
sidered particularly relevant since it shapes the way in
which one ages due to the influence it has on how the eld-
erly are seen by a determined context [5]. Moreover, the
cultural aspects could be understood as a pathway
through which the external aspects would impact on age-
ing experiences.
Authors state that the vast majority of research and discus-
sion is done by young adults, whereas older adults would
be the most indicated to propose adequate ways of doing
it [11,12]. Bowling and Diepe argue that lay viewers are
important for testing the validity of existing models and
measures, since most of the discussion tends to reflect
only the academic point of view [13]. Even though inves-
tigating the ageing process has been a topic of increased
interest, there is a remarkable lack of well-designed and
tested instruments to assess it. The few developed so far
are either not specific to cover older adult's experiences or
have been exclusively carried out in developed countries
[14]. As far as we are aware, there is no instrument devel-
oped or validated in developing region contexts, so that
the particularities of ageing in these areas are not included
in the measures available.
To address this issue, the WHOQOL Group has developed
the AAQ instrument under a simultaneous methodology
[15], which ensured the participation of different centres
throughout the world (described in details in Laidlaw et
al, 2007) [14]. Briefly, the development process included
centres from distinct cultural contexts in qualitative item
generation, piloting and field testing. The applied meth-
odology followed the one established by the World
Health Organization Quality of Life Group [16,17] for the
development and adaptation of quality of life measures
and was used for the development of the WHOQOL-OLD
module [18,19].
Regarding development of new measures or validation of
existing ones, new approaches have been added to the tra-
ditional ones in order to expand the scale's properties
beyond reliability and validity [20]. The Rasch model has
been adopted since it permits that data collected may be
compared to an expected model and allows testing other
important scale features, such as reversed response thresh-
olds and differential item functioning.
The present paper aims to illustrate the potential combi-
nation of classical psychometric theory and Rasch Analy-
sis in the validation of the AAQ instrument in a Brazilian
sample of older adults.
Methods
Pilot study
The pilot study followed the methodology applied by the
WHOQOL Group in developing quality of life measures
[16,17]. This includes translation and back-translation of
the items and instructions by distinct professionals, as
well as semantic and formal examination by the coordina-
tor centre. Convenience sampling was used. The main
purpose of this stage was to collect data about the item
performance in order to produce a reduced version after
refinement. The combination of classical and modern
(item response theory) statistical analyses was used at this
point. A set of 44 items were tested in an opportunistic
sample of 143 subjects (age range 60–99, 59% female,
55% living alone, and 59% considered themselves subjec-
tively healthy). Patients with dementia, other significant
cognitive impairments and/or terminal illness were
excluded. Data collected at this stage were sent to the coor-
dinator centre to be merged with other centres' informa-
tion.
Statistical analyses were carried out to check the items
regarding missing values, item response frequency distri-
butions, item and subscale correlations and internal relia-
bility. No missing values were found in any of the 44
items in the Brazilian sample. The analysis of the pooled
international data indicated the need of item refinement,
which resulted in a 38-item version to be tested in the
field trial (see Laidlaw et al (2007) for more details on this
refinement stage) [14].
Health and Quality of Life Outcomes 2008, 6:5 />Page 3 of 10
(page number not for citation purposes)
Field trial
The Brazilian Field Trial was carried out with a non-prob-
abilistic opportunistic sample of 424 older adults
recruited from a university hospital, community houses
and nursing homes, elderly community groups, and their
own homes. Subjects were invited to take part of the study
and were asked to indicate other potential participants
(snowball strategy). Sampling was used according to pre-
vious stratification determined by subjective perception of
health status (50% healthy ones and 50% unhealthy
ones), gender (50% female) and age (60–69 years of age,
70–79 years of age and over 79 years of age). Subjective
perception of health status was assessed by the question
"In general, you consider yourself healthy or unhealthy?",
regardless of the objective health condition. Exclusion cri-
teria followed the ones used in the pilot study [14]. The
purpose of stratification was to ensure a minimal repre-
sentation in each subgroup to make further analyses pos-
sible.
This version comprised the 33 items from the Pilot Study
plus 5 items added by the Coordinator Centre (Edin-
burgh) in order to cover areas not sufficiently investigated
by the original format. These 5 items were translated and
back-translated and re-examined by the coordinator cen-
tre. In addition, subjects completed a socio-demographic
form and the Geriatric Depression Scale 15-item version
[21].
Statistical analysis
The combination of classical and modern psychometric
approaches was applied. The descriptive data analysis was
used to determine item response frequency distributions,
missing values analysis, item and subscales correlations
and internal reliability analyses. Exploratory and Con-
firmatory Factor analysis were performed to assess
whether the Brazilian data fit the international pooled
model. Finally, an IRT approach, in particular, that of the
Rasch model as implemented in the RUMM 2020 pro-
gram [22], was used to examine the performance of items
in the Brazilian dataset.
Results
Demographics
Table 1 describes the socio-demographic characteristics of
both the Brazilian and the international samples. Note
that the international sample is composed of the data col-
lected in all centers apart from Brazil. Chi-Square and
Independent T-tests were carried out to check statistical
differences across both samples. Following the detection
of differences in gender and educational level distribu-
tions, as well as in the mean depression level, an Inde-
pendent T-test was then run to compare means of the
three original AAQ factor scores (as described in Laidlaw
et al, 2007) [14] between the two samples. Briefly, the fac-
tor scores were calculated by summing the items included
Table 1: Socio-demographic characteristics of Brazilian and International Samples
Brazilian sample
n = 424
International sample
n = 5238
P
N (%) or M (SD) N (%) or M (SD)
Age 0.640
a
60–69 years old 173 (40.9) 1983 (39.1)
70–-79 years old 153 (36.2) 1948 (38.4)
80 or + years old 97 (22.9) 1141 (22.5)
Gender 0.013
b
Male 152 (35.8) 2191 (42.1)
Female 272 (64.2) 3014 (57.9)
Perceived Health Status 0.215
b
Healthy 286 (67.5) 3573 (70.8)
Unhealthy 138 (32.5) 1476 (29.2)
Marital Status 0.275
a
Single 29 (6.8) 275 (5.5)
Married 212 (50.0) 2688 (54)
Separated 30 (7.1) 397 (8)
Widowed 128 (30.2) 1371 (27.5)
Educational Level 0.000
a
Illiterated 7 (1.7) 138 (2.7)
Basic Level 165 (38.9) 1441 (28.3)
High School 110 (25.9) 1956 (38.4)
College 90 (21.2) 1449 (28.5)
Depression Level 0.041
b
GDS 15 3.99 (2.91) 3.68 (2.69)
a
Chi-Square test;
b
independent t test
Health and Quality of Life Outcomes 2008, 6:5 />Page 4 of 10
(page number not for citation purposes)
in each factor. Results indicate statistical differences in all
three factor scores, as well as in the overall score.
An Ancova analysis was then carried out to assess the
extent to which the interaction among depression, gender
and educational level was implied in determining differ-
ences in the scores (overall and each factor). Comparisons
between both samples were run to rule out the possibility
that differences in posterior factor analyses are due to dis-
tinct sample characteristics. Table 2 illustrates the Ancova
findings, indicating that the statistical difference in the
distribution of these variables between the two samples
does not interfere significantly with the score variations
[23].
Descriptives
Summary descriptives statistics for item analyses are
shown in Table 3. There is low frequency of missing values
across the items. Comparison of the missing frequencies
with the international dataset showed a lower frequency
in the Brazilian sample.
Exploratory Factor Analysis
Data were initially examined through Exploratory Factor
Analysis (Principal Component Analysis with Varimax
Rotation). Extraction strategy included selecting factors
with eigenvalues higher than 1 (and confronted to Monte
Carlo Parallel Analysis to control for spurious findings)
and scree plot observation [24-26]. The three-factor solu-
tion (indicated both by the Kaiser Rule plus Parallel Anal-
ysis and Scree Plot) accounted for 34.45% of the total
variance, whereas in the international sample the same
structure was responsible for 32.74%.
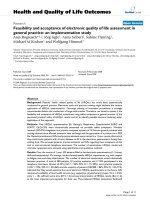
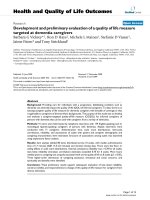
Figures 1 and 2 show the Scree Plot for both the Brazilian
and International Samples, indicating remarkable similar-
ities between both.
EFA findings were compared to the international ones.
There is a great similarity of the item loadings when com-
paring to the EFA run in the international dataset. Out of
38 items, only five (items 4, 5, 9, 15 and 31) loaded onto
different factors across both datasets. It is important to
notice that items 4 and 31 were not retained in the final
AAQ version since they lowered CFA results in further
international analyses.
The item reliability was analyzed through Cronbach's
alpha coefficients for the three subscales suggested by the
EFA. The Brazilian dataset showed coefficients of .863 for
the Subscale I (and .845 for the International dataset),
.804 for the Subscale II (.822 for the International sam-
ple) and .671 for the Subscale III (.701 for the Interna-
tional subscale).
The Item Total Correlation Analysis was then carried out
in distinct steps. Firstly, the Brazilian dataset was analyzed
to verify correlations below a critical cut-point (r = 0.40).
Secondly, the International dataset underwent the same
analysis. Thirdly, both findings were compared to verify
potential discrepancies. Six items in the Brazilian dataset
showed insufficient correlations (items 1,5,6,11,18 and
19). All these six items proved to show low coefficients in
Table 2: Ancova analyses including Educational level, gender and depression between Brazilian and International Samples
Interaction Means Br Means Int F P Partial Eta Sq.
Total score
Gender (m/f) 132.8/137.3 129.9/128.9 1.231 .267 .000
Ed Level (high/low) 139.3/134.5 132.1/128.3 18.96 .000 .004
Depression (≤5/>5) 141.2/119.4 134.4/110.8 2914.5 .000 .430
Gender × Ed Level × Depression - - .084 .773 .000
Factor I score
Gender 49.4/51.1 49.7/48.5 13.5 .000 .003
Ed Level 51.8/50.5 50.7/48.4 37.3 .000 .007
Depression 53.1/42.8 51.4/40.0 2233.7 .000 .352
Gender × Ed Level × Depression - - .001 .971 .000
Factor II score
Gender 50.3/52.7 49.9/49.8 .073 .787 .000
Ed Level 54.1/51.1 51.2/49.4 14.59 .000 .003
Depression 54.0/45.3 51.9/42.3 1746.4 .000 .301
Gender × Ed Level × Depression - - 1.25 .263 .000
Factor III score
Gender 33.0/33.4 30.2/30.3 1.80 .179 .000
Ed Level 33.3/33.3 30.2/30.9 2.29 .130 .000
Depression 34.0/31.2 31.0/28.7 304.9 .000 .067
Gender × Ed Level × Depression - - .321 .571 .000
Health and Quality of Life Outcomes 2008, 6:5 />Page 5 of 10
(page number not for citation purposes)
the International dataset too. Out of these, only item 18
remained in the final international AAQ version.
The Multi-trait Analysis Program (MAP) [27] was also
used to assess scale fit and internal reliability of the three-
factor model. Although six items loaded highly on other
factors besides the predicted one (9, 13, 21, 24, 33 and 34,
r ≥ .40 < .52), no items presented higher correlations with
an unpredicted factor than with the predicted one. Fur-
thermore, the directions presented by the MAP analysis
(correlation coefficients) were in accordance with the EFA
loadings.
Confirmatory Factor Analysis
CFA was carried out using AMOS 6.0 software [28]. First,
the 38 items three-correlated-factor solution was tested,
showing insufficient results (χ
2
= 1516.60 p < .001, df =
662, CFI = 0.79, RMSEA = 0.05). In order to verify the
impact of the correlation among factors, the uncorrelated
solution was then tested, showing further decrease in
model fit (χ
2
= 1943.63 p < .001, df = 665, CFI = 0.68,
RMSEA 0.06).
Following the steps adopted by the international develop-
ment of AAQ [14], the 31-item three-factor solution was
then assessed in order to verify potential improvement in
model fit. Similarly to the international findings, this
Table 3: Descriptive analysis of the set of 38 items in the Brazilian sample (n = 424)
Item content Mean SD MV(%) Distribution Skew Kurt
12345
1 People as old as they feel 3.42 1.18 0 7.3 19.3 13.7 42.9 16.7 52 76
2 Better able to cope with life 3.81 .781 0 .9 6.4 16.7 62.3 16.7 .781 1.411
3 Old age time of illness 2.24 1.015 0 25 42.2 17.5 14.4 .9 .554 549
4 Privilege to grow old 3.96 .93 0 1.9 6.6 14.6 47.6 29.2 96 .82
5 Interested in new technology 3.0 1.02 0 6.8 27.1 30.7 30.2 5.2 087 748
6 Interested in love 3.64 .881 0 2.4 8 25.2 52.4 12 766 .666
7 Old age is a time of loneliness 2.27 1.029 0 23.3 44.1 16.3 14.6 1.7 1.029 409
8 Wisdom comes with age 3.76 .872 0 1.4 8.7 18.2 55.9 15.8 .872 .664
9 Pleasant things about growing older 3.79 .826 0 1.2 7.8 16.5 60.1 14.4 .826 1.082
10 Old age depressing time of life 2.38 .997 0 19.1 41.5 22.2 16.5 .7 .997 752
11 Capacities and abilities decline with age 3.54 .870 .2 3.1 11.6 18.4 62.4 4.5 -1.145 .832
12 Important to take exercise at any age 4.26 .666 0 .7 1.4 4 59 34.9 .666 4.101
13 Growing older easier than I thought 3.41 .981 0 5.9 9.7 30.2 45.8 8.5 .981 .261
14 More difficult to talk about feelings 2.44 1.118 0 25.9 26.4 26.9 19.1 1.7 1.118 -1.073
15 More accepting of myself 3.10 1.097 0 10.1 18.4 29.2 35.6 6.6 1.097 674
16 I don't feel old 3.40 1.132 0 8.3 12.3 25.2 39.4 14.9 1.132 389
17 Old age mainly as a time of loss 2.17 1.137 0 38.4 23.3 22.2 14.6 1.4 1.137 970
18 Personal beliefs mean more as I grow older 3.61 1.18 0 9.5 8.5 16 44.8 21.5 868 051
19 My identity is not defined by my age 3.29 1.133 .2 11.6 9.9 25 44.3 9 1.133 333
20 More energy than I expected for my age 3.32 1.063 .2 6.9 16.1 23.3 44.7 8.7 1.063 408
21 Loss physical independence as I get older 2.80 1.156 0 18.2 20.3 28.5 29 3.8 1.156 -1.039
22 Physical health problems don't hold me back 3.25 1.176 .2 11.1 15.1 22.2 40.4 11.1 1.176 686
23 Unhappy with changes in physical appearance 2.16 1.128 .2 38.5 23.9 21.7 14.7 1.2 .496 979
24 More difficult to make new friends 2.08 1.162 0 44.8 19.6 18.6 15.8 .9 1.162 -1.030
25 Pass on benefits of experience 3.94 .821 .5 1.4 4.3 15.4 56.6 22.3 .821 1.618
26 Fear loosing financial independence 2.36 1.287 .2 38.1 17 19.9 21 4 358 -1.239
27 Time to do things that really interest me 3.43 1.00 .5 5.9 11.1 26.1 47.7 9.5 741 .109
28 Want continue doing work long as possible 3.58 1.23 .2 10.2 9.5 16.8 39.2 24.3 760 372
29 Worried I'll become a financial burden to family 2.23 1.28 .2 40.9 21.5 16.5 15.6 5.4 .636 855
30 Believe my life has made a difference 3.73 .847 .2 2.4 5.4 22.2 56.5 13.5 .847 1.369
31 Just as meaning now as always 3.73 .931 .5 2.4 9.7 16.8 54.5 16.6 882 .602
32 Don't feel involved in society 2.55 1.184 .5 25.9 21.5 25.5 24.3 2.4 1.184 -1.229
33 Want to give a good example 4.07 .735 .2 1.4 1.9 9.7 62.6 24.3 .735 3.619
34 I feel excluded because of my age 2.17 1.143 .2 39.2 20.8 25 13 1.9 1.143 928
35 Future fills me with dread 2.12 1.15 .5 41 23 21.8 11.1 3.1 .673 597
36 Health is better than expected for my age 3.38 1.122 .2 8.7 13 22 44.4 11.8 1.122 361
37 Keep myself fit and active by exercising 3.02 1.284 .5 17.1 17.8 23.7 29.1 12.3 1.284 -1.077
38 Important relationships become more satisfying 3.26 1.03 .2 7.8 12.3 34.5 36.9 8.5 499 195
Items in bold were retained in the international final version
Health and Quality of Life Outcomes 2008, 6:5 />Page 6 of 10
(page number not for citation purposes)
structure showed insufficient improvement (χ
2
= 1005.62
p < .001, df = 431, CFI = 0.82, RMSEA = 0.05). Again,
allowing interfactor correlation determines great model fit
improvement.
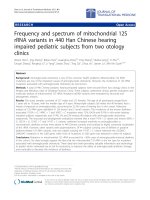
The final 24-item version was also tested in the Brazilian
dataset, according to the structure illustrated in Figure 3.
Remarkable improvements in model fit were shown (χ
2
=
645.19 p = .061, df = 249, CFI = .83, RMSEA = .06). The
comparison of these indexes to the international ones
indicate that the performance of the Brazilian final ver-
sion is similar (international findings present CFI = .84
and RMSEA = .05)
Discriminant validity
To assess the discriminant validity, a correlation between
each domain score and the depression levels was per-
formed. It was predicted that depression levels would be
negatively correlated to the three factors, and that the
physical factor should present a lower coefficient than the
two psychological factors. In fact, the correlation results
showed coefficients of r = 59 with psychosocial loss, r =
59 with psychological growth and r = 35 with physical
change.
Item Response Theory
Responses were tested according to the Rasch model for
polytomous scales [29]. Basically, the responses patterns
observed in data collected are tested against an expected
probabilistic form of the Guttman Scale [30]. Different fit
statistics are applied to determine whether the observed
data fits the expected model or not [31]. According to
Rasch measurement theory, a scale should have the same
performance, independently of the sample being assessed
(e.g., age or gender) [20,21]. Reverse thresholds, an over-
all Chi-Square test (indicating whether the observed data
differs from the expected model), item Chi-Square fit and
Item fit-residuals were tested. In addition to these fit
indexes, the item bias DIF (differential item functioning)
CFA model for the Brazilian sample (n = 424)Figure 3
CFA model for the Brazilian sample (n = 424).
1
10
14
17
21 24
32
34
1
Psychosocial Loss
Physical Changes
Psychological Growth
12
13
16
19
20 22
36
37
2 4 8
9
15 25
30
33
1
1
1.05 .85 1.20 .95 1.20 1.04
1.20
1.86
2.05 .79
2.25
1.27 2.14
2.63
1.49
.76
1.79 1.34 .99
.86
1.03
13
.07
14
.40
.09
Scree-Plot for the International Sample (n = 5238)Figure 1
Scree-Plot for the International Sample (n = 5238).
Scree-Plot for the International samp le
(n=5238)
8
6
4
2
0
Eigenvalues
3837
36
35
34
33
3231302928272625242322212019181716151413
12
11
10
9
8
7
65
4
3
2
1
Component Number
Scree-Plot for the Brazilian sample (n = 424)Figure 2
Scree-Plot for the Brazilian sample (n = 424).
Scree-Plot for the Brazilian sample
(n=424)
10
8
6
4
2
0
Eigenvalues
3837
36
35
34
33
323130292827262524232221201918171615141312
11
10
9
8
7
654
3
2
1
Component Number
Health and Quality of Life Outcomes 2008, 6:5 />Page 7 of 10
(page number not for citation purposes)
was verified, since it can determine decrease in model fit,
as well as measurement inappropriateness. The Person
Separation Index (PSI) was calculated for each factor as an
indicator of internal consistency reliability. In fact, the PSI
gives information comparable to the Cronbach's Alpha
from classic psychometric theory.
Table 4 presents the Rasch findings for the 24-item ver-
sion in its original form. At this stage, the 5-point Likert
response scale was maintained in its original form. As
mentioned above, the Chi-Square (both for the model
and for items separately) has the purpose of assessing
whether the data collected fits the expected theoretical
model. Thus, p values lower than 0.05 (corrected for Bon-
ferroni Multiple Comparisons) indicate that the first is
significantly different from the second, rejecting the
desired similarity [32]. Item residuals (a sum of item and
individual person deviations) also permit the assessment
of item fit, and values from -2.5 to +2.5 show adequate fit.
Results described in Table 4 show that 6 items (9, 14, 15,
19, 21 and 22) presented high residuals and/or item χ
2
scores significantly different from the expected. The
model fit for the three subscales also indicated misfitting.
Furthermore, 15 out of 24 items presented threshold dis-
orders, which suggests that the response scale is not ade-
quate and therefore contribute to the misfittings found
both in model and item levels.
Thus, rescoring items was carried out in order to improve
the model. Firstly, the category probability curves were
checked for each item. This approach allows the investiga-
tor to verify what response categories present disorders
and, thus, what specific categories should be collapsed to
improve the scale. Factors I and II demanded that catego-
ries two and three were merged, whereas factor III needed
categories 3 and 4 collapsed together.
Analysis using the new 4-point scale showed that Factors
I and III had remarkable improvement, with no model or
item misfittings. On the other hand, Factor II presented a
slight increased fit, but still insufficient (Model χ
2
= 87.12,
DF 48, P = 0.0004, PSI = .752). The second step was then
deleting the items responsible for the remaining misfit-
ting, namely items 19 and 22. The final model, then,
proved adequate fit. No reversed threshold or DIF
remained after rescoring and item deletion (Factor II).
Person Separation Indexes showed adequate scores for
Table 4: Rasch Analysis of the original 24-item final version including the 5-point Likert response scale
Content DIF Analyses
Item Model χ
2
Fit (df) P value Item χ
2
Fit Item Residual Rev Threshold Gender Age Depression
Subscale I 77.06 (40) .00003
7 3.08 1.01
10 12.77 -0.06
14 15.27 3.11
17 5.52 -0.60
PSI = .869 21 21.12 3.49
24 11.74 -1.25
32 10.70 1.61
34 6.38 -1.07
Subscale II 109.4 (48) .00001
12 10.57 -0.41 Uniform
13 6.57 .58
PSI = .807 16 4.65 .02
19 42.61 4.96 Uniform
20 11.79 -1.04
22 17.47 3.76
36 10.40 .66
37 5.34 .32
Subscale III 59.06 (48) .131
21.94.54
4 10.11 -0.31
PSI = .745 8 3.17 1.24
9 19.17 -2.05
15 9.01 3.43
25 1.34 .37
30 6.73 1.58
33 7.55 -1.73
In bold, item-residuals > 2.5 or item χ
2
fit with p < .05 corrected for Bonferroni Multiple Comparisons
Health and Quality of Life Outcomes 2008, 6:5 />Page 8 of 10
(page number not for citation purposes)
group comparisons (i.e., PSI > .70). Table 5 presents the
indexes for the final model.
Local independence of items and unidimensionality (two
Rasch assumptions) were assessed for the three final fac-
tors through two statistical tests. Item residuals correla-
tions were firstly analysed to check the potential presence
of local dependence (i.e., two items highly correlated in
the final model, so that the response to one would be
determined by the other). No correlations above 0.300
were found, which indicates local independence. Sec-
ondly, the pattern of residuals was analysed thorough
PCA of the residuals. The first PCA factor was divided into
two subsets (defining the most positive and negative load-
ings on the first residual component). These two subsets
were then separately fitted into Rasch Model and the per-
son estimates were obtained. An Independent T-test was
then carried out to detect potential differences between
the two subsets, which would indicate the presence of
multidimensionality in the model [20]. No significant dif-
ferences were found for the three factors of the scale (Fac-
tor 1, p = 0.051, Factor 2 p = 0.654, Factor 3 p = 0.090).
Discussion
The present paper had two complementary aims. First, it
had the goal of presenting a validated Brazilian version of
the Attitudes to Aging Scale. This version will permit that
aging experiences may be assessed in a distinct and poorly
investigated population. Furthermore, since aging is a
widespread phenomenon and is highly dependent on
socio-cultural aspects, it is extremely important that new
measures of this construct can be successfully applied in
different contexts. This would permit that adequate cross-
cultural investigations on attitudes to aging may be car-
ried out, including a valid and reliable instrument.
Secondly, this article aims to present a comprehensive
approach in validating new measures, which include both
classical psychometric theory and modern methodologies
together in a complementary way. While the traditional
approach provides relevant information regarding discri-
minant validity, missing values distributions and factor
analyses loading, Rasch analysis represents a powerful
tool in assessing item bias, threshold disorders and model
fit [20].
The Attitudes to Aging Questionnaire is a unique measure
of perception regarding aging, since it was developed
through a well-established international methodology
and based since its principle in focus groups run with
older adults [15-17,33]. Furthermore, it relies on the
assumption that the subjective perception of the aging
Table 5: Final 22-item version, including the rescored 4-point response scale
Content DIF Analyses *
Item Model χ
2
Fit (df) P value* Item χ
2
Fit* Item Residual* Rev Threshold Gender Age Depression
Subscale I 66.36 (40) .006
7 2.94 -0.276
10 9.33 -0.592
14 5.26 1.409
17 5.33 -1.734
PSI = .815 21 17.10 2.359
24 12.57 -2.492
32 6.09 1.00
34 7.70 -1.507
Subscale II 65.56 (42) .011
12 4.01 0.434
13 3.44 0.7
PSI = .750 16 3.51 1.239
20 9.20 -0.935
36 2.89 -0.439
37 9.07 -0.842
Subscale III 59.38 (48) .125
2 1.62 0.362
4 9.55 -0.534
PSI = .710 8 10.84 0.783
916.29-1.409
15 5.28 1.273
25 1.73 -0.242
30 6.88 1.175
33 7.16 -1.995
* all p non-significant for 0.05 after Bonferroni correction
Health and Quality of Life Outcomes 2008, 6:5 />Page 9 of 10
(page number not for citation purposes)
process is the ultimate construct to be measured, other
than objective indicators of physical activity or psycholog-
ical distress.
Regarding the psychometric performance, the Brazilian
version demonstrates good performance on both classical
and Rasch approaches. Despite the insufficient goodness-
of-fit indexes in CFA (CFI < .90), suitable discriminant
validity, and excellent fit indicators from Rasch analysis
suggested that the Brazilian version has satisfactory per-
formance and, thus, can be applied in different studies
reliably.
Another relevant issue regarding the findings of the AAQ
validation is the construct similarity between the interna-
tional sample and the Brazilian one. The three factors pro-
posed by the international analysis seem to be replicated
in the Brazilian dataset. Indeed, Psychosocial Loss, Physi-
cal Change and Psychological Growth represented the
theoretical ground upon which items were grouped dur-
ing the factor analysis phase. It could indicate that the per-
ception of aging did not differ significantly between the
two samples and raises the question of whether these sim-
ilarities remain or not in other different cultures. The
demonstration of cultural invariance of the core attitudes
to aging could lead to the possibility of reliable compari-
sons, which is needed by both researchers and policy mak-
ers.
It is suggested, however, that rescoring and two item dele-
tions could increase Brazilian scale fit and performance.
These potential alterations should not promote crucial
modifications in the scale format, since they can be made
during the statistical analysis phase and not necessarily in
the data collection stage. Since this is the first psychomet-
ric analysis of the Brazilian AAQ version, authors encour-
age the scale users to verify whether the 22-item version
maintains its superiority over the original 24-item format
in distinct samples, and then explicitly decide for one for-
mat.
Conclusion
The described findings support the hypothesis that the
development of a new international instrument according
to a simultaneous methodology, which includes an
intense qualitative initial phase, is adequate to generate
reliable cross-cultural measures. In conclusion, the Brazil-
ian version of the AAQ instrument is a reliable, valid and
consistent tool to assess attitudes to aging and can be
applied in international cross-cultural investigations run-
ning less risk of cultural bias.
Competing interests
The author(s) declare that they have no competing inter-
ests.
Authors' contributions
EC participated in the study design, data collection, statis-
tical analysis and drafted the manuscript; MPF partici-
pated in the study design, statistical analysis and helped to
draft the manuscript; CMT participated in the study
design and data collection; KL helped to draft the manu-
script and took part in the theoretical discussion; MJP par-
ticipated in the study design, statistical analysis and
helped to draft the manuscript. All authors read and
approved the final manuscript.
Acknowledgements
This paper was partially supported by CAPES, scholarship number PDEE
3604-06/3
References
1. Kinsella K, Velkoff VA: US Census Bureau, Series P95/01-1, An
Aging World: 2001. Washington D.C.: US Government Printing
Office; 2001.
2. United Nations: World Population Ageing: 1950–2050. Depart-
ment of Economic and Social Affairs, Population Division. New York:
United Nations Publications; 2001.
3. US Census Bureau: International Population Reports WP/02,
Global Population Profile: 2002. U.S. Government Printing
Office, Washington, DC; 2004.
4. United Nations: World Population Prospects: The 2002 revi-
sion. United Nations Population Division; New York 2003.
5. WHO: Active Ageing: A Policy Framework. World Health
Organisation Geneva 2002.
6. WHO: Ageing: Exploding the Myths. World Health Organisation
Geneva 1999.
7. Baltes , Smith : New frontiers in the future of aging: from suc-
cessful aging to the young old to the dilemmas of the fourth
age. Gerontology 2003, 49(2):123-35.
8. Levy Br, Slade MD, Kunkel SR, Kasl SV: Longevity increased by
positive self-perceptions of aging. J Pers Soc Psychol 2002,
83(2):261-270.
9. Knight BG: Psychotherapy with Older adults 3rd edition. Thousand
Oaks: Sage Publications; 2004.
10. Ebner NC, Freund AM, Baltes PB: Developmental changes in per-
sonal goal orientation from young to late adulthood: From
striving for gains to maintenance and prevention of losses.
Psychology and Aging 2006, 21:664-678.
11. Duhl LJ: Aging by one who is aging. J Epidemiol Community Health
2005, 59(10):816-7.
12. Boduroglu A, Yoon C, Luo T, Park DC: Age-related stereotypes:
A comparison af American and Chinese cultures. Gerontology
2006, 52:324-333.
13. Bowling A, Dieppe P: What is successful ageing and who should
define it? BMJ 2005, 331:1458-1551.
14. Laidlaw K, Power MJ, Schmidt S, the WHOQOL Group: The atti-
tudes to ageing questionnaire (AAQ): Development and psy-
chometric properties. Int J Geriatr Psychiatry 2007, 22:367-379.
15. Bullinger M, Power M, Aaronson NK, Cella DF, Anderson RT:
Cre-
ating and evaluating cross-cultural instruments. In Quality of
life and pharmacoeonomics in clinical trials Edited by: Spilker B. Hagers-
town, MD. Lippincott-Raven; 1996:659-668.
16. The WHOQOL Group: The World Health Organization qual-
ity of life assessment (WHOQOL): development and general
psychometric properties. Soc Sci Med 1998, 46:1569-85.
17. The WHOQOL Group: Development of The World Health
Organization WHOQOL-BREF Quality of Life Assessment.
Psychol Med 1998, 28:551-558.
18. Power MJ, Quinn K, Schmidt S, WHOQOL-OLD Group: Develop-
ment of the WHOQOL-old module. Qual Life Res 2005,
14(10):2197-214.
19. Fleck MP, Chachamovich E, Trentini C: Development and valida-
tion of the Portuguese version of the WHOQOL-OLD mod-
ule. Rev Saude Publica 2006, 40(5):785-91.
Publish with BioMed Central and every
scientist can read your work free of charge
"BioMed Central will be the most significant development for
disseminating the results of biomedical research in our lifetime."
Sir Paul Nurse, Cancer Research UK
Your research papers will be:
available free of charge to the entire biomedical community
peer reviewed and published immediately upon acceptance
cited in PubMed and archived on PubMed Central
yours — you keep the copyright
Submit your manuscript here:
/>BioMedcentral
Health and Quality of Life Outcomes 2008, 6:5 />Page 10 of 10
(page number not for citation purposes)
20. Pallant J, Tennant A: An introduction to the Rasch measure-
ment model: An example using the Hospital Anxiety and
Depression Scale (HADS). Br J Clin Psychol 2007, 46:1-18.
21. Sheik JI, Yesavage JA: Geriatric Depression Scale (GDS): recent
evidence and development of a shorter version. Clin Gerontol
1986, 37:819-820.
22. Andrich D, Lyne A, Sheridan B, Luo G: RUMM 2020 Perth: RUMM
Laboratory; 2003.
23. Field A: Discovering Statistics using SPSS. 2nd edition. SAGE,
London; 2005.
24. Kauffman JD, Dunlap WP: Determining the number of factors to
retain: a Widows-based FORTRAN-ISL program for parallel
analysis. Behav Res Methods Instrum Comput 2000, 32(3):389-95.
25. Zwick WR, Velicer WF: Comparison of five rules for determin-
ing the number of components to retain. Psychol Bulletin 1986,
99:432-442.
26. O'Connor BP: SPSS and SAS programs for determining the
number of components using parallel analysis and Velicer's
MAP tests. Behav Res Methods Instrum Comput 2000, 32(3):396-402.
27. Hays RD, Hayashi T, Carson S, Ware JE: User's guide for the Mul-
titrait Analysis Program (MAP). Santa Monica, CA. The Rand Cor-
poration, N-2786-RC 1988.
28. Arbuckle JA: Amos 6.0 User's Guide. In Amos Development Corpo-
ration Spring House, PA, USA; 2005.
29. Andrich D: Rating formulation for ordered response catego-
ries. Psychometrika 1978, 43:561-573.
30. Gutman L: The basis of scalogram analysis. In Measurement and
prediction Edited by: Stouffer SA. Princeton, NJ: Princeton University
Press; 1950.
31. Smith EV Jr: Detecting and evaluation of the impact of multi-
dimensionality using item fit statistics and principal compo-
nent analysis of residuals. Journal of Appl Meas 2002,
3(2):205-231.
32. Bland JM, Altman DG: Multiple significant tests: The Bonferroni
Method.
BMJ 1995, 310:170.
33. Guillemin F: Cross-cultural adaptation and validation of health
status measures. Scand J Reumathol 1995, 24(2):61-3.