Environmental Life Cycle Costing - Chapter 2 doc
Bạn đang xem bản rút gọn của tài liệu. Xem và tải ngay bản đầy đủ của tài liệu tại đây (227.94 KB, 18 trang )
17
2
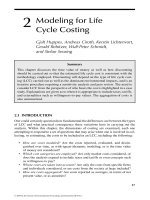
Modeling for Life
Cycle Costing
Gjalt Huppes, Andreas Ciroth, Kerstin Lichtenvort,
Gerald Rebitzer, Wulf-Peter Schmidt,
and Stefan Seuring
Summary
This chapter discusses the time value of money as well as how discounting
should be carried out so that the estimated life cycle cost is consistent with the
methodology employed. Discounting will depend on the type of life cycle cost-
ing (LCC) carried out as well as the dominant environmental impacts, and is an
iterative procedure requiring a sensitivity analysis and peer review. The need to
consider LCC from the perspective of who bears the cost is highlighted in a case
study. Explanations are given as to when it is appropriate to include taxes, tariffs,
and externalities such as willingness-to-pay values. The aggregation of costs is
also summarized.
2.1 INTRODUCTION
One could certainly question how fundamental the differences are between the types
of LCC and what practical consequence these variations have in carrying out the
analysis. Within this chapter, the dimensions of costing are examined, each one
attempting to respond to a set of questions that may arise when one is involved in col-
lecting, or estimating, the costs to be included in an LCC, including the following:
How are costs modeled?r Are the costs reported, evaluated, and distin-
guished over time, as with (quasi-)dynamic modeling, or is the time value
of money not considered?
Which cost categories are employed?r Are only market costs considered, or
does the analysis expand to include taxes and tariffs or even concepts such
as willingness to pay?
Whose costs are taken into account? r Are only the costs from specic rms
and individuals considered, or are costs from the society at large included?
How are costs aggregated?r Are costs reported as averages, in terms of net
present value, or as annuities?
© 2008 by the Society of Environmental Toxicology and Chemistry (SETAC)
18 Environmental Life Cycle Costing
Each of the aforementioned questions relates to 1 of the 4 basic dimensions of LCC
and will be elaborated upon in the following sections. Throughout this chapter, case
study boxes based on real, and partly hypothetical, washing machine LCC are used
to demonstrate the outcomes of different methodological choices.
2.2 COST MODELS
Cost modeling is characterized by how the time value of money is considered and
the degree of nonlinearity relating outputs to inputs. For example, the LCA model,
as a whole, is linear homogeneous or homogeneous to degree 1, implying that twice
the input produces twice the output (as is the case for mass and energy balances in
general, as long as no nuclear reactions are involved). In economic theory this rela-
tion is typied as “constant returns to scale.” In sophisticated cost modeling, neither
of these characteristics is justied and required. First, there are modeling types that
use exponential relations and still are linear homogeneous, such as Cobb-Douglas
production functions. Second, models may use linear relations but do not exhibit
constant returns to scale, like most optimization models. Furthermore, the majority
of most nonlinear relations will also lead to nonlinear homogeneous models, with
increasing or decreasing returns to scale or more complicated relations. The charac-
teristics of the different models that can be employed in LCC are summarized in the
following discussion.
Steady-state models are conceptually the simplest ones, owing to the fact that
they lack any temporal specication and assume all technologies remain constant in
time. Most LCA applications are steady-state models, as are substance ow analysis
(SFA) and input–output analysis (IOA) models. This is the approach employed in
environmental LCC (Huppes et al. 2004).
Quasi-dynamic models are time series that are exogenously determined. They
are a compromise between steady-state and dynamic models. These models assume
that most of the variables remain constant in time, though they allow one or more
of them to vary. Most CBA and some IOA models are quasi-dynamic. Conventional
and societal LCC are, generally, quasi-dynamic.
Dynamic models explain the development of variables over time, with past values
determining future ones. For example, economic models may predict investments in
the following year based on the prots of this year. In contrast to quasi-dynamic
models, these values are derived endogenously. Macroeconomic models often are
dynamic models.
For conventional and societal LCC, the use of quasi-dynamic models makes
it difcult to directly compare the results with steady-state environmental meth-
ods (i.e., LCA). Therefore, environmental LCC is primarily set up as a steady-state
method, designed to be compatible with LCA. Some aspects of societal assessment,
the 3rd pillar of sustainability, may be linked to the steady-state type of modeling
as well, though highly relevant items such as income distribution and unemploy-
ment rates have a dynamic background. A clear disadvantage of the steady-state
approach to LCC is for rms in that the quasi-dynamic approach (i.e., conventional
LCC) is the relevant way of comparing the cost of options or the attractiveness of
© 2008 by the Society of Environmental Toxicology and Chemistry (SETAC)
Modeling for Life Cycle Costing 19
investments. However, surveys indicate (see Chapter 6) that some corporations are
coupling steady-state environmental assessments and quasi-dynamic LCC.
Summary: Temporal Modeling Is a Key Parameter in LCC
Effectively, the modeling choice is between steady-state models, linked to envi-
ronmental LCC and quasi-dynamic models, consistent with conventional and
societal LCC. As life cycle assessment is steady state in nature, environmental
LCC is the most compatible of the 3 methods to be employed in sustainability
assessment.
2.3 COST CATEGORIES
External costs either are market based or resemble other money ows connected to
a product’s life cycle (e.g., taxes and tariffs). These should be distinguished from the
cost of external effects. Such externalities (see Chapter 4) include concepts such as
willingness to pay (for avoiding these effects) or the cost of preventing the effects.
Though it may seem like a nuance, external costs are part of the product system and
should be considered in all types of LCC, while externalities are extremely uncertain
to be monetized in the decision-relevant future and are, therefore, only considered
in societal LCC.
2.3.1 COST,REVENUE, AND BENEFITS
Consider the following example as an illustration. In multifunctional renery pro-
duction, LCA has 2 options to deal with product ows coming out of the renery:
to split up the renery virtually, as by economic (or other) allocation, or to subtract
the co-products, as by substitution. In cost terms, the economic allocation has an
easy equivalent in cost allocation as applied in managerial accounting (cost man-
agement; Rebitzer 2005). The equivalent of LCA-type substitution is subtracting
the cost of some other production process having the same output. This method
is, at times, applied in national (macroeconomic) accounting, though never in
cost management. The substitution equivalent does not exist in LCC. The method
applied is that of cost allocation, indicating which part of total cost, including
prots, is due to each of the products sold, of course reckoning the cost due to
just 1 of the products rst. This example illustrates that there are good reasons
to explicitly treat both cost and revenues in LCC and to specify how the revenues
are dealt with. There seem to be no fundamental problems involved in adding the
revenues in the analysis, as long as it is clear how it is being carried out. For very
practical reasons, revenues are frequently left out, if they may be assumed to be
rather identical for different product systems being compared, or if they are very
small as compared to costs.
© 2008 by the Society of Environmental Toxicology and Chemistry (SETAC)
20 Environmental Life Cycle Costing
2.3.2 MARKET PRICES AND VALUE ADDED
In national accounting the national product may be determined based on market
prices or factor costs. The total of both is the same, though the means of arriving
at the total are quite different: adding all expenditure on products, leaving out all
intermediate sales, or adding up all factor costs, as payments for capital and labor.
In LCC these approaches may be combined. However, under such circumstances
it should be clear which method is employed where. From the point of view of a
certain rm — and quite similar situations apply to some public organizations —
costs are reected in the prices paid for products acquired and in the cost for pro-
viding capital goods and labor. When comparing the sales of a rm with the costs
of products acquired by it, the difference is the gross value added: that is, the sum
of labor costs and capital costs, including prots (excluding value-added tax [VAT]
and other taxes). This value added may be left gross, or may be made net, after
deduction of what is set aside to compensate for the wear and tear of the capital
goods (i.e., depreciation). Capital goods acquired hence should not be lumped to
other goods acquired, but should be covered by some measure of depreciation. The
cost of borrowing (loans, leases, etc.) should be included as well, as should prots,
which remain after deduction of the cost of borrowing. The treatment of depre-
ciation and taxes is a delicate subject, as there are many conventions in different
countries. Furthermore, conventional LCC often employs direct cash ows (i.e.,
without depreciation). In national accounting, these difculties have been resolved,
one way or another.
One way to avoid the aforementioned difculties in LCC is by not detailing cost
from a rm’s point of view. Each product system, close to its kernel process, has
a limited number of products together delivering the service(s) as specied in the
functional unit. Taking the (expected) market prices of just these products, including
the waste disposal services implied in using the product, would provide the total life
cycle cost. This simple method has 1 disadvantage in that it does not give insight
regarding which factors determine costs, essentially making sensitivity analysis
impossible. Furthermore, if alternative technologies are involved that are not yet on
the market, it is not possible to use market prices. Then, more detailed in-rm type
cost functions are to be used as models for specifying the cost.
Summary: Accounting and Financial Definitions
The cost of purchases, in market prices, reects the total upstream gross value added.
Adding the gross value-added gures of the rm gives the total value of output of
the rm, its sales, as the cost of purchases of the next actors in the chain. The gross
value added is the sum total of labor cost and capital cost, including deprecia-
tion and prots. LCC requires rigorous accounting of cost categories (even if not
detailed) and transparent denitions.
© 2008 by the Society of Environmental Toxicology and Chemistry (SETAC)
Modeling for Life Cycle Costing 21
2.3.3 FOUR LEVELS OF COST CATEGORIES
Four levels of cost categories may be distinguished: economic cost categories, life
cycle stages, activity types, and other cost categories (see Table 2.1). When making an
LCC analysis, these 4 levels are best decided on sequentially. In particular, and when
applied in a decision-oriented context, the 3rd and 4th levels are most relevant.
TABLE 2.1
Overview of cost categories
Level Cost category
1st level: economic cost
categories
Budget cost, market cost, alternative cost, and social cost
2nd level: life cycle
stages
Knowledge development (including R&D), primary production (materials,
energy, etc.), components production, manufacturing, use, and end-of-life
management
3rd level: activity types Development, extraction, purchase, sales, reuse, and management
Design, agricultural production, schooling, public relations, recycling, and
administration
Research, testing, packaging, transport, maintenance, waste processing, and
infrastructure
4th level: other
(exemplary) cost
categories 1
Conventional cost Transfer payment Environmental cost
(internal)
Personnel and equipment
costs, rents, and prots
Direct taxes Damage prev. costs
Materials disposal,
communication costs, and
investments
Indirect taxes Wastewater
treatment costs
Food production, services,
electricity, and ofce cost
Excises and levies Exhaust gas
reduction costs
Building costs, warranties,
infrastructure costs, and
depreciation
Subsidies Rehabilitation costs
4th level: other
(exemplary) cost
categories 2
Management: material cost,
energy cost, personnel cost,
machinery cost, transport
cost, disposal cost, revenues,
and end-of-life value
Supplementary: service cost,
tooling cost, storage cost,
taxes, warranties,
assurances, infrastructure
cost, building cost,
settlement cost, control cost,
nancing cost, and
appliance cost
— Residual value
© 2008 by the Society of Environmental Toxicology and Chemistry (SETAC)
22 Environmental Life Cycle Costing
This 1st level corresponds roughly with the choice on the family of LCC, as is
documented in the following summary box.
Summary: Relevance of Cost Categories
Budget cost and market cost are relevant for conventional LCC. Alternative cost
and social cost are the prime cost types for societal LCC, whereas transfer pay-
ments (taxes and subsidies) are not considered. For environmental LCC, a choice
has to be made. In principle, the full systems point of view suggests an alterna-
tive costs type, including the net of transfer payments from and to governments.
However, for the practical purposes of the majority of business- and consumer-
focused analyses, market costs are likely adequate.
The 2nd level has to do with the completeness of the system. In principle, all
stages in the life cycle should be included. However, from the point of view of
an individual rm, the sum of its internal cost, as value plus its costs of external
purchases of products (covering both goods and services, including waste manage-
ment services), equals its cradle-to-gate cost level and hence does not correspond
to full life cycle costs that would generally include use, transport, and end-of-life
expenditures.
The 3rd level reects the life cycle stages in more detail and may especially be
useful to track overheads, quite often neglected in LCA systems specication, though
possibly coming in view when a hybrid approach is applied, using environmentally
extended input–output data (Suh et al. 2004; Suh and Huppes 2005) for background
data. The activity types distinguished in Table 2.1 may easily be expanded system-
atically using the EU nomenclature as developed in NACE (Nomenclature Générale
des Activités Économiques dans les Communautés Européennes) and its US equiva-
lent, NAICS (North American Industry Classication System), both involving sev-
eral hundred well-described activity types. These classications of activity types
have a global origin, being based on the International Standard Industrial Classica-
tion (ISIC) classication of the United Nations.*
In the 4th level, the most specic cost categories are distinguished. Case Study
Box 2 illustrates the cost categories discussed herein.
* The United Nations Statistics Division (UNSD) has developed a standard product classication as
well, as applied in make-and-use tables, the HS (Harmonized System), and has developed a nomencla-
ture for nal consumption by private consumers and governments, Classication of Individual Con-
sumption according to Purpose (COICOP). For a related survey, see United Nations Statistics Division
(2007). For environmental cost, the European Classication of Environmental Protection Activities
and Expenditure (CEPA) can act as a guide.
© 2008 by the Society of Environmental Toxicology and Chemistry (SETAC)
Modeling for Life Cycle Costing 23
Case Study Box 2: Cost Categories
This case study box illustrates the cost categories chosen to calculate an envi-
ronmental LCC for a washing machine. Budget costs and market costs are
considered for all life cycle stages (manufacturing, use, and EoL), whereas the
conventional cost categories and some transfer payments are allocated to the
actors of each life cycle stage.
For the R&D phase, only the labor costs of the washing machine design-
ers are taken into account. The preproduction phase is considered via all costs
for the materials and components necessary to produce the washing machine,
whereas production costs such as electricity, gas, water, and so on are added for
the production stage.
Private households have to regard the purchase costs for the washing machine
and operating costs such as water, electricity, and detergents. In this example, it
is assumed that there are no direct end-of-life costs for the consumer due to take-
back regulations (disassembly costs minus reuse revenues, or recycling costs
minus secondary material revenues).
Amount Cost per unit Costs
Appliance Manufacturing
Research and Development
Labor 0.5 hours 40 € / hour 20 €
Components or raw material production
Steel 26.5 kg 1.5 € / kg 39.75 €
Concrete (weight) 1 piece 10 € / piece 10.00 €
Carboran 40% 12.0 kg 1.8 € / kg 21.60 €
Plastics (mainly polypropylene [PP]) 6.0 kg 1.1 € / kg 6.60 €
Aluminum 4.0 kg 1.8 € / kg 7.20 €
Chipboard 2.5 kg 0.9 € / kg 2.25 €
Gray cast iron 2.0 kg 1.2 € / kg 2.40 €
Glass 1 piece 16 € / piece 16.00 €
Copper 1.0 kg 1.9 € / kg 1.90 €
Electronic components 1 piece 75 € / piece 75.00 €
Cotton with phenolic binder 0.5 kg 35.0 € / kg 17.50 €
Cable 1.5 m 1.5 € / m 2.25 €
Other materials 2.0 kg 7.0 € / kg 14.00 €
Sum 216.45 €
Production
Electricity 50.0 kWh 0.16 € / kWh 8 €
Gas 40.0 kWh 0.05 € / kWh 2 €
Water and wastewater fee 0.09 m
3
3.5 € / m
3
0 €
Waste treatment 7 kg 4 € / kg 28 €
(continued)
© 2008 by the Society of Environmental Toxicology and Chemistry (SETAC)
24 Environmental Life Cycle Costing
Amount Cost per unit Costs
Other services — — 15 €
Labor (other) 1.3 h 25 € / h 33 €
Depreciation and tax — — 20 €
Sum 106 €
Total 342 €
Private Household
Purchase washing machine
1 500 € 500 €
Water 70.17 m
3
4 €/m
3
281 €
Electricity 1117 kWh 0.18 €/kWh 201 €
Detergents 183.84 kg 1.76 €/kg 324 €
End-of-life costs 1 0.00 € 0 €
Sum 1,306 €
Maintenance
Maintenance of washing machine
1 10 € per annum 110 €
Sum 110 €
End of life
Collection 1 8 € 8 €
Disassembly 1 16 € 16 €
Disassembly revenues (reuse) 1 –48 € –48 €
Recycling 1 5 € 5 €
Recycling revenues 1 –15 € –15 €
Sum –34 €
Source: Real case study (main cost categories, 3rd and 4th level, from Rüdenauer and Grießhammer
[2004]; Kunst [2003]) with hypothetical extensions (some cost categories of manufacturer
and end-of-life service provider).
2.3.4 COST ESTIMATION
Cost estimation is, quite basically, “the act of approximating the cost of something
based on information available at the time” (US Department of Defense 1999). For
LCC applications, the “something” may be the product or product components for a
certain part of the life cycle or actions and processes in the life cycle such as human
labor. Cost estimation implies an assessment of the value or price something has.
In comparison to a measurement or calculation of material ows, as is needed for
example in an LCA that forms part of an environmental LCC, there are 2 important
differences: rst, the value will to some degree be volatile; and second, as far as
internal costs are concerned, the value will to some degree be publicly available via
market prices.
In conventional LCC, a top-down and a bottom-up approach are often used in
parallel for cost estimation (e.g., Kerzner 2001). In the top-down approach, costs are
derived from an analysis of major components of the product and/or its life cycle.
In the bottom-up approach, costs are aggregated from various sources. The variety
of cost estimation methods may be classied into informal and formal methods.
© 2008 by the Society of Environmental Toxicology and Chemistry (SETAC)
Modeling for Life Cycle Costing 25
Informal methods include expert judgment, analogy, estimation based on relative
information, rule-of-thumb methods, the use of engineering standards, and paramet-
ric cost estimation.
In parametric cost estimation, the aim is to model a unit (or a “something”) in a
way that the costs for this unit depend on parameters that can be assessed (more) eas-
ily, and with a better estimation quality (Heemstra 1992; US Department of Defense
1999). One example for a parametric cost model would be the effort in person-hours
needed for a product development process, based on the type of company, the size of
the team, and the “novelty” of the task. These person-hours will then be transformed
to cost data by multiplying them with hourly wages.
More sophisticated cost models take into account the nonlinearity of costs. For
example, Barry Boehm’s famous constructive cost model (COCOMO; Boehm 1981)
is, in its basic form, effort = C * size
M
, where “effort” = person-months needed for a
software project, “size” = number of persons in the project group, and C and M are
always greater than 1 (for best-practice projects, C = 3.6 and M = 1.2). For environ-
mental LCC, literature on cost estimation is scarce, and costs will often be assessed
based on (linear) price–amount relationships. Societal LCC studies may use moneti-
zation techniques such as willingness to pay or contingent valuation.
2.4 COST BEARERS
Costs involve obligations to pay (or be paid by) legal entities that are involved, includ-
ing rms, governments, and public bodies. Therefore, the term “cost bearers” refers
to those who have to pay the costs that accrue to them. Firms and other organizations
may further break down the units that bear costs, for example in divisions, ministries,
and associations, as for wastewater management. The duality of cost specication is
directly related to who is specied as the cost bearer. A limited number may sufce for
total cost specication in the system. The internal cost of these few cost bearers, and all
external costs covering their (not overlapping) upstream costs, will be sufcient.
A more encompassing system denition will imply a larger group of activities
and, therefore, a larger number of cost bearers. From the point of view of a particular
rm, a distinction will be made between downstream proceeds toward the consumer
and beyond, and upstream costs in supplying materials and parts (e.g., to the manu-
facturer). These downstream and upstream costs are related to the life cycle of the
product: “upstream” means earlier in the life cycle, whereas “downstream” means
later in the life cycle, relative to some reference activity. For instance, upstream from
a convenience store are producers, while downstream are consumers and waste-recy-
cling and -processing companies. Eight types of cost bearers may be distinguished,
as shown in Table 2.2.
The costs of a producer are essentially the costs of manufacturing a good or
service. Costs from producers upstream are counted as long as they are reected
in the price of the purchased goods used as inputs. This may not always be clear in
the case of combined production (several products being produced together) when
cost allocation rules as applied may differ and may be inappropriate. Related to the
producer is the supply chain, which can include all actors from extraction to retail (if
the producer is a retailer). For a supply chain, all costs upstream will be taken into
© 2008 by the Society of Environmental Toxicology and Chemistry (SETAC)
26 Environmental Life Cycle Costing
account, but downstream costs are taken into account only if EoL costs are part of
the company’s costs.
Two additional related cost bearers are owners and users. An owner may also
be a user, while a user may not be the owner. All upstream costs, reected in the
price of the good or service (either rent or purchase price), will be included. Fur-
thermore, from a full life cycle perspective, downstream costs would have to be
included as well, even if not paid by the rms from whose perspective internal
costs are being dened.
Groups may be combinations of persons and organizations relevant in a certain
situation. One example is the group of users and suppliers of a service, as those
involved in car leasing. Groups, as a exible category, may overlap with any of
the other categories. A specic group concerns all actors involved in the life cycle
stages of a good or service, from extraction and production to use and disposal;
that is the life cycle of the product, where all downstream and upstream costs are
analyzed, including cost such as infrastructure overheads and public waste man-
agement. This, again, is the full life cycle. It is clear that all partial systems, not
covering the full cycle, lead to unclear system boundaries. Unclear denitions of
internal and external costs may easily lead to overlapping or missing out costs.
Internal and external costs, and the means to categorize and use them, are dis-
cussed at length in Chapter 4.
The last 2 groups of cost bearers are a country’s society and the global society.
The country’s society excludes the costs abroad. The view of global society, related
to cost bearers, is the most relevant one from a sustainability point of view, since
most cost effects (and environmental impacts) do not stop at the border. Case Study
Box 3 illustrates the different perspectives discussed herein.
TABLE 2.2
Overview of cost bearers and relevant costs covered
Cost bearer
Upstream cost
(cost of purchases)
Internal cost
(value added)
Downstream cost
(not subtracting
proceeds of sales)
Supply chain Price All None*
Producer Price All None*
1st to nth owner and/or user Price All Residual value
Last owner and/or user Price All Disposal fee, if any
Group** Almost all All Almost all
Life cycle (all stakeholders) All All All
Country’s society All All All
Global society All All All
*
Only cradle-to-gate costs, unless EoL costs, are part of the company’s costs.
**
For example, waste collectors and recyclers, excluding consumer costs for separate collection.
© 2008 by the Society of Environmental Toxicology and Chemistry (SETAC)
Modeling for Life Cycle Costing 27
Case Study Box 3: Perspectives
Starting from the complete life cycle cost result for the idealized washing machine,
this case study box illustrates life cycle costs from different perspectives for sys-
tems of various persons or groups. In this example, the producer is responsible
for the production costs, the maintenance costs for the 1st two years of the use
phase (warranty), and the end-of-life costs except for collection (here, disassem-
bly and/or recycling costs minus reuse and/or secondary materials revenues),
which result in 320 € over 13 years. The consumer (private household) bears the
costs of the use phase, except the maintenance costs for the 1st two years as the
warranty usually covers this period. Similarly, the end-of-life costs are shared
according to the WEEE (waste electrical and electronic equipment) directive by
the producer (disassembly and/or recycling) and public bodies (collection) (Euro-
pean Union 2003a). Next to these conventional costs, monetized externalities could
be considered in a societal LCC (e.g., environmental damage costs for emissions)
that are borne by the government and society today and in the long-term future.
The environmental LCC for this washing machine considers end-of-life rev-
enues and results in 1216 €, comprising the costs from the perspective of the
producer (320 €) and from the perspective of the private household (896 €).
Externalities and other costs, like collection costs for old washing machines, are
costs covered by the government and society, resulting in an additional 575 € for
a societal LCC (1791 €).
Please be aware that prices, hence individual prots or even losses, are not con-
sidered in this idealized calculation and have to be added in any real-life study.
Years Production Use Maintenance End of life Externalities
AB C D E
1 342 € — — — 103 €
2 to 12 — Water:
25.50 €
per annum
10 €
per annum
— 42.20 €
per annum
Electricity:
18.30 €
per annum
Detergent:
29.50 €
per annum
13 — — — Collection:
8 €
0 €*
Disassembly
and/or
recycling:
21 €
(continued)
© 2008 by the Society of Environmental Toxicology and Chemistry (SETAC)
28 Environmental Life Cycle Costing
Years Production Use Maintenance End of life Externalities
13, cont’d Reuse and
secondary
materials
revenues:
–63 €
Total, without
discounting
342 € 806 € 110 € –34 € 567 €
Note: Years: 1 = production, 2 to 12 = 11 years of use, and 13 = end of life.
Years Producer Private households Government/society
A+C+D B+C D+E
1 342 € — 103 €
2 to 12 20 € 896 € 464 €
13 –42 € — 8 €
Total 320 € 896 € 575 €
Note: Years: 1 = production, 2 to 12 = 11 years of use, and 13 = end of life.
*
End-of-life costs and savings related to externalities are assumed to balance each other.
Source: Real case study (consumer perspective from Rüdenauer, Grießhammer 2004) with
hypothetical extensions (perspectives of manufacturer and for government and
society).
2.5 UNCERTAINTIES AND INCONSISTENCIES IN COST DATA
Inconsistencies in the costs used in LCC can relate to the denition of the cost col-
lection methods, geographical differences, exchange rates, as well as condential
information, among others.
Finally, should the costing be carried out for publicly available comparisons
(as in ISO 14040/44 [2006] for environmental comparative assertions), some inter-
nal data are unlikely to be employed and the back-calculation of costs from market
prices and value added is an approximation at best, though required.
2.5.1 DEFINITIONS OF COST COLLECTION METHODS
The issue of denitions arises because costs may be dened in different ways. What
really is accounted for when a cost is given for a certain good depends on the cost
management and accounting system of the reporting party. It further depends on
whether the cost is to be used only internally or also for communication outside the
organization.
The accounting system: There are several diverging accounting systems, for
example the generally accepted accounting principles (GAAP) used in the
United States, Canada, or the United Kingdom; or the international nancial
reporting standards (IFRS), used in many parts of the world, including the
European Union, Hong Kong, Australia, India, Russia, South Africa, and
Singapore. Companies that need to publish their business reports follow one
© 2008 by the Society of Environmental Toxicology and Chemistry (SETAC)
Modeling for Life Cycle Costing 29
or another accounting system, by legal requirements. Differences between
different accounting systems possibly affect the cost given for a certain good
or product, the allocation of costs to different cost drivers, and the total of
costs allocated.
The type of cost reported: It is common practice in many companies to have
an internal cost management system that reports, for example for the com-
pany’s control system, costs independently from legal requirements. The
company-internal system is not regulated in any way; there are only com-
mon rules of good practice. In the end, each company is free to install its
own cost management and cost-reporting system and to use one or the other
cost assessment method.
A format for cost data that ensures that companies along a supply chain report the
same type of cost, documenting how costs are allocated, promises to solve both the
denition and the “cost-type” issue, in case it is applied throughout the whole chain.
However, it seems to be difcult to arrive at a uniform format that can accommodate
all needs (Rebitzer 2005), and this objective appears rather theoretical.
Using activity-based costing can help to reduce the share of overhead costs and
thus the share of costs that need to be allocated; thus, it promises to arrive at more
consistent and comparable cost gures.
An employee, even if his responsibility comprise LCC, will rarely be able to
calculate all costs in a different way than the company’s cost accounting system. A
second best approach is, then, to state what types of costs are included in the data
given and reported. Nonmonetized costs, such as those derived from surveys indicat-
ing willingness to pay, are highly uncertain.
2.5.2 GEOGRAPHICAL DIFFERENCES AND EXCHANGE RATES
In LCC, which certainly involves global impacts and costs, the exchange rate varia-
tions render the nal result of the costing time-sensitive. Time and space change
the amount of costs. In a different location, identical products may be of completely
different value, and costs may need to be paid in a different currency, with oating
exchange rates. In a different time, prices and costs may be different. As an example,
in December 2001, 0.9 € equaled US$1, while in July 2003, the ratio was 1.15 € to
US$1 — about a 30% difference in less than 20 months. In November 2005, 1 liter
of petrol cost US$2.21 per gallon in the United States (US Department of Energy
2005), which equals about 0.49 € per liter, and 1.22 € per liter in Germany. A positive
discount rate can address future uncertainties (see Section 2.6.1).
Costs in different regions worldwide may be collected for an effective day and
transformed into 1 currency. Costs incurred at different times can be stated as such.
2.5.3 CONFIDENTIAL INFORMATION
The prot earned by selling a product is vital information for any company and is at
the same time highly interesting for the company’s competitors. Given that the price
is often publicly known and that the prot is calculated by price minus costs, one can
understand that cost data are often sensitive information. In the not so long history
© 2008 by the Society of Environmental Toxicology and Chemistry (SETAC)
30 Environmental Life Cycle Costing
of life cycle costing, several approaches for overcoming the “condentiality issue”
have been proposed.
A common way is stating a “price = cost” equivalency. Since the price is publicly
known, it is rather easy to collect. In general, the price is higher than the costs if
these exclude prots; in some cases, it may also be lower, as when losses are made.
A product’s price is also very convenient for estimating the costs of the whole supply
chain of the product.
The VDI (Verein Deutscher Ingenieure or Society of German Engineers) has
proposed a relative pricing system that allows stating the costs of a product in rela-
tion to a basic steel in relation to a basic, nonalloyed steel. Costs for this steel are
assessed, published, and updated. Relations of these cost data to other materials such
as metals, and to the volume and geometry of the product, are also provided (VDI
2225; Verein Deutscher Ingenieure 1984).
2.6 COST AGGREGATION
The last dimension of LCC concerns the manner in which the different costs, reve-
nues, and benets are aggregated. Though costs are unambiguously summed, unlike
environmental impacts, the selection of the appropriate indicator (e.g., net present
value) and the decision as to if discounting should be carried out merit consideration.
Further, one must also determine if a total cost over the life of the functional unit, or
a normalized (e.g., annual) cost, should be employed. The latter is particularly impor-
tant if 2 alternatives have different lifetimes and/or different operating costs or EoL
scenarios. This section will evaluate discounting for each of the 3 types of LCC.
2.6.1 DISCOUNTING
The reasons for discounting depend very much on the question to be addressed. In
conventional LCC, an individual rm may want to know if a prot can be made
on a technology choice. It then at least has to deal with the real cost of borrowing.
This market rate reects the reliability of the rm (though the investment could also
be nanced out of equity, and then the earnings–price ratio for the sector and rm
would dene the discount rate). Some rms, such as in the information technology
(IT), biotech, or pharmaceutical sectors, may have prot rates on investment above
20%, and hence should reckon with this rate. Typically, the discount rate for private
investments is between 5% and 20%, to be decided by the private decision maker.
For long-term projects in the public sector, such as utilities, the discount rates can
be as low as 2%. For societal LCC, the question is how society would evaluate the
postponement of costs or benets. Discounting of the LCC result (note that this is
different from discounting cash ows within the calculation procedure; see below) is
inconsistent with the steady-state environmental LCC, and, as such, environmental
LCC must present its results, for comparison with the long-term effects of LCA, in
a time-invariant manner. However, the use of discounted cash ows for money ows
occurring at different times within 1 product life cycle (usually for periods no longer
than 5 to 15 years, similar to the depreciation period) is commonly applied and does
not violate the steady-state assumption.
© 2008 by the Society of Environmental Toxicology and Chemistry (SETAC)
Modeling for Life Cycle Costing 31
2.6.1.1 Long-Term Discounting of Costs and
Environmental Impacts in Societal LCC
When analyzing the cost of a product system, it is tempting to use one (high) dis-
count rate for economic calculations and another, low one (often 0) for environmen-
tal impacts. There are also advocates for a declining discount rate, beginning with an
economic one (e.g., 10%) and phasing in, over the economic life, an environmental
one (e.g., 0.01%). One should also evaluate, for societal LCC, if discounting should
be the same for various environmental impacts. To discuss this issue, which can be
elaborated upon in depth (see Howarth 1995; Hellweg et al. 2003), it is useful to look
at some typical environmental impacts that often dominate LCA.
Climate change has a number of outcomes around a most likely middle value,
with low probability options in terms of runaway effects. Induced climate changes
will last for several centuries, while the inuences of climate change, including sea
level rise, will last longer. The effects on nature in terms of biodiversity loss will
last for as long as it takes to develop new species. A time horizon of a million years
seems beyond what anybody would reckon as relevant. However, a time horizon of
fewer than 1000 years seems reckless from a concerned point of view. Using a dis-
count rate of 0.1% halves the importance of effects every 700 years. Therefore, the
0.01% rate seems an order of magnitude not to surpass to keep the environmentally
concerned stakeholders on board.
Toxicity effects have a prole that is quite high at the outset, then decreases.
However, in current timeless fate models within life cycle impact assessments, which
also disregard natural background concentrations, heavy metals move to the oceans
and remain in solution there for well more than a million years. By adding up the
exposure times of individuals, weak effects in reality might still become dominant
in the LCA. There is concern that calculating costs now for a future population
much further away in time than humankind has lasted (let’s say 50000 generations)
is senseless due to many uncertainties as indicated in the questions and answers
above. For example, with inexpensive solar energy and hyperltration, the metals in
the ocean may be a valuable stock to be mined, with depletion a problem instead of
contamination. Using a 0.1% discount rate will fade out the 1 million years’ effects
to 0. Therefore, toxicity requires a rate of 0.001%. On the other hand, toxicity models
in life cycle impact assessment (LCIA) will also have to take time effects such as
deposition, which removes toxics from the biosphere, into account in order to appro-
priately assess long-term environmental impacts.
Within abiotic resource depletion, extracted elements clearly do not remain
underground, though they are still part of the mass of the (eco)system. With met-
als, for instance, there will be 1 part much more highly concentrated than in ores,
and 1 part dissipating to very low concentrations. Current depletion scores are very
difcult to link to time series. One approach is to couple depletion to the increased
energy cost of producing the resource as due to lower concentrations to be mined,
as in the environmental priority strategy (EPS) system (Steen 1999a, Steen 1999b).
The weakness of such an approach is that it assumes price levels and technologies
to be constant for a long time to come — essentially innitely. The historical fact of
the last centuries has been that technologies have developed rapidly, and have led to
© 2008 by the Society of Environmental Toxicology and Chemistry (SETAC)
32 Environmental Life Cycle Costing
a systematic decreasing of prices of primary resources (though there are exceptions),
apart from short-term uctuations, even with resources being constantly consumed.
Therefore, with abiotic depletion, the basis on which to start the discounting may be
weak. Using commercial rates will limit the time horizon of the effects to several
decades; using the societal rate of 0.1% will give a time horizon in the order of a
few thousand years for this effect (though the appropriate rate may also very much
depend on the specic resource that is depleted), which seems reasonable in the case
of resource depletion. A longer time frame for resources is not necessary, since a
certain level of depletion and thus increase of cost will always lead to adapted tech-
nology developments and substitution.
The aforementioned discussion indicates that the determination of an appropri-
ate discount rate for societal LCC is iterative and requires a sensitivity analysis. One
must dene the predominant impacts and use the discount rate that is the lowest
of any acceptable for the above-threshold impacts. Using the examples above, if
resource depletion (0.1%), climate change (0.01%), and toxicity (0.001%) were sig-
nicant impacts in a given societal LCC, one would be obliged to use the 0.001%
rate for discounting of the externalities. The reason is that if one were to apply the
discount rate for resource depletion (0.1%) to the costs of climate change and toxicity,
this would render the midterm effects of these impacts worthless.
The necessity of selecting the lowest discount rate from those available can best
be appreciated by examining how installations depreciate. An electrical power plant
may have a useful life of 30 years, and therefore the straight-line depreciation could
be 3% per annum. Much of the major equipment in the installation has a useful life
of 10 years and would be depreciated at 10% per annum, while smaller equipment
such as pumps would no longer function after 5 years and be depreciated at 20% per
annum. Should a depreciation rate of 20% per annum be applied to the infrastructure
itself, then any costs after 5 years (i.e., between years 6 and 30) would essentially be
discounted to 0. The analogy of depreciation permits one to appreciate why a sensi-
tivity study applied on the discount rate, given the various impacts, is necessary. Just
as is the case for the electrical power plant, if one were to use the resource depletion
discount rate (0.1%) for toxicity, all effects after 1000 years would be set to 0. While
this seems a long horizon, for toxicity, impacts may occur after tens of thousands of
years (e.g., for radioactive substances). Overall, the selection of a discount rate is 1
of the most critical parameters in an LCC, and the discount rate selected must be
appropriate for the case at hand. Further, if the LCC is to be publicly disclosed, the
discount rate selected will have to be part of the evaluation (and possibly the external
review work in analogy to the review requirements of ISO 14040/44 [2006] relating
to comparative assertions intended to be disclosed to the public).
The reader should note that the aforementioned reasoning holds for societal LCC
only. For conventional LCC, the market, or equity, rates are the starting point. The
conclusion may well be that it is normally useful to engage in both types of analysis.
The market-based analysis, with high discounting rates, shows the private cost and
protability of options, which may be used for establishing the private costs of cer-
tain environmental improvements. The societal analysis indicates how a trade-off
between the welfare effects of market effects and nonmarket effects can be made.
© 2008 by the Society of Environmental Toxicology and Chemistry (SETAC)
Modeling for Life Cycle Costing 33
Most economists advocate that this diversion is not tenable, though practical solutions
are lacking. One direction to look at is the (unwanted) steady state that the Japanese
economy has been in for approximately a decade, with real discounting rates indeed
close to 0. Table 2.3 summarizes the SETAC-Europe working group’s recommenda-
tions on discounting in LCC.
Case Study Box 4: Long-Term Discounting of Results
This case study box illustrates the use of different rates for long-term discounted
environmental impacts, based on the idealized washing machine case.
To render a comparison possible between costs and different environ-
mental impacts, the values indicated for the washing machine in Case Study
Box 7 have been set at 100% (environmental LCC: 1216 €, toxicity: 0.001 kg
benzene equivalent, climate change: 1657 kg CO
2
equivalent, and abiotic
resource depletion: 830 kg oil equivalent). For purposes of demonstration, no
predominant impact has been dened, resulting in the use of the lowest dis-
count rate, but all discount rates deduced in Section 2.6.1 have been applied:
the use of a rate of 0.1% for abiotic resource depletion halves the impor-
tance of the effect every 700 years, whereas the rate of 0.01% for climate
change halves the importance only every 7000 years. The low rate of 0.001%
for toxicity reects the 1-million-year effect of this environmental impact.
In contrast to the long-term discounting of environmental impacts, the costs
result of environmental LCC is not discounted as recommended (see Table 1.1).
Source: Real case study not available; hypothetical discounted results.
120
100
80
60
Indicator Value (%)
40
20
0
0 1000 2000 3000 4000 5000
Years
Long-term discounting up to 10 000 years
6000 7000 8000 9000 10000
0% (Env. LCC)
0.001% (Toxicity)
0.01% (Climate change)
0.1% (Abiotic resource depl.)
© 2008 by the Society of Environmental Toxicology and Chemistry (SETAC)
34 Environmental Life Cycle Costing
TABLE 2.3
Summary of recommended discounting of the life cycle costing results
LCC types Environmental LCC Societal LCC Conventional LCC
Discounting of results Inconsistent and not recommended
Recommended Recommended (though usually not applied)
Discounting type Discounting of the result is not usually
possible or easily done as activities leading to
inventory results are not normally specied in
time, and impacts in the environment are not
specied in time.
If discounting is carried out, it should be
done as described in either conventional or
societal LCC, as is the most relevant to the
case at hand. Both discounting approaches
could be relevant in 1 particular case,
implying that 1 case could use 2 discount
rates.
Use a social rate of social time preference
type for discounting rate of cost and benets
of economic activities (results of LCC).
There are several such discount rates, as
discussed in Section 2.6, and these go in the
direction of the Brundtland Commission’s
(1987) requirements, with an approximate
value below 0.1% per year though likely 1
or 2 orders of magnitude below this,
depending on the impacts. It is also possible
to distinguish discount rates for different
time horizons, going to very low rates for
very long horizons. Use this both for
economic cost and benets and for
environmental effects and externalities.
Use a market-based discount rate, typically 5
to15%, for cost and revenues of economic
activities (results of LCC). Do not apply this
to environmental effects and externalities. The
lowest rate to be applied would be the market
equity rate for a rm in a given sector,
corrected for ination, and the upper range
would be the internal rate used by
organizations for their intended return on
investment. This choice is up to the decision
maker. The lower limit, clearly, differs
geographically.
For environmental impacts of LCA type, no
time specication is present. This might be
developed, similar as for the CBA type of
approaches.
Remarks Time specication of inventory activities is
at variance with the basic assumptions of
LCA.
The assumption is that endpoint modeling for
external environmental effects is good
enough for this purpose and is capable of
being specied in time. This is the case only
very partially. The practical difculties in
modeling for discounting are explained with
3 examples in Section 2.6: climate change,
resource depletion, and toxic substances.
If applying the CBA type of discounted
externalities approach, do not mix the
economy-oriented scores and those on
external effects, as they are specied on
different assumptions. They just mean
something different and therefore cannot be
added.
Note: This must not be confused with the use of discounted cash ows within the time frame of the product life cycle, which, in any LCC type, depends on the goal and scope
and the duration time of a product life cycle.
© 2008 by the Society of Environmental Toxicology and Chemistry (SETAC)